

Question: Selected comparative statement data for Queen Products Company are presented below. All balance sheet data are as of December 31 2017 2016 Net sales Cost
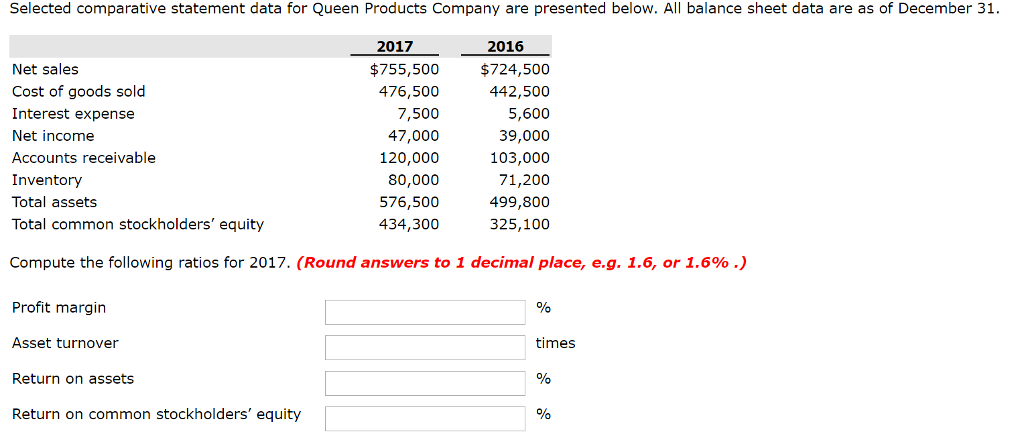
Selected comparative statement data for Queen Products Company are presented below. All balance sheet data are as of December 31 2017 2016 Net sales Cost of goods sold Interest expense Net income Accounts receivable Inventory Total assets Total common stockholders' equity $755,500 476,500 7,500 47,000 120,000 80,000 576,500 434,300 $724,500 442,500 5,600 39,000 103,000 71,200 499,800 325,100 Compute the following ratios for 2017. (Round answers to 1 decimal place, eg, 1.6, or 1.6% .) Profit margin Asset turnover Return on assets Return on common stockholders' equity times
Step by Step Solution
There are 3 Steps involved in it
1 Expert Approved Answer
Step: 1 Unlock

Question Has Been Solved by an Expert!
Get step-by-step solutions from verified subject matter experts
Step: 2 Unlock
Step: 3 Unlock