

Question: The data in the table to the right are based on the results of a survey comparing the commute time of adults to their Commute
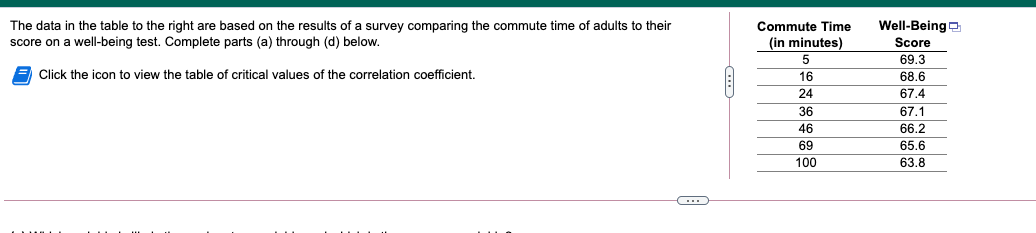
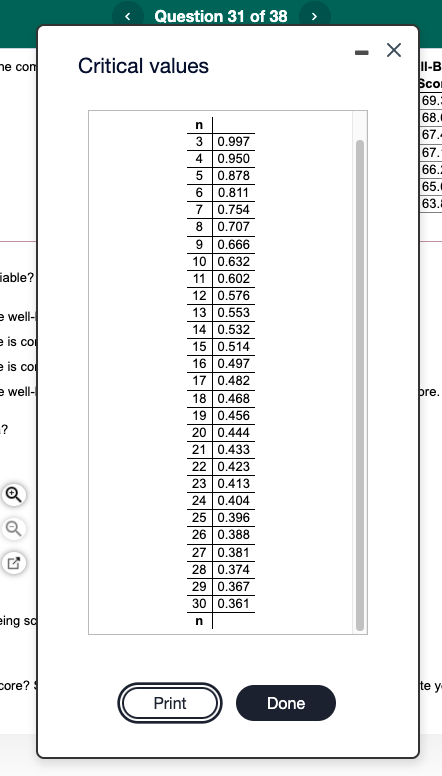

The data in the table to the right are based on the results of a survey comparing the commute time of adults to their Commute Time Well-Being score on a well-being test. Complete parts (a) through (d) below. (in minutes) Score 5 69.3 Click the icon to view the table of critical values of the correlation coefficient. 16 68.6 24 67.4 36 67.1 46 66.2 69 65.6 100 63.8
Step by Step Solution
There are 3 Steps involved in it
1 Expert Approved Answer
Step: 1 Unlock

Question Has Been Solved by an Expert!
Get step-by-step solutions from verified subject matter experts
Step: 2 Unlock
Step: 3 Unlock