New Semester
Started
Get
50% OFF
Study Help!
--h --m --s
Claim Now
Question Answers
Textbooks
Find textbooks, questions and answers
Oops, something went wrong!
Change your search query and then try again
S
Books
FREE
Study Help
Expert Questions
Accounting
General Management
Mathematics
Finance
Organizational Behaviour
Law
Physics
Operating System
Management Leadership
Sociology
Programming
Marketing
Database
Computer Network
Economics
Textbooks Solutions
Accounting
Managerial Accounting
Management Leadership
Cost Accounting
Statistics
Business Law
Corporate Finance
Finance
Economics
Auditing
Tutors
Online Tutors
Find a Tutor
Hire a Tutor
Become a Tutor
AI Tutor
AI Study Planner
NEW
Sell Books
Search
Search
Sign In
Register
study help
mathematics
statistics
Business Statistics 2nd Edition Robert A. Donnelly - Solutions
The following table shows the percentage of children at various age groups who use smartphones and laptop computers according to a survey conducted by the NPD Group.Construct a display that best presents these data with the goal of comparing percentages between devices for each age group.
A grocery store manager records the purchases of soda by the brands Coke (C), Pepsi (P), and Mt. Dew (M). The type of soda is also noted (regular or diet). The following table shows the brand and type of soda for the last 33 customers. These data can also be found in the Excel file soda.
Golf Galaxy, a major golf equipment retailer, would like to investigate the relationship between the brand of golf clubs (Taylor Made, Nike, and Callaway) and the age of the golfer who purchased them. The Excel file titled golf clubs. xlsx lists the golf club brand purchased by the last 100
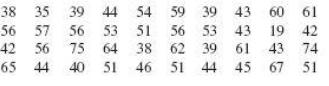
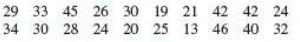
The class sizes for 40 courses currently being taught at Neumann University this semester are shown in the following table. These data can also be found in the Excel file class size. xlsx.a. Construct a stem and leaf display for these data. b. Construct a stem and leaf display, splitting the stems
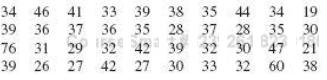
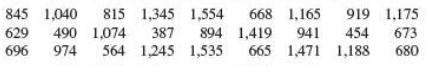
The following table shows the number of customers who have visited a T Mobile retail store during the past 40 days. These data can also be found in the Excel file T Mobile. xlsx.a. Construct a stem and leaf display for these data. b. Construct a stem and leaf display, splitting the stems from part
The Excel file MLB payroll. xlsx provides the payroll and number of wins for all the Major League Baseball teams during the 2012 season. Construct a scatter plot using these data. Describe the relationship between payroll and number of wins.
The Excel file titled gasoline prices.xlsx lists the average monthly price per gallon of regular gasoline in the United States from August 1990 to January 2013 from the U.S. Energy Information Administration. Construct a line chart using these data and describe the trend.
A major U. S. airline records the number of no- shows on a flight that operates each day from Philadelphia to Paris. A no- show is a passenger who purchases a ticket but fails to arrive at the gate at time of departure. The following table indicates the number of no- shows during the last 70
The Excel file titled airline performance. xlsx lists the status of 100 flights as either “ on time” or “ late” along with the airline for that flight.a. Construct a contingency table for these data.b. Construct a relative contingency table for these data.c. What conclusions could be drawn
The amount of time required to navigate through airport security can vary from city to city. The Excel file titled TSA times. xlxs shows the number of minutes that 60 passengers spent going through security at Chicago’s O’Hare International Airport and Seattle International Airport. Construct a
The Excel file titled US Housing Starts. xlsx lists the number of housing starts in the United States each year from 1970 to 2012 provided by the U.S. Department of Commerce. Construct a display that best describes these data.
A major electronics retailer was recently sued by 40 employees who were laid off by the company. The employees claimed they were victims of age discrimina-tion, which is illegal in the United States. The first of the two following tables shows the ages of the 40 employees who were laid off. The
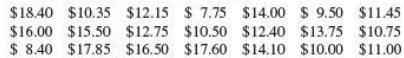
The Excel file labeled Lowes. xlsx lists the receipt total for 350 randomly selected customers for Lowes, a home improvement store.a. Using Excel and the 2k > n rule, construct a frequency distribution for these data.b. Using the results from part a, calculate the relative frequencies for each
The following table shows the 2009 carbon emissions, in tons per capita, for various countries around the world. These data can also be found in the Excel file titled emissions.xlsx.a. Calculate the mean. b. Calculate the median. c. Determine the mode. d. Which of these three measurements would
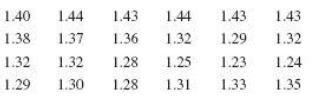
The following data represent the exchange rates for the euro in terms of U. S. dollars from March 2011 until February 2013. These data can also be found in the Excel file titled Euro.xlsx.a. Calculate the mean.b. Calculate the median.c. Determine the mode.d. Which of these three measurements would
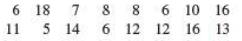
Consider the following data values:18 12 7 10 15 12 6 12 14a. Calculate the mean.b. Calculate the median.c. Determine the mode.d. Describe the shape of this distribution.
Mark McGwire, a former Major League Baseball player who broke Roger Maris’s single season record for home runs in 1998, recently admitted to using performance enhancing steroids, primarily during the second half of his 16year career. McGwire claimed he used the steroids strictly for
Consider the following sample data values:18 12 7 10 15 12 6 12 14a. Calculate the range.b. Calculate the variance.c. Calculate the standard deviation.
Consider the following sample data values:5 11 17 23 14 16 11 17a. Calculate the range. b. Calculate the variance. c. Calculate the standard deviation.
Consider the following population data values:14 41 0 20 26 38 8a. Calculate the range. b. Calculate the variance. c. Calculate the standard deviation.
Consider the following population data values:25 18 7 10 34 12a. Calculate the range. b. Calculate the variance. c. Calculate the standard deviation.
A local Holiday Inn asked customers to rate their stays on a scale of 1–10. The following list shows the ratings given by the last 10 customers:8 8 7 10 6 9 5 7 6 8a. Calculate the range. b. Calculate the variance. c. Calculate the standard deviation.
The following list represents the number of absent students from my last nine statistics classes:2 4 0 1 6 1 3 2 3a. Calculate the range. b. Calculate the variance. c. Calculate the standard deviation.
Every 10 years, the U.S. Census Bureau asks people about the number of people living within their households. The following list shows how eight households responded to the question.5 1 2 6 4 4 3 5a. Calculate the range. b. Calculate the variance. c. Calculate the standard deviation.
The following values represent the number of iPhones sold per day at a local AT& T retail store during the last 10 business days:14 5 6 11 18 10 10 12 3 15 a. Calculate the range. b. Calculate the variance. c. Calculate the standard deviation.
The following list shows the starting salaries, in thousands of dollars, for 11 recent college graduates with business degrees:36 32 40 35 32 41 35 44 38 37 40a. Calculate the range. b. Calculate the variance. c. Calculate the standard deviation.
Consider the following data values:6 14 17 1 16 17 6 19a. Calculate the mean.b. Calculate the median.c. Determine the mode.d. Describe the shape of this distribution.
Consider the following two sample data sets.Set 1:4 7 6 9 5Set 2:2 11 14 4 3a. Calculate the coefficient of variation for each data set. b. Which data set has more variability?
Consider the following two sample data sets.Set 1:11 21 15 24 20Set 2:3 8 0 5 6a. Calculate the coefficient of variation for each data set.b. Which data set has more variability?
Consider a sample with a mean equal to 40 and a standard deviation equal to 12. Calculate the z-scores for the following values: a. 50 b. 65 c. 35 d. 10
Consider the following sample data:9 7 15 10 4 12Calculate the z-scores for the following values:a. 13b. 16c. 8d. 4
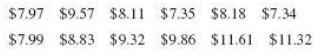
Assume the average price of a laptop computer is $ 800 with a standard deviation of $ 75. The following data represent the prices of a sample of laptops at Best Buy. Calculate the z-score for each of the following prices: a. $ 699 b. $ 949 c. $ 625 d. $ 849e. $ 999
The following data represent the number of minutes customers at Wendy’s had to wait in the drive through line before their order was taken.1 4 6 0 4 3 10 0 4Calculate the z-scores for the following times: a. 1 minute b. 3 minutes c. 7 minutes d. 12 minutes
Assume the average selling price for houses in a certain county is $ 325,000 with a standard deviation of $ 40,000. a. Determine the coefficient of variation. b. Calculate the z-score for a house that sells for $ 310,000. c. Using the empirical rule, determine the range of prices that includes 95%
The following data represent the number of touchdown passes per season thrown by the Benedict Arnold of the National Football League, Brett Favre (can you tell I’m a diehard Green Bay Packer fan?), during his first 18 seasons.0 18 19 33 38 39 35 31
Assume the average age of an MBA student is 31.6 years old with a standard deviation of 2.8 years. a. Determine the coefficient of variation. b. Calculate the z-score for an MBA student who is 28 years old.c. Using the empirical rule, determine the range of ages that will include 99.7% of the
Consider the following grouped sample data:Values Frequency0 to under 2 …………… 42 to under 4 ……………. 24 to under 6
Consider the following data values:14 62 0 20 26 38 8a. Calculate the mean.b. Calculate the median.c. Determine the mode.d. Describe the shape of this distribution.
Consider the following grouped sample data:Values Frequency5 to under 10 …………… 1510 to under 15 …………. 915 to under 20 …………
Consider the following grouped sample data:Values Frequency10 to under 30 …………… 2630 to under 50 ……………. 3550 to under 70 …………… 5170
A survey that collected demographic data from respondents asked them to categorize their annual incomes (in thousands of dollars) into the groups in the following table. The number of respondents for each income group is also shown in the table.Income
A walk in clinic for emergency room services maintains records of the number of patients it treats per day. The following table shows the frequency of the patient arrivals over the course of a 150 day period:Number of Patients per Day Frequency20 to under 40
The Olive Garden Italian Restaurant records the amount of time customers wait for a table on Saturday evenings.The following table lists the frequency of wait times for the last 100 customers.Number of Minutes per Customer Frequency0 to under 10
The following data represent the number of home runs Hank Aaron hit each year during his 23year baseball career.a. Calculate the mean and standard deviation of these data.b. Group these data into four classes with class boundaries of 10 to under 20, 20 to under 30, 30 to under 40, and 40 to under
Consider the following data set: 38 55 76 20 30 66 17 54a. Determine the 20th percentile.b. Determine the 40th percentile.c. Determine the 60th percentile.
Consider the following data set:22 5 18 20 13 33 30 8 39a. Determine the 15th percentile. b. Determine the 35th percentile. c. Determine the 85th percentile.
Consider the following data set:71 40 45 67 5 15 43 37 13 10Determine the percentile rank for the following values: a. 50 b. 30 c. 15
Consider the following data set:106 83 63 104 118 124 117 136 82 97 65 141Determine the percentile rank for the following values: a. 100 b. 75 c. 120
Consider the following data values:25 18 -7 10 34 –12a. Calculate the mean.b. Calculate the median.c. Determine the mode.d. Describe the shape of this distribution.
Consider the following data set:14 24 20 18 23 20 12 16 22 18 14 26 15a. Determine the quartiles for these data.b. Calculate the inter-quartile range for these data.
Identify the five number summary for the following data set:35 24 54 2 36 23 16 43 59 55 28 81
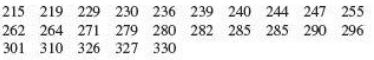
The following table shows the estimated populations of the 12 largest U.S. cities from the 2010 Census. These data can also be found in the Excel file titled city populations.xlsx.a. Calculate the 60th percentile for the data. b. Calculate the 20th percentile for the data. c. Calculate the 85th
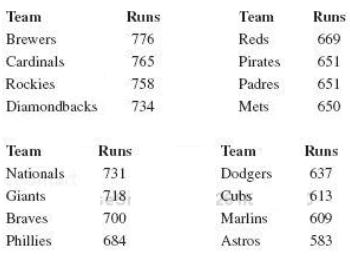
The following table shows the total runs scored by the 16 National League teams in Major League Baseball during the 2012 season. These data can also be found in the Excel file titled MLB runs.xlsx.a. Find the percentile rank for the runs scored by the Mets.b. Find the percentile rank for the
The following data set refers to the number of customers per day at a jewelry kiosk in Christiana Mall during a 20day period:a. Identify the first, second, and third quartiles. b. Determine the inter quartile range.
The following table shows the number of graduating students with business majors at Neumann University over the past 30 years in descending order:a. Construct a box and whisker plot for these data. b. Identify the five number summary.
Consider the following sample data for two variables.x 4 7 2 6 6y 4 9 5 5 7a. Calculate the sample covariance. b. Calculate the sample correlation coefficient. c. Describe the relationship between x and y.
Consider the following sample data for two variables.x 7 6 2 3y 6 8 11 5a. Calculate the sample covariance.b. Calculate the sample correlation coefficient.c. Describe the relationship between x and y.
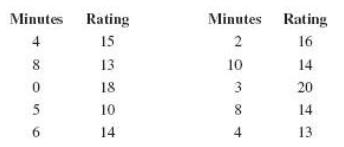
Comcast’s customer service department asks its customers to rate their over the phone service on a scale of 1–20 immediately after their service has been completed. The company then matches each customer’s rating with the number of minutes the person waited on hold. The following table shows
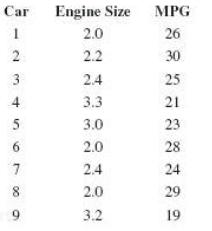
Suppose the EPA would like to investigate the relation-ship between the engine size of sedans and the miles per gallon (MPG) they get. The following table shows the engine size in cubic liters and rated miles per gallon for a selection of 2011 sedans and can also be found in the Excel file
The following table shows the monthly unemployment rate in the United States from January 2011 until January 2013. These data can also be found in the Excel file titled US unemployment. xlsx.a. Calculate the mean.b. Calculate the median.c. Determine the mode.d. Describe the shape of this
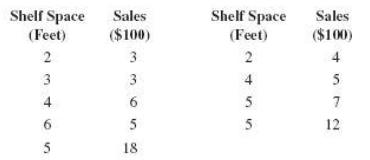
A regional manager at Acme Markets would like to develop a model to predict weekly sales of pet food based on the shelf space. The following table shows the results of data collected from nine randomly selected stores and can also be found in the Excel file Acme. xlsx.a. Calculate the sample
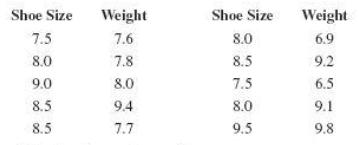
The American Board of Family Medicine would like to investigate the theory that a mother’s shoe size can be used to predict an infant’s birth weight. The following table records a random sample of the shoe sizes of 10 mothers and the birth weights of their infants and can also be found in the
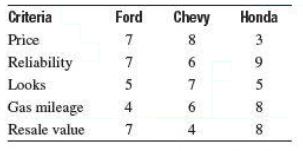
You are car shopping (lucky you!) and are considering a Ford, a Chevy, and a Honda. You are basing your decision on the criteria in the following table. You have also ranked each of the criterions based on its importance to you, with a rank of 5 being the most important: price (5), reliability (4),
The following data represent the number of days homes were on the market before being sold in New Castle County, Delaware, in 2014:a. Calculate the mean.b. Calculate the median.c. Determine the mode.d. Which of these three measurements would best describe the central tendency of the data? e.
The average number of hours that people of Brazil spend per month on social networking sites is nearly double the worldwide average, drawing the attention of companies such as Facebook. The following data represent the number of hours that a sample of people from Brazil spent on a social networking
Internet service providers compete on services such as download speeds that are measured in megabits per second (Mbps). The following data represent the download speeds that 16 Comcast customers experienced recently.a. Calculate the mean.b. Calculate the median.c. Determine the mode.d. Describe the
The Fan Cost Index measures the average cost for a typical family to attend a Major League Baseball game. The index comprises the prices of two adult average price tickets, two child average price tickets, two small draft beers, four small soft drinks, four regular size hot dogs, parking for one
A country’s fertility rate can have a major long term impact on its economic health. Low fertility rates eventually cause the average age of the population to skew higher, making it more difficult to fund programs such as social security. The following data represent a sample showing the number
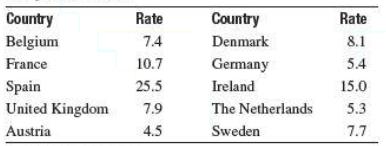
The following table lists the average monthly unemployment rate from July to September 2012 for various European countries.a. Calculate the range.b. Calculate the variance.c. Calculate the standard deviation.
Delta is one of the largest airlines in the world and also has one of the oldest fleets of planes. The following data represent the age, in years, of a sample of eight planes from Delta’s fleet.17 22 8 19 20 21 7 14a. Calculate the range for this sample.b. Calculate the variance for this
Bank of America stock prices at the end of each month from February 2012 until January 2013 are shown as below. These data can also be found in the Excel file titled Bank of America. xlsx.a. Calculate the mean.b. Calculate the median.c. Determine the mode.d. Describe the shape of this distribution.
The following data represent the number of pounds lost by 10 individuals who participated in a weight loss program. A negative number represents a weight loss, whereas a positive number represents a weight gain.12 8 15 10 4 6 9 5 8 –10a. Calculate the range.b. Calculate the variance.c. Calculate
Text messages have been a major source of revenue for cell phone carriers and for the first time in history the aver-age number of text messages per month decreased from the second to the third quarter of 2012. The Excel file text messages.xlsx lists the number of text messages sent last month from
A company operates two retail outlets at different locations. The following table lists the customer satisfaction ratings on a scale of 1–10 for each location:Store 1 Store 27 …………. 84 …………. 7 6
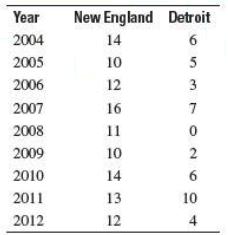
The following table shows the number of wins per season for the New England Patriots and Detroit Lions NFL teams from 2004 through 2012. This data can also be found in the Excel file NFL wins.xlsx.Which team experienced more variability with games won per season?
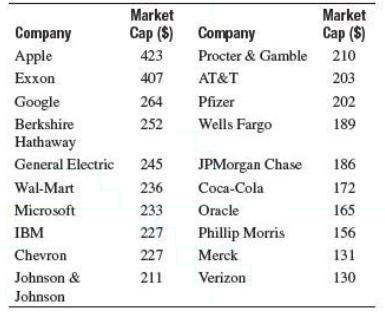
The following table lists the 20 largest companies in the world in 2013 ranked by their market capitalizations (in billions of dollars). A company’s market capitalization is defined as the number of its shares multiplied by the price per share. This data can also be found in the Excel file market
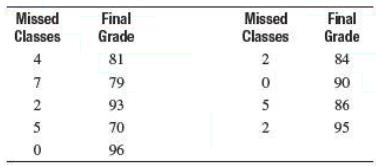
Suppose I recorded the attendance of my students in a recent statistics class because I wanted to investigate the relationship between the number of classes they missed and their final grades. The following table shows this data for a random sample of nine students. This data can also be found in
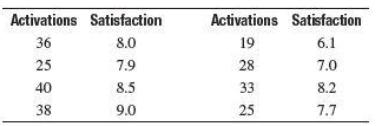
As a measure of productivity, Verizon Wireless records the number of customers each of its retail employees activates weekly. An activation is defined as either a new customer signing a cell phone contract or an existing customer renewing a contract. The following table shows the number of weekly
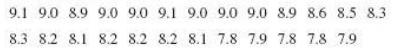
The Excel file labeled Customer service champs.xlsx lists the top 25 companies, with the best customer service scores ranked by Business Week in 2012.a. Determine the coefficient of variation.b. Calculate the z-score for a company with a score of 900.c. Test if the empirical rule holds true by
The following table shows the frequency distribution for the golf scores recorded during the 2012 Masters tournament:Score Frequency278–282 ………………. 6283–287
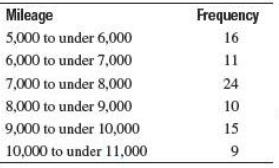
The following table shows the frequency distribution for the mileage on a sample of Avis rental cars:a. Calculate the approximate average mileage per car for the sample.b. Calculate the approximate variance and standard deviation for the sample.
The following frequency distribution shows the various levels of demand for a particular laptop computer sold by Costco during the last 50 business days. Determine the average number of laptops sold per day.Number of Laptops Frequency0
The following data represent the tips left by 21 customers for the wait staff at a local restaurant:a. Calculate the 30th percentile for the data.b. Calculate the 45th percentile for the data.c. Calculate the 65th percentile for the data.
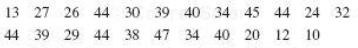
The following data represent the number of students enrolled in 20 business classes this semester at Wilmington University:a. Calculate the 20th percentile for the data.b. Calculate the 70th percentile for the data.c. Calculate the 90th percentile for the data.
The following table lists the SAT scores for 27 college students:a. Identify the first, second, and third quartiles.b. Determine the inter quartile range.
The following data represent the number of customers per day that entered an AT& T wireless retail center in Orlando over a 30day period.a. Identify the first, second, and third quartiles. b. Determine the inter quartile range.
The following tables record the times of swimmers in the 50m freestyle and 100m backstroke events at a recent meet. A particular swimmer swam the freestyle event in 33 seconds and the backstroke in 72 seconds. In which event did the swimmer perform better relative to the competition?50m Freestyle
The following table shows the final exam scores for the students from my last statistics class:Determine the percentile ranks for the following scores:a. 70b. 75c. 82d. 90
The following data indicate the battery life, in minutes, on a single charge, for 25 iPads:a. Construct a box and whisker plot for these data.b. Identify the five number summary.
The following data set represents the odometer mileage, in thousands of miles, of 30 used cars currently in inventory at Mojo Motors:a. Construct a box and whisker plot for these data. b. Identify the five number summary.
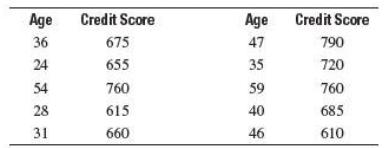
Fair Isaac, the company that developed the current credit score model used by most lenders today, would like to ex-amine the relationship between the age and credit score of an individual. The following table shows the credit scores and ages of 10 randomly selected people. This data can also be
Suppose Consumer Reports would like to investigate the relationship between the battery life, in hours, and the screen size, in diagonal inches, of a laptop computer. The following table shows a random sample of eight laptops and the battery life, in hours, and corresponding screen size, in inches,
Identify which of the following values are valid and not valid numbers for a probability:a. 5 4b. 0.04c. 200%d. 0.5e. 1/8f. 14%g. 3/3h. 0%i. 1.2
Determine the following probabilities:a. P (A) b. P (B) c. P (C) d. P (D)e. P (E)
Determine the following probabilities:a. P (A and C) b. P (A and D) c. P (B and E) d. P (A and B)
Determine the following probabilities:a. P (B or C) b. P (B or D) c. P (A or E) d. P (A or B)
Determine the following probabilities:a. P (A | C) b. P (C | A) c. P (B | E) d. P (E | B)
Consider the following experiment that involves rolling a pair of dice: Event A = Rolling a nine Event B = Rolling a pair (both dice the same) a. Are these two events mutually exclusive? Why or why not? b. Are these two events independent? Why or why not?
Consider the following experiment that involves flipping a single coin and rolling one sixsided die: Event A = Coin comes up tails Event B = Rolling a four with the die a. Are these two events mutually exclusive? Why or why not? b. Are these two events independent? Why or why not?
Consider an experiment with a standard 52card deck from which one card is randomly selected and not re-placed. Then a second card is randomly selected. Define the following events: Event A = The first card is a heart Event B = The second card is a heart a. Are these two events mutually exclusive?
Showing 22800 - 22900
of 88243
First
222
223
224
225
226
227
228
229
230
231
232
233
234
235
236
Last
Step by Step Answers
.png)
.png)
.png)
.png)
.png)
.png)
.png)
.png)
.png)
.png)

.png)
.png)
.png)
.png)
.png)
.png)

