New Semester
Started
Get
50% OFF
Study Help!
--h --m --s
Claim Now
Question Answers
Textbooks
Find textbooks, questions and answers
Oops, something went wrong!
Change your search query and then try again
S
Books
FREE
Study Help
Expert Questions
Accounting
General Management
Mathematics
Finance
Organizational Behaviour
Law
Physics
Operating System
Management Leadership
Sociology
Programming
Marketing
Database
Computer Network
Economics
Textbooks Solutions
Accounting
Managerial Accounting
Management Leadership
Cost Accounting
Statistics
Business Law
Corporate Finance
Finance
Economics
Auditing
Tutors
Online Tutors
Find a Tutor
Hire a Tutor
Become a Tutor
AI Tutor
AI Study Planner
NEW
Sell Books
Search
Search
Sign In
Register
study help
mathematics
statistics
Understanding Business Statistics 1st edition Stacey Jones, Tim Bergquist, Ned Freed - Solutions
Milton Maxwell Foods is attempting to use regression analysis to identify factors which might explain the behavior of sales revenue (measured in $ millions) for its franchise restaurants. Dummy variable x5 has been included in the regression model to indicate whether a particular restaurant has
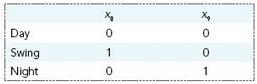
Pearson Manufacturing uses a multiple regression model to estimate production cost for units of its primary product. Dummy variables x8 and x9 have been included to indicate which shift— Day Shift, Swing Shift, or Night Shift— produced the unit. The dummy variables are assigned values as
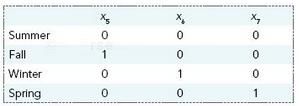
Gibson Products is using multiple regression analysis to try to relate a set of independent variables to the number of daily customer inquiries the company receives on its website. Gibson wants to include “season of the year” as one of the variables in the model. Since “season of the year”
As HR manager at Krameria, Inc., you are trying to determine whether there is a useful linear relationship between x, the years of education of a company employee, and y, the employee’s job performance rating after one year of employment with the company. Based on the records of 25 employees
As transportation manager at ABC Manufacturing, you are trying to determine whether there is a useful linear relationship between x, the distance that your product is shipped, and y, the amount of damage reported by customers receiving the shipment. For 30 randomly selected shipments, you used
Shown here is a sample of the times required to complete a full safety and structural inspection of a Boeing 747 aircraft. The table gives the number of inspection team members (x) and the time, in hours, (y) it took for the team to complete its job in four recent inspections. You plan to use the
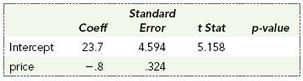
Below is additional output from the aircraft inspection analysis in Exercise 40.a. Calculate the missing t stat value and use it to deter-mine whether we can reject a β = 0 null hypothesis at the 5% significance level. b. Compare the t stat value that you computed in part a to the F value in
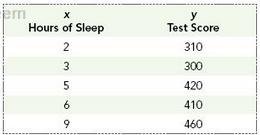
The five observations below show the results of a medical study examining the effect of limited sleep on reflexes for a sample of five college students. The first column of the table shows x, a student‘s hours of sleep the night before taking a basic reflex test. The second column shows y, the
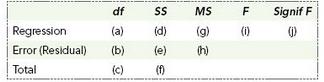
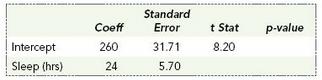
Below is additional output from the sleep reflex regression analysis in Exercise 42.a. Compute the missing t stat value and use it to determine whether we can reject a β = 0 null hypothesis at the 5% significance level. b. Compare the t stat value that you computed in part a to the F value in
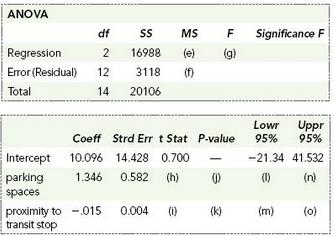
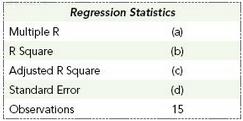
Calculate r (a) and r2 (b).In a study of central city multiplex movie theaters, 15 theaters located in cities of similar size were selected. The theaters have the same number of screens and show a similar collection of movies. The table below gives the results of a multiple linear regression
Calculate MS Regression (e), MS Error (f), and F (g). Use the F value to test the hypothesis that all i s are 0, at the 5% significance level. For the p value version of the test, us a statistical calculator or a statistical software package like Excel to find Significance F— the p value for F.In
Calculate t stat for the age coefficient (h) and for the monthly income coefficient (i). Use these values to test the statistical significance of the individual coefficients at the 5% significance level. For the p value version of the test, us a statistical calculator or a statistical software
Show the 95% confidence interval boundaries for β1, the regression coefficient for parking ((l) and (n)) and the 95% confidence interval boundaries for β2, the regression coefficient for proximity to public transport ((m) and (o)).In a study of central city multiplex movie theaters, 15 theaters
Calculate the adjusted r2 value (c). In a study of central city multiplex movie theaters, 15 theaters located in cities of similar size were selected. The theaters have the same number of screens and show a similar collection of movies. The table below gives the results of a multiple linear
Calculate the standard error of estimate (d).In a study of central city multiplex movie theaters, 15 theaters located in cities of similar size were selected. The theaters have the same number of screens and show a similar collection of movies. The table below gives the results of a multiple linear
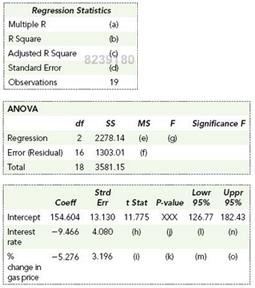
Fill in the values for r (a) and r2 (b). Interpret the value of r2.The table below shows some of the results of a multiple linear regression analysis intended to link the consumer confidence index to two independent variables: prevailing mortgage interest rate (x1) and the most recent one month
MS Regression (e), MS Error (f), and F (g). Use the F value to test the hypothesis that all s are 0, at the 5% significance level. For the p value version of the test, us a statistical calculator or a statistical software package like Excel’s to find Significance F— the p value for F.The table
MS Regression (e), MS Error (f), and F (g). Use the F value to test the hypothesis that all s are 0, at the 5% significance level. For the p value version of the test, us a statistical calculator or a statistical software package like Excel’s to find Significance F— the p value for F.The table
Show the 95% confidence interval boundaries for β1, the regression coefficient for interest rate, (l) and (n), and the 95% confidence interval boundaries for β2, the regression coefficient for gas price, (m) and (o).The table below shows some of the results of a multiple linear regression
Calculate the adjusted r2 value (c).The table below shows some of the results of a multiple linear regression analysis intended to link the consumer confidence index to two independent variables: prevailing mortgage interest rate (x1) and the most recent one month change in the price of gasoline
Calculate the standard error of estimate (d).The table below shows some of the results of a multiple linear regression analysis intended to link the consumer confidence index to two independent variables: prevailing mortgage interest rate (x1) and the most recent one month change in the price of
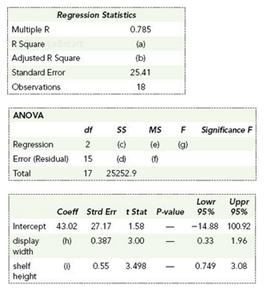
Calculate SS Regression (c), SS Error (d), MS Regression (e), MS Error (f), and F (g). Use the F value to test the hypothesis that all βs are0, at the 5% significance level.You have been conducting a study of supermarket sales of ProDay energy bars. The table below shows partial results of a
Calculate the estimated display width coefficient (h) and the estimated shelf height coefficient (i).You have been conducting a study of supermarket sales of ProDay energy bars. The table below shows partial results of a multiple linear regression analysis intended to link monthly sales to two
Which of the individual coefficients are significant at the 5% significance level? Explain.You have been conducting a study of supermarket sales of ProDay energy bars. The table below shows partial results of a multiple linear regression analysis intended to link monthly sales to two independent
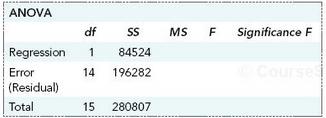
In a simple linear regression analysis attempting to link an independent variable x (average hours per week that a CEO spends at work) to a dependent variable y (size of a CEO’s house), the following ANOVA table was produced. Can the sample results represented here be used to reject a “β =
Calculate the adjusted r2 value (b).You have been conducting a study of supermarket sales of ProDay energy bars. The table below shows partial results of a multiple linear regression analysis intended to link monthly sales to two independent variables: the width of the display space (in inches)
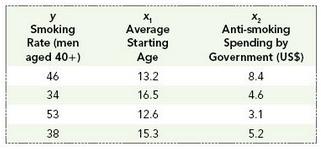
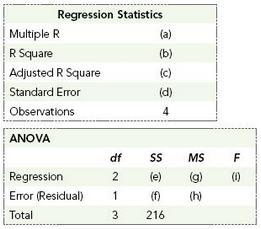
You are overseeing a study of cigarette smoking in the countries of Southeast Asia. As part of the study you plan to conduct a multiple linear regression analysis to try to explain the variation in smoking rates among the countries, using as the dependent variable, y the current smoking rate for
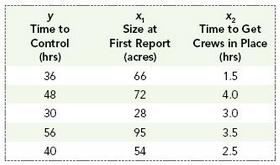
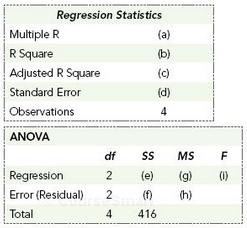
Smokejumpers West fights forest fires in the western states of the US. The company has developed a regression model to explain the variation in the length of time it takes to get a fire under control. The basic model uses two independent variables: the estimated size of the fire (in acres) when
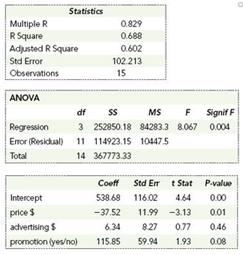
You have just completed a regression study in which you are attempting to link weekly sales of SeaFarer’s new sun block spray to three factors: price, advertising and use of a special point of purchase promotion. You used a dummy variable, x3 , to represent the promotion factor— assigning x3 a
You are planning a multiple linear regression analysis to predict profitability for companies in the region. One of the variables— type of company— is categorical. You plan to use dummy variables to introduce this factor into the model. There are five “type of company” categories:
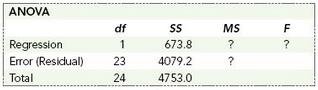
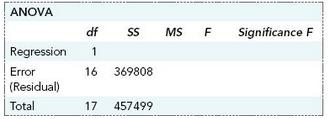
In a simple linear regression analysis attempting to link independent variable x (college GPA) to dependent variable y (starting salary), the following ANOVA table was produced. Can the sample results represented here be used to reject a β = 0 null hypothesis at the 5% significance level? Explain.
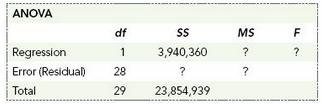
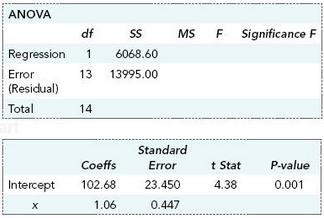
In a simple linear regression analysis attempting to link independent variable x (MBs of RAM memory) to dependent variable y ($ price of a notebook computer), the following ANOVA table was produced.a. Use the appropriate F test to determine whether the sample represented here can be used to reject
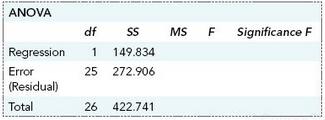
In a simple linear regression analysis attempting to link the earnings per share ratio (x) for a stock to its share price (y), the following ANOVA table was produced. a. Use an F test to decide whether sample results are sufficient to reject a β = 0null hypothesis at the 1% significance
Use the F table to determine the value beyond which you would find a. 1% of the values, if numerator degrees of freedom = 2 and denominator degree of freedom = 15. b. 5% of the values, if numerator degrees of freedom = 3 and denominator degrees of freedom = 26. c. 1% of the values, if
Prosser Medical Insurance is concerned that the variation in recovery times (measured in weeks) for heart bypass patients at Mercy Hospital differs from the variation in recovery times for similar bypass patients at Langdon Hospital. You take a random sample of 10 recent patients from Mercy and 10
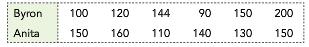
As sales reps for Nguyen Products, Byron and Anita have generally produced the same average weekly sales volume, but the “consistency” (as measured by the variance of weekly sales) of the two sales reps appears to be different. You take independent random samples of six weeks of sales for each
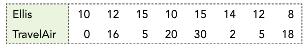
Average late arrival times for Ellis Airlines and TravelAir are about the same, but the variation in late arrival times appears to be different. You have taken independent random samples of eight arrival times for the two airlines and compared actual arrival times to scheduled arrival times to
Two independent samples of size 10 have been selected from two large populations, with the following results.Use analysis of variance to test the hypothesis that the two populations represented here have the same population mean. Use a significance level of 5%.
Three independent samples of size 15 have been selected from three large populations, with the following results.Use analysis of variance to test the hypothesis that the three populations represented here have the same population mean. Use a significance level of 1%.
You have conducted recent tests measuring peak pollution levels in various parts of the city. The average peak pollution readings for a sample of 21 days at each of three city locations are given in the table below, along with sample standard deviations.Test the hypothesis that the average peak
A test involving three brands of 3D monitors was conducted to compare average useful life for the three brands. Ten monitors of each brand were tested, with the following results:Test the hypothesis that the average useful life for the populations represented here is the same for all three brands.
The commercial fishing industry is concerned about the effect on fish of small amounts of pharmaceuticals in rivers and coastal waters where extensive fishing is done. In a recent study of the effects of the drug oxazepam (Science), researchers examined the behavior of fish (perch) exposed to
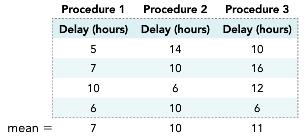
Goodwin and Gold is testing three automated routing procedures designed to reduce operational delays in the company’s main fabricating plant. In the test, 12 orders were randomly selected. Four of the orders were randomly assigned Procedure 1, four others were assigned Procedure 2, and the
Goveia Inc. is evaluating three possible bonus incentive programs for its sales staff. During a trial period lasting four months, five sales staff members were randomly assigned to each bonus program. Individual sales figures (in $millions) are shown below:a. Test the hypothesis that average sales
Use the F table to determine the value beyond which you would find a. 5% of the values, if numerator degrees of freedom = 4 and denominator degrees of freedom = 18. b. 5% of the values, if numerator degrees of freedom = 1 and denominator degrees of freedom = 12. c. 1% of the values, if
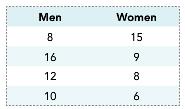
Excelsior Skin Products plans to market a new product to treat a chronic skin rash known as Extreme B.As part of its product testing, researchers at the company want to determine whether the performance of the product differs for men and women. The table below shows the results of a test in which
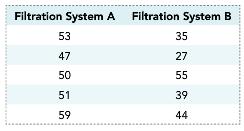
Western Metal Products is testing two new air filtration systems designed to reduce the fine particulate matter (PM2.5) that its furnaces release into the atmosphere through a large smokestack. Air samples were taken at five random times over the course of a one week test period for each of the two
. From your work in Exercise 14, fill in the ANOVA table below:
From your work in Exercise 15, fill in the ANOVA table below:
The Elkton District School Board is interested in evaluating the potential of three home school programs that have been proposed for the district. Over the past year, each of the three programs has been administered to a sample of 25 students. At the end of the year, each of the students in the
Elam Industries is interested in assessing customer response to four possible national promotional campaigns. Twenty retail stores were randomly selected for a preliminary trial. The twenty stores were randomly divided into four groups of five stores and each group was randomly assigned a different
Use the F table to determine the value beyond which you would find a. 5% of the values, if numerator degrees of freedom =6 and denominator degrees of freedom = 20. b. 5% of the values, if numerator degrees of freedom =1 and denominator degrees of freedom = 14. c. 1% of the values, if numerator
Use a statistical calculator or Excel’s F.INV.RT function to determine the value beyond which you would find a. 2% of the values, if numerator degrees of freedom =11 and denominator degrees of freedom = 25. b. 5% of the values, if numerator degrees of freedom = 3 and denominator degrees of
Use a statistical calculator or Excel’s F.DIST.RT function to determine the proportion of values in an F distribution that are greater than a. 3.762, if numerator degrees of freedom = 2 and denominator degrees of freedom = 16. b. 4.741, if numerator degrees of freedom = 1 and denominator
A random sample of size 10 from normal population A has a variance of 360. A second, independent, random sample of size 15 from normal population B has a variance of 240. Test a null hypothesis that the variances of the two populations are equal, using a 2% significance level. Report and explain
Use the F table to determine the value beyond which you would find a. 1% of the values, if numerator degrees of freedom = 3 and denominator degrees of freedom = 13. b. 5% of the values, if numerator degrees of freedom = 2 and denominator degrees of freedom = 20. c. 1% of the values, if
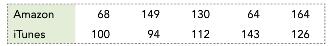
The average download times for movies downloaded from Amazon and iTunes are roughly the same, but there are indications that the variability in downloads times is different. In an experiment, you download the same HD movie five times from Amazon and five times from iTunes. Download times, in
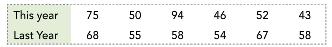
The average selling time for houses sold last year in the greater St. Louis area and the average selling time for houses sold in the area this year appear to be about the same, but the same may not be true of variance in selling times. You take independent random samples of six of last year’s
In a survey conducted among a random sample of college students, participants were asked, “How many hours per week do you use the Internet?” Sample sizes and average responses by race/ethnic group are given below. Assume sample standard deviations were as shown in the table.Use one-way analysis
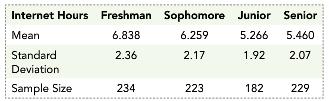
In the survey described in Exercise 32, student responses were also classified by year in college. The table below shows the average time on the Internet for the sample of students in each of the class years, as reported in the study. Assume the standard deviations and sample sizes are as shown in
The Canadian Broadcasting Company reported the results of a study involving the loudness of movies and the implications of excessive noise on hearing and health. You want to determine if there is a difference between the loudness of movies in the various movie rating categories. Below are the
In a test to compare the average LSAT (Law School Admission Test) scores for students who took one of three different prep courses for the exam, three samples of 21 students each were randomly selected to represent the three populations of students. The partially completed tables below summarize
Philadelphia€™s Sports Injury Center conducted a study to determine the relative effectiveness of four alternative rehabilitation programs designed for patients recovering from severe knee injuries. One of the variables used as an indicator of effectiveness is €œnumber of days
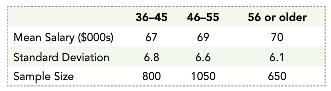
Information Week’s National IT Salary Survey showed that IT (information technology) staff between the ages of 36 and 45 earned, on average, $67,000 per year. The average increased to $69,000 for IT staff between the ages of 46 and 55, and to $70,000 for those 56 or older. Assume the table below
Golden Crest is testing two alternative order processing systems. System 1 processes orders on a simple “first come, first served” basis. System 2 uses a more sophisticated simulation based technique. Using a sample of 10 orders processed under System 1 and 10 orders processed under System 2,
Arakawa Pharmaceuticals of Japan is promoting a new arthritis relief drug, citing results of a recent test. The test was conducted using five patients in a test group and five patients in a control group. Patients in the test group were given the new drug for six months, while patients in the
Use a statistical calculator or Excel’s F.INV.RT function to determine the value beyond which you would find a. 10% of the values, if numerator degrees of freedom = 11 and denominator degrees of freedom = 29. b. 5% of the values, if numerator degrees of freedom = 8 and denominator degrees
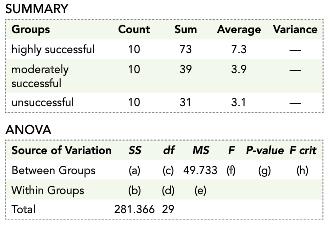
Enterprise.com conducted a study of tech startup companies over the past five years, classifying the companies as “highly successful,” “moderately successful,” and “unsuccessful.” In the study, a sample of 10 startups in each category was selected. In each case, the aggregate years of
Use a statistical calculator or Excel’s F.DIST.RT function to determine the proportion of values in an F distribution that are greater than a. 3.285, if numerator degrees of freedom = 4 and denominator degrees of freedom = 18. b. 5.701, if numerator degrees of freedom = 1 and denominator
Use a statistical calculator or Excel’s F.DIST.RT function to determine the proportion of values in an F distribution that are greater than a. 10.546, if numerator degrees of freedom = 5 and denominator degrees of freedom = 13. b. 3.651, if numerator degrees of freedom = 6 and denominator
A random sample of size 20 from normal population A has a variance of 2000. A second (independent) random sample of size 10 from normal population B has a variance of 2500. Test a null hypothesis that the variances of the two populations are equal, using a 2% significance level. Report and explain
A random sample of size 25 from normal population A has a variance of 140. A random sample of size 8 from normal population B has a variance of 165. Test the hypothesis that the variance of population A is equal to the variance of population B, using a 2% significance level. Report and explain your
Matrix Metals is concerned that the variation in the diameters (measured in millimeters) of the metal wafers produced by two of its metal stamping machines is different for the two machines. You take a random sample of 8 wafers from machine A and 8 wafers from machine B. The diameters in the
In a chi square calculation involving 10 independent terms (that is, with df = 10), a. 5% of the values will be greater than. b. 1% of the values will be greater than. c. 10% of the values will be greater than.
A recent study of higher education measured the proportion of college students who work in off campus jobs for at least 20 hours a week. Four samples, each composed of 200 randomly selected students, were used to represent four types of institutions: large four year state schools, small four year
The Head Start Program offers early childhood education support for children up to age 5 from low income families. In a recent study of fifth graders, a sample of 1500 students was randomly selected from each of three groups: children who had gone through the Head Start Program, children from low
The first sale of stock by a private company is known as an IPO (Initial Public Offering). The timing of the sale, the type of stock being issued (common or preferred), and the price at which the stock is being offered are important factors in an IPO’s success. Fairline Investments recently
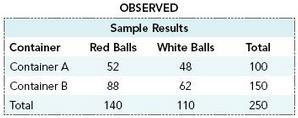
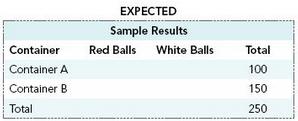
A sample of 100 colored balls is selected from a large container of red balls and white balls—call it Container A. A second sample, this one of size 150, is selected from another container of red balls and white balls—call it Container B. The table below shows results from the two samples.You
A random sample of 100 students is selected from the large student population at Eastern Colorado State University. A second sample, this one of size 200, is selected from the large student population at Western Colorado State University. A third sample, also of size 200, is taken from Southern
From Exercise 6: A random sample of 100 baseballs has been selected from each of two large crates of baseballs. One crate of baseballs was produced by Allen Sports Products; the other was produced by Baron Athletic Supply. Ten of the baseballs (10%) in the Allen sample and 18 of the baseballs (18%)
From Exercise 7: In a survey of 500 randomly selected high school teachers and 1000 randomly selected grade school teachers, 160 (32%) of the high school teachers and 260 (26%) of the grade school teachers cited lack of classroom discipline as a significant problem. Use an appropriate table format
From Exercise 8: DeAngelis Global Research is comparing the economic climate for small businesses in France, Germany, and Italy by randomly selecting a sample of 100 small businesses from each country and determining the proportion of small businesses in each sample that filed for bankruptcy during
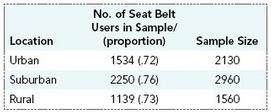
From Exercise 9: The table below shows the proportion of seat belts users by location (urban, suburban, and rural) for automobile passengers/ drivers in the US based on a survey done for the National Highway Traffic Safety Administration (DOT HS 809 557). Sample sizes are as shown in the right-hand
From Exercise 10: A recent study of higher education measured the proportion of college students who work in off campus jobs for at least 20 hours a week. Four samples, each composed of 200 randomly selected students, were used to represent four types of institutions: large four year state schools,
In a chi square calculation involving 5 independent terms (that is, with df = 5), a. 5% of the values will be greater than β.b. 10% of the values will be less than or equal to _______. c. 1% of the values will less than or equal to.
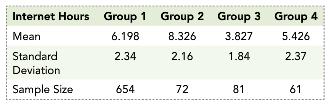
In a recent study of a mid career professionals conducted by the Labor Research Council, samples of size 100 were taken from each of three job categories: manufacturing (Group 1), education (Group 2); and health care (Group 3). In the Group 1 sample, the proportion of study participants who
The Santa Rosa Swim Club dominates American swimming, having produced more elite swimmers than any other swim club in the country. The swim club recently participated in a study evaluating the merits of two new breathing techniques for competitive swimmers. In the study, a sample of 120 swimmers
In their exit interviews last year, 30% of the seniors at the Ohio State University (OSU) said they planned to enter a graduate program immediately after graduation, 15% planned to spend the year after graduation traveling, 45% planned to start their professional careers, and 10% planned to
MyTube.com tells its advertisers that 45% of its users are in the 17 to 25 age demographic, 35% are in the 26 to 45 demographic, and the remaining 20% are in the 46 and older demographic. Perkins Music, one of the website’s advertisers, conducted a survey of 200 randomly selected MyTube users. In
It has been reported that 40% of adult Americans have made at least one common stock purchase within the past year, 60% have not. You survey 1000 randomly selected adult Americans and find the 486 people in the sample have made at least one common stock purchase during the past year, while the
A recent magazine article stated that 25% of the businesses that were audited by the Internal Revenue Service (IRS) last year had never been audited before, 40% had been audited one previous time, and 35% had been audited at least twice before. In a simple random sample of 100 businesses being
Online Now reports that 30% of online customers who fail to complete an online purchase fail because they are concerned about the security of their purchase information; 20% fail because they are confused by the purchase instructions; 35% fail because they change their mind about the purchase and
Hyper Inflation is a balloon wholesaler selling large variety packs of jumbo balloons that are supposed to contain 50% red balloons, 30% blue balloons, and 20% white balloons. You take a random sample of 200 balloons from one of the variety packs and find that 120 of the balloons are red, 44 are
I Believe I Can Fry, a magazine for aspiring chefs, reports that 40% of its readers are college grads, 30% have some college education, 20% have a high school education, and 10% did not graduate high school. In a sample of 100 readers of the magazine, 32 readers were college graduates, 42 had some
Garland Industries inspects samples of product from each large production batch and classifies inspected items as High Pass, Pass, Marginal Pass, and Unacceptable. Historically, the company produces batches in which 50% of the units can be classified as High Pass, 30% can be classified as Pass, 15%
In a chi square calculation involving eight independent terms (that is, with df = 8), a. 5% of the values will be greater than _______. b. 95% of the values will be less than or equal to _______. c. 1% of the values will be greater than _______.
Sorta Ice Cream sells a new soy-based ice cream substitute. The company is convinced that 40% of people will prefer vanilla, 25% will prefer chocolate, 15% will prefer strawberry, and the rest will prefer some other flavor. Sorta is planning its daily production schedule based on these figures. In
Business Monthly reports that currently 20% of all American small businesses are “highly profitable,” 40% are “marginally profitable,” 35% are “struggling,” and the remaining 5% are “insolvent.” In a random sample of 500 small businesses, and using Business Monthly’s criteria, you
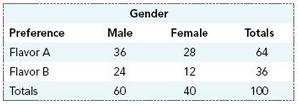
A random sample of 100 consumers is selected to help determine consumer preferences for two proposed new soft drink flavors. Results from the sample appear below:Use a chi square test of independence to test a null hypothesis that flavor preference is independent of gender for the population
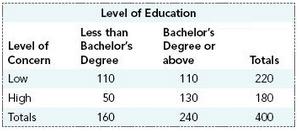
A random sample of 400 Internet shoppers has been selected to examine shopper concerns about security on the Internet. One of the aims of the study is to determine whether the level of shopper concern is related to the level of the shopper’s education. Results from the sample appear below:Use a
Showing 22600 - 22700
of 88243
First
220
221
222
223
224
225
226
227
228
229
230
231
232
233
234
Last
Step by Step Answers


.png)

.png)
.png)
.png)
.png)
.png)
.png)
.png)
.png)
.png)
.png)
.png)
.png)
.png)
.png)
.png)
-1.png)
-2.png)