New Semester
Started
Get
50% OFF
Study Help!
--h --m --s
Claim Now
Question Answers
Textbooks
Find textbooks, questions and answers
Oops, something went wrong!
Change your search query and then try again
S
Books
FREE
Study Help
Expert Questions
Accounting
General Management
Mathematics
Finance
Organizational Behaviour
Law
Physics
Operating System
Management Leadership
Sociology
Programming
Marketing
Database
Computer Network
Economics
Textbooks Solutions
Accounting
Managerial Accounting
Management Leadership
Cost Accounting
Statistics
Business Law
Corporate Finance
Finance
Economics
Auditing
Tutors
Online Tutors
Find a Tutor
Hire a Tutor
Become a Tutor
AI Tutor
AI Study Planner
NEW
Sell Books
Search
Search
Sign In
Register
study help
mathematics
statistics
Business Statistics 2nd Edition Robert A. Donnelly - Solutions
Recently, Seasons Pizza was receiving customer complaints about erratic pizza delivery times. To address this issue, Seasons made some operational changes in its restaurant and added more delivery people to its staff. To study the effectiveness of these changes, Seasons would like to test the
Utz Pretzels produces hard pretzels and packages them in 16 ounce bags. However, the size of each pretzel makes it challenging to fill each bag to precisely 16 ounces. When the filling process is working normally, the standard deviation of the bag weights equals 0.25 ounces. To test if this
Refrigerator manufacturers design their freezer units to maintain temperatures within a certain range. Too much temperature variation can result in food spoiling due to thawing. Too little temperature variation can cause higher energy costs as the refrigerator’s compressor cycles on and off more
Identify the appropriate critical F score for the following scenarios:a. n1 = 16, n2 = 10, and α = 0.05.b. n1 = 28, n2 = 22, and α = 0.01.c. n1 = 15, n2 = 20, and α = 0.10.
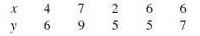
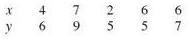
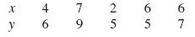
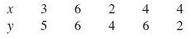
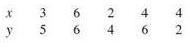
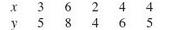
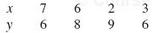
Consider the following ordered pairs:Calculate the sample correlation coefficient.
Using α = 0.05 and the data from Problem 14.9, test if the population correlation coefficient between the starting salary and the GPA of a University of Delaware business graduate is greater than zero. What conclusions can you draw?In Problem
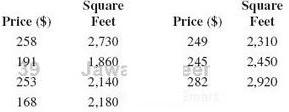
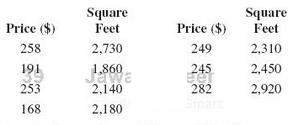
The following table shows the selling prices, in thousands of dollars, and the square footages of seven randomly selected houses recently sold by Century 21 Realtors.Determine the sample correlation coefficient between a house’s selling price and its square footage.
Using α = 0.10 and the data from Problem 14.11, test the significance of the population correlation coefficient between a house’s selling price and its square footage. What conclusions can you draw?In Problem
Consider the following set of ordered pairs:a. Calculate the slope and y intercept for these data.b. Calculate the total sum of squares (SST).c. Partition the sum of squares into the SSR and SSE.
Using the data from Problem 14.13, calculate the sample coefficient of determination and test the significance of the population coefficient of determination using α = 0.05.In Problem
Consider the following set of ordered pairs:a. Calculate the slope and y intercept for these data.b. Calculate the SST.c. Partition the sum of squares into the SSR and SSE.
Using the data from Problem 14.15, calculate the sample coefficient of determination and test the significance of the population coefficient of determination using α = 0.05.In Problem
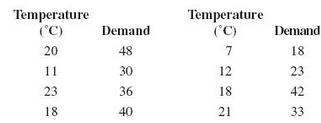
The following table shows the hot dogs bought from a street vendor over the course of eight days (“Demand”). Also shown is the temperature for each day in degrees Celsius.a. Calculate the slope and y intercept for the linear regression equation for these data.b. Predict the demand for hot dogs
Use the data from Problem 14.17 to answer the following questions:a. Calculate the SST.b. Partition the total sum of squares into the SSR and SSE.c. Calculate the sample coefficient of determination.d. Test the significance of the population coefficient of determination using α = 0.05.In Problem
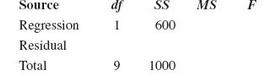
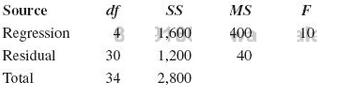
Consider the following partially completed ANOVA summary table:a. Complete the remaining entries in the table.b. How many ordered pairs are in this sample?c. Calculate the sample coefficient of determination.d. Using α = 0.05, what conclusions can be made about the population coefficient of
Perform a hypothesis test with the data from Problem 14.1 to determine if the population correlation coefficient is not equal to zero using α = 0.05. What are your conclusions?In Problem
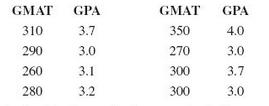
The following data set shows the entrance exam score (Verbal GMAT) for each of eight MBA students along with his or her grade point average (GPA) upon graduation.a. Calculate the slope and y intercept for the linear regression equation for these data.b. Verify your results using Excel.
Use the data from Problem 14.20 to answer the following questions:a. Calculate the SST.b. Partition the SST into the SSR and SSE.c. Calculate the sample coefficient of determination.d. Test the significance of the population coefficient of determination using α = 0.05.In Problem
Consider the following set of ordered pairs:Assuming that the regression equation is y = 3.045 + 0.409x and the SSE = 9.727, construct a 95% confidence interval for x = 5.
Using the data in Problem 14.22, construct a 95% prediction interval for x = 5.In Problem
Consider the following set of ordered pairs:Assuming that the regression equation is y = 1.679 + 0.584x and the SSE = 3.547, construct a 90% confidence interval for x = 3.
Using the data in Problem 14.24, construct a 90% prediction interval for x = 3.In Problem
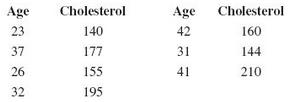
As part of a research program for a new cholesterol drug, Johnson Pharmaceuticals would like to investigate the linear relationship between the ages and LDL (low density lipoprotein) cholesterol levels of men. The following data set shows the ages and LDL cholesterol levels of seven randomly
Use the data in Problem 14.26 to construct a 95% prediction interval to estimate the LDL cholesterol level of a 30 year old man. Verify your results with PHStat.In Problem
Data in the Excel file points per game. xlsx show the number of wins eight teams had during a recent NFL season. Also in this file are the average points each team scored per game during the season.a. Construct a 90% confidence interval to estimate the average number of wins for teams that scored
Use the data in Problem to construct a 90% prediction interval estimating the number of wins a team that scores an average of 21 points a game will have. Verify your results using PHStat.
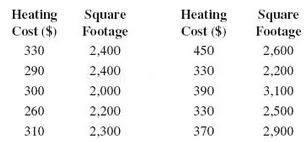
Suppose the Department of Energy would like to investigate the linear relationship between the cost of heating a home during the month of February in the Northeast and the home’s square footage. Data for a random sample of 10 homes are as follows:a. Construct a 90% confidence interval to estimate
Use the data in Problem 14.30 to construct a 90% prediction interval to estimate the cost in February to heat a Northeast home that is 2,400 square feet. Verify your results using PHStat.In Problem
Consider the following set of ordered pairs:Assuming that the regression equation is y = 1.886 + 0.977x and that the SSE = 0.7955, test to determine if the slope is not equal to zero using α = 0.05.
Using the data in Problem 14.32, construct a 95% confidence interval for the slope.In Problem
Consider the following set of ordered pairs:Assuming that the regression equation is y = 3.693 + 0.285x and that the SSE = 7.650, test to determine if the slope is not equal to zero using α = 0.10.
Using the data in Problem 14.34, construct a 90% confidence interval for the slope.In Problem
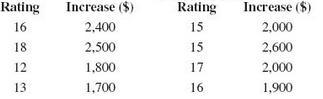
The Human Resource Department at Neumann University would like to examine the linear relationship between a faculty member’s performance rating (measured on a scale of 1– 20) and his or her annual salary increase. The following table shows these data for eight randomly selected faculty members
Using the data in Problem 14.36, construct a 95% confidence interval for the regression slope.In Problem
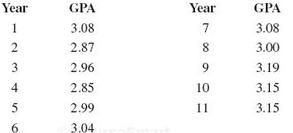
Wilmington University is concerned about the presence of grade inflation, which is defined as an increase in the average GPA of the institution’s students over time without a comparable increase in academic standards. To investigate this phenomenon, the average GPA for the student body was
Using the data in Problem 14.38, construct a 95% confidence interval for the regression slope.In Problem
Perform a hypothesis test with the data from Problem 14.3 to determine if the population correlation coefficient is less than zero using α = 0.05. What are your conclusions?In Problem
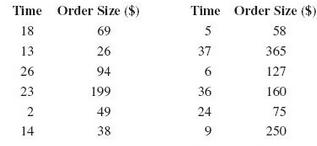
Suppose the Internet retailer Buy.com would like to investigate the linear relationship between the amount of time in minutes a purchaser spends on its Web site and the amount of money he or she spends on an order. The following table shows the data from a random sample of 12 customers and can also
Using the data in Problem 14.40, construct a 95% confidence interval for the regression slope.In Problem
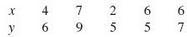
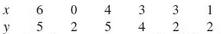
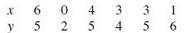
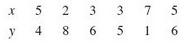
Consider the following set of ordered pairs:a. Calculate the correlation coefficient.b. Using α = 0.05, perform a hypothesis test to determine if the population correlation coefficient is less than zero.
Answer the following questions using the data from Problem 14.42:a. Calculate the slope and the y intercept for the regression equation.b. Calculate the SST.c. Partition the SST into the SSR and the SSE.In Problem
Answer the following questions using the data from Problem 14.42:a. Calculate the coefficient of determination.b. Using α = 0.05, test the significance of the population coefficient of determination.In Problem
Answer the following questions using the data from Problem 14.42:a. Construct a 95% confidence interval for an average value of y given that x = 4.b. Construct a 95% prediction interval for y given that x = 4.In Problem
Answer the following questions using the data from Problem 14.42:a. Using α = 0.05, test for the significance of the regression slope.b. Construct a 95% confidence interval for the population slope.In Problem
Suppose the Environmental Protection Agency (EPA) would like to investigate the linear relationship between the engine size of sedans and the miles per gallon (MPG) they get. Data from the Excel file engine size.xlsx show the engine size in cubic liters and rated miles per gallon for a selection of
Answer the following questions using the data from Problem 14.47:a. Calculate the coefficient of determination.b. Using α = 0.05, test the significance of the population coefficient of determination.c. Construct a 95% confidence interval for the average MPG of a 2.5 cubic liter engine.d. Construct
Answer the following questions using the data from Problem 14.47:a. Using α = 0.05, test for the significance of the regression slope.b. Construct a 95% confidence interval for the population slope.c. What conclusions about engine size and MPG can be drawn from these results?In ProblemSuppose the
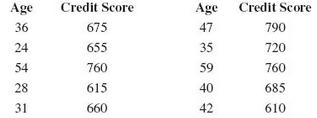
Fair Isaac, the company that developed the credit score model used by most lenders today, would like to examine the linear relationship between the age and credit score of an individual. The following table shows the credit scores and ages of 10 randomly selected people:Determine the sample
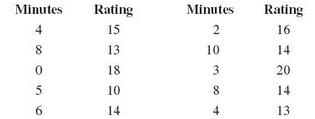
Comcast’s customer service department asks its customers to rate their over the phone service on a scale of 1–20 immediately after their service has been completed. The company then matches each customer’s rating with the number of minutes the person waited on hold. The following table shows
Answer the following questions using the data from Problem 14.50:a. Calculate the coefficient of determination.b. Using α = 0.05, test the significance of the population coefficient of determination.c. Construct a 90% confidence interval for the average customer rating from customers who are on
Answer the following questions using the data from Problem 14.50:a. Using α = 0.05, test for the significance of the regression slope.b. Construct a 95% confidence interval for the population slope.c. What conclusions about customer rating and time on hold can be drawn from these
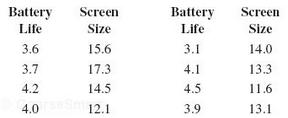
Suppose Consumer Reports would like to investigate the linear relationship between the battery life, in hours, and the screen size, in diagonal inches, of a laptop computer. The following table shows a random sample of eight laptops and the battery life and corresponding screen size of each. These
Answer the following questions using the data from Problem 14.53:a. Calculate the coefficient of determination.b. Using α = 0.05, test the significance of the population coefficient of determination.c. Construct a 95% confidence interval for the average battery life for a laptop with
Answer the following questions using the data from Problem 14.53:a. Using α = 0.05, test the significance of the regression slope.b. Construct a 95% confidence interval for the population slope.c. What conclusions about battery life and screen size can be drawn from these results?In Problem
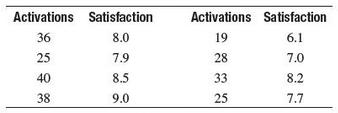
As a measure of productivity, Verizon Wireless records the number of customers each of its retail employees activates weekly. An activation is defined as either a new customer signing a cell phone contract or an existing customer renewing a contract. The following table shows the number of weekly
Answer the following questions using the data from Problem 14.56:a. Calculate the correlation coefficient for this sample.b. Using α = 0.01, test to determine if the population correlation coefficient is not equal to zero.c. What conclusions can be made based on these results?In Problem
Answer the following questions using the data from Problem 14.56:a. Calculate the coefficient of determination.b. Using α = 0.01, test the significance of the population coefficient of determination.c. Construct a 99% confidence interval for the average number of activations made by an employee
Answer the following questions using the data from Problem 14.56:a. Using α = 0.01, test for the significance of the regression slope.b. Construct a 99% confidence interval for the population slope.c. What conclusions about the number of weekly activations and job satisfaction can be drawn from
Using the data from Problem 14.5 and α = 0.02, test if the population correlation coefficient between a person’s age and credit score is different than zero. What conclusions can you draw?In Problem
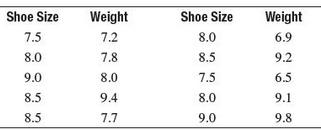
Answer the following questions using the data from Problem 14.60:a. Calculate the coefficient of determination.b. Using α = 0.10, test the significance of the population coefficient of determination.c. Construct a 90% confidence interval for the average birth weight for a maternal shoe size of
Answer the following questions using the data from Problem 14.60:a. Using α = 0.10, test for the significance of the regression slope.b. Construct a 90% confidence interval for the population slope.c. What conclusions about the maternal shoe size and birth weight can be drawn from these results?d.
Zagat surveys airline customers on a 30 point satisfaction scale measuring comfort, service, and food for both domestic and international flights. The Excel file Zagat.xlsx contains survey results that were recently collected showing the average scores for various airlines.a. Calculate the
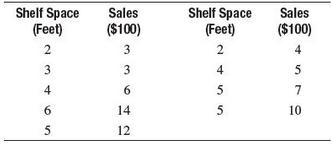
A regional manager at Acme Markets would like to develop a model to predict weekly sales of pet food based on the shelf space. The following table shows the data collected from nine randomly selected stores and can also be found in the Excel file Acme. xlsx.a. Construct a scatter plot for these
Answer the following questions using the data from Problem 14.65:a. Calculate the correlation coefficient for this sample.b. Using α = 0.05, perform a hypothesis test to determine if the correlation coefficient is greater than zero.c. What conclusions can be drawn based on these results?
Answer the following questions using the data from Problem 14.65:a. Calculate the coefficient of determination.b. Using α = 0.05, test the significance of the population coefficient of determination.c. Construct a 95% confidence interval for the average sales from 4.0 feet of shelf space.d.
Answer the following questions using the data from Problem 14.65:a. Using α = 0.05, test for the significance of the regression slope.b. Construct a 95% confidence interval for the population slope.c. What conclusions about the shelf space and sales can be drawn from these results?d. Verify your
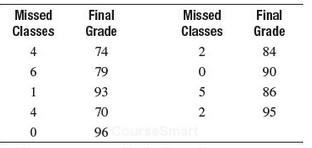
Suppose I recorded the attendance of my students in a recent statistics class because I wanted to investigate the linear relationship between the number of classes they missed and their final grades. The following table shows these data for a random sample of nine students and can also be found in
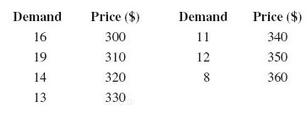
Best Buy would like to investigate the linear relationship between the selling price of a Canon PowerShot digital camera and the demand for it. The following table shows the weekly demand for the camera in one particular market along with the corresponding price:Determine the sample correlation
Answer the following questions using the data from Problem 14.69:a. Calculate the correlation coefficient for this sample.b. Using α = 0.05, perform a hypothesis test to determine if the correlation coefficient is less than zero.c. What conclusions can be drawn based on these results?In Problem
Answer the following questions using the data from Problem 14.69:a. Calculate the coefficient of determination.b. Using α = 0.05, test the significance of the population coefficient of determination.c. Construct a 95% confidence interval for the average grade of students who missed two classes.d.
Answer the following questions using the data from Problem 14.69:a. Using α = 0.05, test for the significance of the regression slope.b. Construct a 95% confidence interval for the population slope.c. What conclusions about missed classes and final grade can be drawn from these results?d. Verify
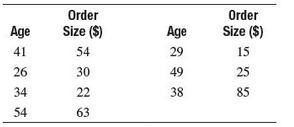
Suppose GNC, a vitamin and supplement supplier, would like to investigate the relationship between the size of an order and the age of the customer who ordered it. This information could allow GNC to target its promotions to specific age groups. The following table shows the ages for seven randomly
Answer the following questions based on the data from Problem 14.73.a. Calculate the slope and the y intercept for the regression equation.b. Predict the order size of a 32 year old customer.c. Provide an interpretation for the value of the slope.d. Calculate the total sum of squares.e. Partition
Answer the following questions based on the data from Problem 14.73.a. Calculate the coefficient of determination.b. Test the significance of the population coefficient of determination using α = 0.05.c. Construct a 95% confidence interval for the average order size for a 40 year old customer.d.
Answer the following questions based on the data from Problem 14.73.a. Test for the significance of the regression slope using α = 0.05.b. Construct a 95% confidence interval for the population slope.c. What conclusions about the order size and customer’s age can be drawn from these results?d.
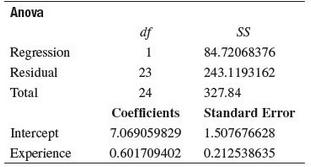
A Buick dealership would like to develop a regression model that would predict the number of cars sold per month by a dealership employee based on the employee’s number of years of sales experience. The following regression output was developed based on a random sample of employees.a. Predict the
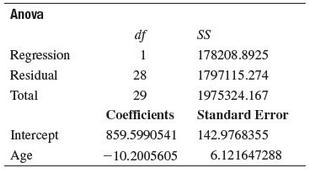
Mike Lynch manages a real estate firm in Myrtle Beach, South Carolina, and would like to construct a model to help him predict the selling price of beach properties for his customers based on the age of the house in years. Mike has collected a random sample of home sales from the area and generated
Each week during the NCAA men’s college basketball season, teams are ranked according to two polls— the AP Poll and the Coach’s Poll. Each team’s position is determined by the number of points received by the polls. The Excel file NCAA basketball.xlsx lists the points 24 teams received for
Using α = 0.10 and the data from Problem 14.7, test if the population correlation coefficient between the selling price and the demand for the camera is less than zero. What conclusions can you draw?In Problem
Suppose Cars.com would like to describe the linear relationship between the odometer mileage of a used 2010 Ford Explorer and its asking price. The Excel file Explorer. xlsx contains data for these variables for 40 used 2010 Explorers currently on the market. Use Excel and PHStat to answer the
The Excel file MLB 2012 Payroll. xlsx contains the total payroll in millions of dollars for each Major League Baseball team at the start of the 2012 season along with the total number of each team’s wins at the end of the season. Use Excel and PHStat to answer the following questions:a. Construct
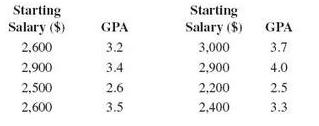
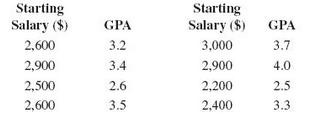
The University of Delaware would like to describe the linear relationship between the grade point average (GPA) and the starting monthly salary of a graduate who earned a business degree from the university. The following table shows the monthly starting salaries for eight graduates of the business
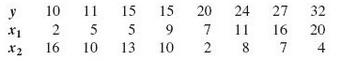
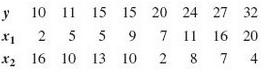
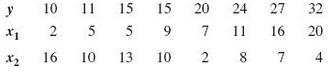
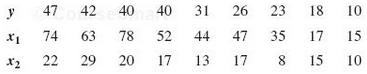
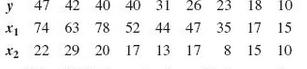
Consider the following set of dependent and independent variables. These data can also be found in the Excel file Prob 151.xlsx.a. Using PHStat, construct a multiple regression model with these data.b. Interpret the meaning of the values for b1 and b2.c. Provide an estimate for y when x1 = 10 and
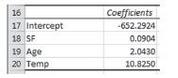
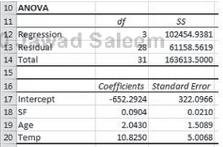
Delmarva Power is a utility company that would like to predict the monthly heating bill for a household in Kent County during the month of January. A random sample of households in the county was selected and their January heating bill recorded along with the following variables: SF: the square
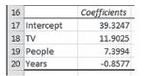
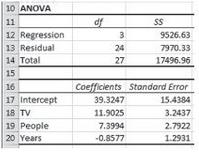
Comcast would like to develop the ability to predict the monthly cable bill for a customer. A multiple regression model was developed using a random sample of customers using the following independent variables: TV: the number of televisions in the household People: the number of people living in
Consider the following set of dependent and independent variables. These data can also be found in the Excel file Prob 151.xlsx.a. Using PHStat, identify the SST, SSR, and SSE.b. Calculate the multiple coefficient of determination.c. Test the significance of the overall regression model using α =
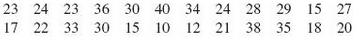
Consider the following set of dependent and independent variables. These data can also be found in the Excel file Prob 153.xlsx.a. Using PHStat, identify the SST, SSR, and SSE.b. Calculate the multiple coefficient of determination.c. Test the significance of the overall regression model using α =
Consider the following ANOVA table for a multiple regression model:a. What is the size of this sample?b. How many independent variables are in this model?c. Calculate the multiple coefficient of determination.d. Test the significance of the overall regression model using α = 0.05.e. Calculate the
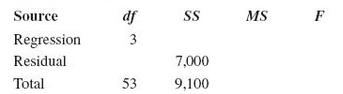
Consider the following ANOVA table for a multiple regression model:a. Complete the remaining entries in the table.b. What is the size of this sample?c. How many independent variables are in this model?d. Calculate the multiple coefficient of determination.e. Test the significance of the overall
Squirt Squad is a cleaning service that sends crews to residential homes on either a once a month or a twice a month schedule, depending on the customer’s preference. The owner would like to predict the amount of time, in minutes, required to clean a house based on the square footage of the
A finance executive would like to determine if a relationship exists between the current earnings per share (EPS) of a bank and the following independent variables:• Total assets ($ billions)• Previous period’s EPS• Previous period’s return on average assets (ROAA)• Previous period’s
Jersey Shore Realtors would like to develop a regression model to help it set weekly rental rates for beach properties during the summer season in New Jersey. The independent variables for this model are the number of bedrooms a property has, its age in years, and the number of blocks away from the
A business statistics professor at State College would like to develop a regression model to predict the final exam scores for students based on their current GPAs, the number of hours they studied for the exam, and the number of times they were absent during the semester. The data for these
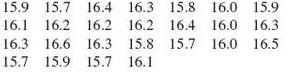
Consider the following set of dependent and independent variables. These data can also be found in the Excel file Prob 152.xlsx.a. Using PHStat, construct a multiple regression model with these data.b. Interpret the meaning of the values for b1 and b2.c. Provide an estimate for y when x1 = 50 and
City Hospital would like to develop a regression model to predict the total hospital bill for a patient based on his or her length of stay, number of days in the hospital’s intensive care unit (ICU), and age of the patient. Data for these variables can be found in the Excel file City
Comcast would like to develop the ability to predict the monthly cable bill for a customer. A multiple regression model was developed using a random sample of customers using the following independent variables: TV: the number of televisions in the household People: the number of people living in
Delmarva Power is a utility company that would like to predict the monthly heating bill for a household in Kent County during the month of January. A random sample of households in the county was selected and their January heating bill recorded along with the following variables: SF: the square
Consider the following set of dependent and independent variables. These data can also be found in the Excel file Prob 151.xlsx.a. Using PHStat, construct a regression model using both independent variables. b. Test the significance of each independent variable using α = 0.05. c. Interpret the p
Consider the following set of dependent and independent variables. These data can also be found in the Excel file Prob 153.xlsx.a. Using PHStat, construct a regression model using both independent variables. b. Test the significance of each independent variable using α = 0.10. c. Interpret the p
Use the data from Problem 15.23 to answer the following questions:From Problema. Construct a 95% confidence interval for the regression coefficient for x1 and interpret its meaning.b. Construct a 95% confidence interval for the regression coefficient for x2 and interpret its meaning.
Showing 23500 - 23600
of 88243
First
229
230
231
232
233
234
235
236
237
238
239
240
241
242
243
Last
Step by Step Answers

.png)

.png)

.png)
.png)


.png)

.png)


.png)


.png)
.png)