New Semester
Started
Get
50% OFF
Study Help!
--h --m --s
Claim Now
Question Answers
Textbooks
Find textbooks, questions and answers
Oops, something went wrong!
Change your search query and then try again
S
Books
FREE
Study Help
Expert Questions
Accounting
General Management
Mathematics
Finance
Organizational Behaviour
Law
Physics
Operating System
Management Leadership
Sociology
Programming
Marketing
Database
Computer Network
Economics
Textbooks Solutions
Accounting
Managerial Accounting
Management Leadership
Cost Accounting
Statistics
Business Law
Corporate Finance
Finance
Economics
Auditing
Tutors
Online Tutors
Find a Tutor
Hire a Tutor
Become a Tutor
AI Tutor
AI Study Planner
NEW
Sell Books
Search
Search
Sign In
Register
study help
mathematics
statistics
Business Statistics 2nd Edition Robert A. Donnelly - Solutions
Use the data from Problem 15.24 to answer the following questions:From Problema. Construct a 90% confidence interval for the regression coefficient for x1 and interpret its meaning.b. Construct a 90% confidence interval for the regression coefficient for x2 and interpret its meaning.
Jersey Shore Realtors would like to develop a regression model to help it set weekly rental rates for beach properties during the summer season in New Jersey. The independent variables for this model are the number of bedrooms a property has, its age, and the number of blocks away from the ocean it
Suppose the athletic director at Villanova University would like to develop a regression model to predict the point differential for games played by the college’s men’s basketball team. A point differential is the difference between the final points scored by two competing teams. A positive
City Hospital would like to develop a regression model to predict the total hospital bill for a patient based on his or her length of stay, number of days in the hospital’s intensive care unit (ICU), and age of the patient. Data for these variables can be found in the Excel file City
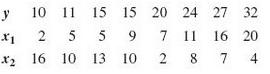
Use the sample data from Problem 15.1 to answer the following questions:From Problema. Construct a 95% confidence interval for the dependent variable when x1 = 7 and x2 = 14.b. Interpret the meaning of the interval constructed in part a.c. Construct a 95% prediction interval for the dependent
A finance executive would like to determine if a relationship exists between the current earnings per share (EPS) of a bank and the following independent variables:• Total assets ($ billions)• Previous period’s EPS• Previous period’s return on average assets (ROAA)• Previous period’s
Squirt Squad is a cleaning service that sends crews to residential homes on either a once a month or a twice a month schedule, depending on the customer’s preference. The owner would like to predict the amount of time, in minutes, required to clean a house based on the square footage of the
Comcast would like to develop the ability to predict the monthly cable bill for a customer. A multiple regression model was developed using a random sample of customers using the following independent variables: TV: the number of televisions in the household People: the number of people living in
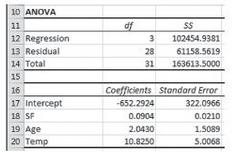
Delmarva Power is a utility company that would like to predict the monthly heating bill for a household in Kent County during the month of January. A random sample of households in the county was selected and their January heating bill recorded along with the following variables: SF: the square
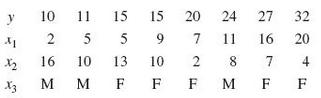
Consider the following set of dependent and independent variables. The variable x3 is qualitative with M = Male and F = Female. The quantitative data for this problem can be found in the Excel file Prob 1534.xlsx.a. Using PHStat, construct a regression model using all three independent variables.b.
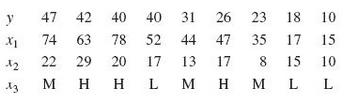
Consider the following set of dependent and independent variables. The variable x3 is qualitative with H = High, M = Medium, and L = Low. The quantitative data for this problem can be found in the Excel file Prob 1535.xlsx.a. Using PHStat, construct a regression model using all three independent
A business statistics professor at State College would like to develop a regression model to predict the final exam scores for students based on their current GPAs, the number of hours they studied for the exam, the number of times they were absent during the semester, and their genders. The data
Squirt Squad is a cleaning service that sends crews to residential homes on either a once a month or a twice a month schedule, depending on the customer’s preference. The owner would like to predict the amount of time required to clean a house based on the square footage of the house, the total
Suppose the athletic director at Villanova University would like to develop a regression model to predict the point differential for games played by the college’s men’s basketball team. A point differential is the difference between the final points scored by two competing teams. A positive
Suppose the Bank of Delaware would like to develop a regression model to predict a person’s credit score based on his or her age, weekly income, education level (high school, bachelor’s degree, graduate degree), and whether he or she owns or rents his or her primary residence. The Excel file
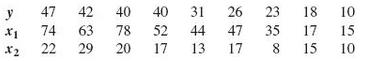
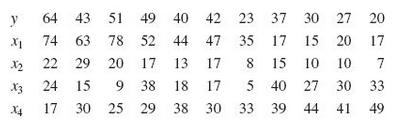
Use the sample data from Problem 15.2 to answer the following questions:From Problema. Construct a 90% confidence interval for the dependent variable when x1 = 30 and x2 = 20. b. Interpret the meaning of the interval constructed in part a. c. Construct a 90% prediction interval for the dependent
Jersey Shore Realtors would like to develop a regression model to help it set weekly rental rates for beach properties during the summer season in New Jersey. The independent variables for this model are the number of bedrooms a property has, its age, the number of blocks away from the ocean it is,
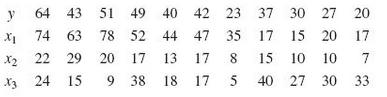
Consider the following set of dependent and independent variables. These data can also be found in the Excel file Prob 1541.xlsx.Using PHStat, check for the presence of multicollinearity. If multicollinearity is present, take the necessary steps to eliminate it.
Consider the following set of dependent and independent variables. These data can also be found in the Excel file Prob 1542.xlsx.Using PHStat, check for the presence of multicollinearity. If multicollinearity is present, take the necessary steps to eliminate it.
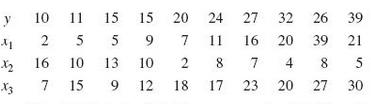
Consider the following set of dependent and independent variables. These data can also be found in the Excel file Prob 1543.xlsx.a. Perform a general stepwise regression using α = 0.05 for the p value to enter and to remove independent variables from the regression model.b. Perform a residual
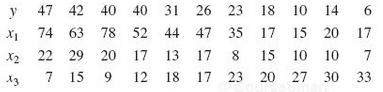
Consider the following set of dependent and independent variables. These data can also be found in the Excel file Prob 1544.xlsx.a. Perform a best subsets regression and choose the most appropriate model for these data.b. Perform a residual analysis to verify that the conditions for the model are
A finance executive would like to determine if a relationship exists between the current earnings per share (EPS) of a bank and the following independent variables:• Total assets ($ billions)• Previous period’s EPS• Previous period’s return on average assets (ROAA)• Previous period’s
A business statistics professor at State College would like to develop a regression model to predict the final exam scores for students based on their current GPAs, the number of hours they studied for the exam, the number of times they were absent during the semester, and their genders. The data
City Hospital would like to develop a regression model to predict the total hospital bill for a patient based on his or her length of stay, number of days in the hospital’s intensive care unit (ICU), and age of the patient. Data for these variables can be found in the Excel file City
Squirt Squad is a cleaning service that sends crews to residential homes on either a once a month or a twice a month schedule, depending on the customer’s preference. The owner would like to predict the amount of time required to clean a house based on the square footage of the house, the total
Suppose the athletic director at Villanova University would like to develop a regression model to predict the point differential for games played by the college’s men’s basketball team. A point differential is the difference between the final points scored by two competing teams. A positive
Jersey Shore Realtors would like to develop a regression model to help it set weekly rental rates for beach properties during the summer season in New Jersey. The independent variables for this model are the number of bedrooms a property has, its age in years, and the number of blocks away from the
Suppose the Bank of Delaware would like to develop a regression model to predict a person’s credit score based on his or her age, weekly income, and education level (high school diploma, bachelor’s degree, graduate degree). The Excel file Bank of Delaware 2. xlsx provides these data for a
Jersey Shore Realtors would like to develop a regression model to help the firm set weekly rental rates for beach properties during the summer season in New Jersey. The independent variables for this model will be the size of the property in square feet, the number of bedrooms and bathrooms it has,
For one of its clients, a marketing research firm would like to predict the weekly food expenditures for households. The independent variables of interest are the number of individuals living in a household, the number of teenagers in it, and the total household income. Data for these variables
Bob is a statistics textbook author and aspiring photographer who sells his 13 * 19 prints on consignment at Island Art in Stone Harbor, New Jersey (stop in if you are in the area and ask for Spencer). To improve his inventory management, Bob would like to develop a model to predict the number of
The owner of Soffritto Italian Grill would like to predict the amount of the tip a server receives from dinner customers. From randomly selected tables, the owner has collected the data shown in the Excel file Sofrittos.xlsx. The data show the tip, the food bill for the table, the number of diners
The general manager of a major league baseball team would like to develop a regression model to predict the number of wins during the season by a starting pitcher. The Excel file MLB pitchers.xlsx provides the following data on a random sample of starting pitchers from a recent season:• Wins•
The provost at a major university would like to develop a model to examine the relationship between the salaries of full time associate professors at the institution and the following independent variables: an associate professor’s performance rating on a scale of 1– 20, his or her gender,
You have just completed your business statistics course and are shopping for a laptop computer at Best Buy. To help you with your decision, you decide to construct a regression model to predict the selling price of the laptop. The Excel file laptops.xlsx provides the following data for a random
Mike Lynch manages a real estate firm in Myrtle Beach, South Carolina, and would like to construct a model to help him predict the selling price of beach properties for his customers. Mike has collected the following data from a random sample of homes that have recently sold: a home’s selling
City Hospital would like to develop a regression model to predict the total hospital bill for a patient based on his or her length of stay, the number of days in the hospital’s intensive care unit (ICU), and the age of the patient. Data for these variables can be found in the Excel file City
A business statistics professor at State College would like to develop a regression model to predict the final exam scores for students based on their current grade point averages (GPAs), the number of hours they studied for the exam, and the number of times they were absent during the semester.
A finance executive would like to determine if a relationship exists between the current earnings per share (EPS) of a bank and the following independent variables:• Total assets ($ billions)• Previous period’s EPS• Previous period’s return on average assets (ROAA)• Previous period’s
Suppose the athletic director at Villanova University would like to develop a regression model to predict the point differential for games played by the college’s men’s basketball team. A point differential is the difference between the final points scored by two competing teams. A positive
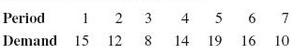
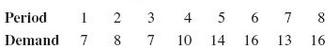
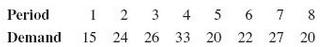
Consider the following time series:a. Forecast the demand for Period 8 using a two- period simple moving average.b. Calculate the MAD for the forecast in part a.c. Forecast the demand for Period 8 using a three- period simple moving average.d. Calculate the MAD for the forecast in part b.e. Which
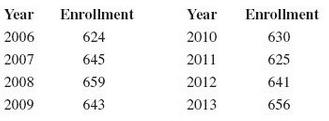
The Independence School is a private grade school that depends on enrollment forecasting to plan for the upcoming school year. The following data show the enrollments for the past several years. These data can also be found in the Excel file Independence School. xlsx.a. Forecast the 2014 enrollment
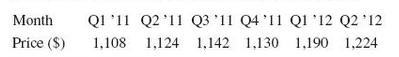
The following data show the average prices for flat panel televisions in the United States over a six quarter period.a. Forecast the average price of a flat panel TV in the third quarter of 2012 using a two period simple moving average.b. Calculate the MAD for the forecast in part a.c. Forecast the
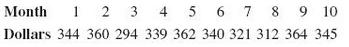
The Park family would like to prepare next month’s family budget by forecasting its family expenses. One item of particular importance is the amount of money spent on food. The following data show the amount of money spent on food for the last 10 months. These data can also be found in the Excel
Consider the following time series:a. Using a trend projection, forecast the demand for Period 9.b. Verify your results using PHStat.c. Calculate the MAD for this forecast.
Consider the following time series:a. Using a trend projection, forecast the demand for Period 9.b. Verify your results with PHStat.c. Calculate the MAD for this forecast.
Consider the following time series:a. Use PHStat and set α = 0.05 to test this time series for positive autocorrelation.b. Verify your Durbin– Watson statistic using Excel.
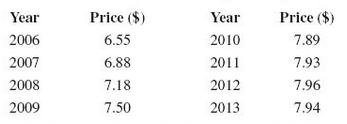
According to the National Association of Theatre Owners, the average U. S. ticket price has been steadily increasing over the past several years. The following data show the average price during an eight year period. These data can also be found in the Excel file average ticket price. xlsx.a.
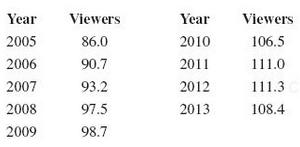
The size of the audience watching the Super Bowl plays a major role in the price the broadcasting network charges for advertising. The following data show the average number of viewers, in millions, who watched previous Super Bowls, according to Nielsen. These data can also be found in the Excel
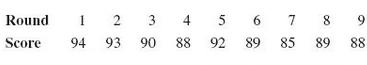
Steve, who has been working hard to improve his golf game, has seen some improvement in his scores over the summer. He would like to use forecasting to set a goal for his next round. The following data show the scores from his last nine rounds of golf at the course he plays most often.a. Construct
Using the time series shown in Problem 16.1, answer the following questions:a. Forecast the demand for Period 8 using a three- period weighted moving average with weights 4, 3, and 1, applying 4 to the most recent data and 1 to the oldest data.b. Calculate the MAD for the forecast in part a.
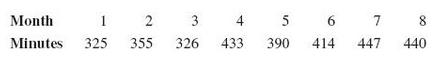
The following table shows the number of cell phone minutes used per month on my family plan for the past eight months. These data can also be found in the Excel file cell phone minutes.xlsx.a. Construct a graph showing the number of minutes used per month on my cell phone account over time.b.
Julie owns 100 shares of Apple stock (lucky her) and is trying to decide how much her portfolio will be worth next month. The data in the Excel file Apple stock price. xlsx show the closing price of a share of Apple stock at the end of each month from October 2011 until May 2013.a. Construct a
Gold has long been a very popular investment choice during times of economic crisis. This has resulted in a significant increase in the price of gold per ounce in recent years. The Excel file gold prices.xlsx shows the average price of an ounce of gold from 1992 until 2012.a. Construct a graph
Recently, fixed mortgage rates have been at historical lows due to the housing slowdown. Data in the Excel file mortgage rates.xlsx show the average 30 year fixed mortgage rate for the month of December every year between 1989 and 2012, as reported by Freddie Mac.a. Construct a graph showing the
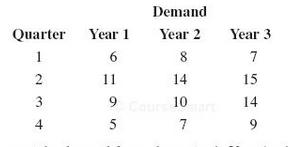
Consider the following time series:a. Forecast the demand for each quarter in Year 4 using multiplicative decomposition.b. Interpret the meaning of the seasonal components.c. Calculate the MAD for this forecast.
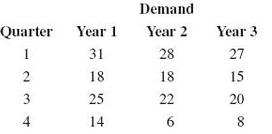
Consider the following time series:a. Forecast the demand for each quarter in Year 4 using multiplicative decomposition.b. Interpret the meaning of the seasonal components.c. Calculate the MAD for this forecast.
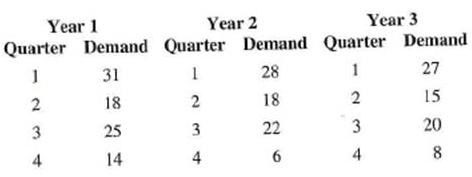
Using the time series shown in Problem 16.24, answer the following questions:a. Forecast the demand for each quarter in Year 4 using seasonal dummy variables and a best subsets regression.b. Interpret the meaning of the coefficients for the seasonal dummy variables.c. Calculate the MAD for this
Using the time series shown in Problem 16.25, answer the following questions:a. Forecast the demand for each quarter in Year 4 using seasonal dummy variables and a best subsets regression.b. Interpret the meaning of the coefficients for the seasonal dummy variables.c. Calculate the MAD for this
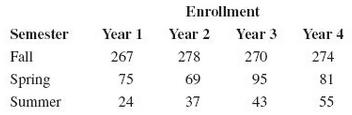
Suppose Bellevue University accepts new students into its program year round on a tri semester schedule (Fall, Spring, and Summer). Forecasting future enrollments helps the school ensure it has the proper resources to accommodate the student body. The following data show the number of students who
Answer the following questions using the data from the Excel file Bellevue.xlsx described in Problem 16.28.From Problema. Forecast the student enrollment for each semester in Year 5 using multiplicative decomposition.b. Interpret the meaning of the seasonal components.c. Calculate the MAD for this
Consider the following time series:a. Forecast the demand for Period 9 using exponential smoothing with α = 0.1.b. Calculate the MAD for the forecast in part a.c. Forecast the demand for Period 9 using exponential smoothing with α = 0.3.d. Calculate the MAD for the forecast in part c.
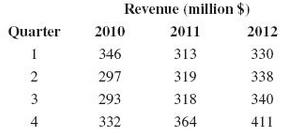
Back in the late 1990s, AOL was the dominant Internet provider. It charged an hourly rate for online access. However, AOL was slow to respond to changes in the Internet business model and lost a significant amount of market share. Today, advertising revenue is a major source of income for the
Answer the following questions using the data from the Excel file AOL. xlsx described in Problem 16.30:From Problema. Forecast the advertising revenue for each quarter in 2013 using seasonal dummy variables and a best subsets regression.b. Interpret the meaning of the coefficients for the seasonal
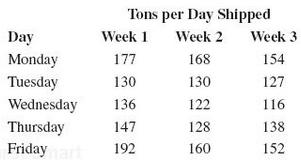
Diamond Shamrock Corporation produces liquid chlorine that it ships to its customers Monday through Friday by truckload and railcar. To improve its scheduling, the company’s plant manager would like to develop a forecasting model to predict the tons of chlorine shipped each day for the following
Answer the following questions using the data from the Excel file chlorine. xlsx described in Problem 16.32.From Exercisea. Forecast the tons of chlorine shipped each day next week using multiplicative decomposition.b. Interpret the meaning of the seasonal components.c. Calculate the MAD for this
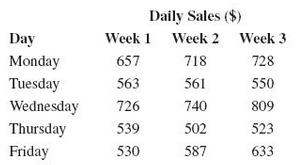
The food service at Goldey Beacom College provides lunch and dinner for the students Monday through Friday. The food service manager would like to forecast the sales for each day of the following week to ensure she has enough employees staffing the counter. The following data show the daily sales,
Answer the following questions using the data from the Excel file cafeteria. xlsx described in Problem 16.34.From Exercisea. Forecast the food service€™s sales for each day next week using seasonal dummy variables and a best subsets regression. b. Interpret the meaning of the coefficients for
Deloitte is a firm that conducts an annual survey that gauges consumer spending expectations during the year end holiday season. The following data show the percentage of respondents who indicated that they would spend less this year on holiday gifts when compared to the previous year. These data
Answer the following questions using the data from the Excel file Deloitte. xlsx from Problem 16.36.From Problema. Using exponential smoothing with α = 0.6, forecast the percentage of holiday shoppers who intend to spend less in 2013. b. Calculate the MAD for the forecast in part a. c. Using
Dave is a manager of a local AT& T Wireless retail store. He would like to forecast the number of customers walking into his retail store per day to improve his staffing decisions. The following data show the number of customers who entered Dave€™s store during the last eight days. These
Answer the following questions using the data from the Excel file daily customers. xlsx described in Problem 16.38:a. Forecast the number of customers who will visit Dave€™s store on Day 9 using a two period weighted moving average with the weights 5 and 2. b. Calculate the MAD for the forecast
Using the time series shown in Problem 16.3, answer the following questions:From Problema. Forecast the demand for Period 9 using exponential smoothing with trend adjustment and setting α = 0.4 and β = 0.7. b. Calculate the MAD for the forecast in part a.
Grade inflation, which is defined as an increase in the average GPA of an institution over time without a corresponding increase in academic performance, is a concern for many colleges. The presence of grade inflation could be an indication of lowered academic standards over time. Suppose the
Newark College would like to include seasonality in its GPA forecasting model. The average GPA of the study body for each year was broken down into the average GPA by semester (Fall, Spring, Summer) and can be found in the Excel file grade inflation by semester. xlsx.a. Using multiplicative
Answer the following questions using the data from the Excel file grade inflation by semester. xlsx described in Problem 16.41: a. Forecast the average GPA for each semester during 2014 using a multiple regression with seasonal dummy variables. b. Interpret the meaning of the coefficients for the
Cash bonuses paid to financial investment employees were reduced during the 2007 economic recession and have shown signs of rebounding with the recent recovery. The following data show the average cash bonus, in thousands of dollars, for New York City investment employees over an eight year period.
Answer the following questions using the data from the Excel file average bonus. xlsx from Problem 16.43.From Problema. Using exponential smoothing with α = 0.5, forecast the average cash bonus for a financial investment employee in New York City in 2013. b. Calculate the MAD for the
Spain€™s economy has struggled with very high unemployment rates as a result of the Eurozone banking crisis. The following data show the annual unemployment rate over a nine year period. These data can also be found in the Excel file Spain unemployment. xlsx.a. Using a three period
Answer the following questions using the data from the Excel file Spain unemployment. xlsx from Problem 16.45.From Problema. Construct a graph showing the annual unemployment rate for Spain over time. b. Forecast the unemployment rate for Spain in 2013 using a trend projection. c. Calculate the
The Great Smoky Mountain National Park on the border of Tennessee and North Carolina is America’s most popular national park with more than nine million visitors each year. Suppose the National Park Service would like to forecast the number of visitors to this park in 2013. The Excel file Great
Answer the following questions using the data from the Excel file Great Smoky Mountain. xlsx from Problem 16.47. a. Using a four period simple moving average, forecast the number of visitors each year visiting the Great Smoky Mountain National Park in 2013. b. Calculate the MAD for the forecast
Toys Unlimited is an online toy store with a product line that focuses on the preschool children market. Management would like to develop a model to forecast sales, in millions of dollars, for the next four quarters. The Excel file Toys Unlimited.xlsx provides sales for each quarter for the
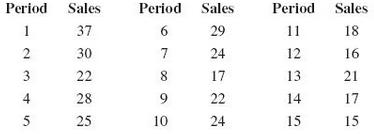
Bob is a photographer who sells his 13 × 19 prints on consignment at Island Art in Stone Harbor, New Jersey. Each week during the summer, Bob checks the inventory so that he can replenish the prints that have been sold. The following data show the number of prints sold each week during
Answer the following questions using the data from the Excel file Toys Unlimited. xlsx from Problem 16.49. a. Forecast Toys Unlimited sales for each quarter next year using a multiple regression with seasonal dummy variables. b. Interpret the meaning of the coefficients for the seasonal dummy
The U. S. stock market experienced an economic recovery during 2011 and 2012 after a major recession. The data in the Excel file S& P 500.xlsx show the end of month values for the S& P 500 Index during these two years. a. Construct a graph showing the S& P Index over time. b. Forecast the S& P
Answer the following questions using the data from the Excel file S& P 500. xlsx described in Problem 16.51: a. Forecast the S& P Index for the end of January 2013 using a trend projection. b. Check the forecasting model in part a for the presence of autocorrelation using α = 0.05. c. Comment
During the fiscal year 2012, the U. S. Postal Service experienced a record $ 15.9 billion in losses. In an effort to respond to this financial crisis, the postal service is considering closing many post office facilities that are operating at a loss. To help with this decision, suppose post office
There is recent speculation that the Super Bowl games, which determine the NFL champion, are becoming more competitive over time. The competitiveness of the game draws much attention from the gambling industry, which is affected by the winning margin, or point spread, othe outcome. To investigate
The Consumer Price Index (CPI), which is published by the U. S. Bureau of Labor Statistics, is a measurement that reflects changes in consumer prices over time. The following data show the CPI over a 10- year period using 1982 as the base year with the CPI = 100. These data can also be found in the
The IRS is actively encouraging individuals to file their taxes electronically in order to increase accuracy and reduce expenses. The following data show the percentage of tax re-turns filed electronically from 2003 to 2012. These data can also be found in the Excel file electronic filing.xlsx.a.
The number of viewers for network television shows has a direct effect on the amount of advertising dollars that will be generated. The following data show the number of viewers, in millions, for the final performance of the following seasons of American Idol. These data can also be found in the
General Motors (GM) is one of the world€™s largest car and truck manufacturer and employs over 200,000 employees worldwide. In 1970, GM had captured nearly 60% of the U. S. market share. However, due to increased global competition over the past 40 years, GM€™s market share has
Calculate the payoffs for the following decision table using the order sizes and demand levels shown. The selling price per unit is $ 40, and the variable cost per unit is $ 25. Assume there is no leftover value for unsold units.
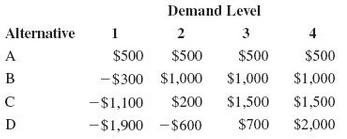
Consider the following payoff table:Choose the best alternative using the following criterion: a. Maximax b. Maximin c. Equally likely d. Minimax regrete. Hurwicz using α = 0.4
Consider the following payoff table:Choose the best alternative using the following criterion:a. Maximaxb. Maximinc. Equally likelyd. Minimax regrete. Hurwicz using α = 0.7
Women€™s Sports Specialty sells a variety of fitness apparel for women and needs to place an order of Speedo swimsuits for the upcoming summer season. The order volumes being considered are large and small, and the demand levels for the swim season for this particular brand can be strong,
G& R Publishing is publishing a new cookbook, which they feel will set it apart from the current competition. The publisher needs to select one version of the cookbook from the following list of alternatives: Version 1: This book will be approximately 500 pages in length, printed in four colors,
Decision tables are not just based on profits or losses. Suppose you are planning your wedding day and you are trying to decide whether to have your reception indoors, outdoors, or outdoors under a tent. The weather that day can either be sunny, cloudy, or rainy. The following decision table
Each week, Jim places an order for bananas to be delivered at Zingos grocery store at a cost of $ 0.30 per pound. Zingos sell these bananas for $ 0.70 per pound. Any unsold bananas at the end of the week are donated to a local charity. Jim needs to decide between ordering 200, 500, or 800 pounds of
Showing 23600 - 23700
of 88243
First
230
231
232
233
234
235
236
237
238
239
240
241
242
243
244
Last
Step by Step Answers
.png)
.png)


.png)
.png)
.png)
.png)
.png)
.png)
.png)
.png)
.png)
.png)
.png)
.png)
.png)
.png)
.png)
.png)
.png)
.png)
.png)

