New Semester
Started
Get
50% OFF
Study Help!
--h --m --s
Claim Now
Question Answers
Textbooks
Find textbooks, questions and answers
Oops, something went wrong!
Change your search query and then try again
S
Books
FREE
Study Help
Expert Questions
Accounting
General Management
Mathematics
Finance
Organizational Behaviour
Law
Physics
Operating System
Management Leadership
Sociology
Programming
Marketing
Database
Computer Network
Economics
Textbooks Solutions
Accounting
Managerial Accounting
Management Leadership
Cost Accounting
Statistics
Business Law
Corporate Finance
Finance
Economics
Auditing
Tutors
Online Tutors
Find a Tutor
Hire a Tutor
Become a Tutor
AI Tutor
AI Study Planner
NEW
Sell Books
Search
Search
Sign In
Register
study help
mathematics
statistics
Managing Controlling and Improving Quality 1st edition Douglas C. Montgomery, Cheryl L. Jennings, Michele E. Pfund - Solutions
What are chance and assignable causes of variability? What part do they play in the operation and interpretation of a Shewhart control chart?
A car has gone out of control during a snowstorm and strikes a tree. Construct a cause-and-effect diagram that identifies and outlines the possible causes of the accident.
Laboratory glassware shipped from the manufacturer to your plant via an overnight package service has arrived damaged. Develop a cause-and-effect diagram that identifies and outlines the possible cause of this event.
Construct a cause-and-effect diagram that identifies the possible causes of consistently bad coffee from a large-capacity office coffee pot.
Develop a flow chart for the process that you follow every morning from the time you awake until you arrive at your workplace (or school). Identify the value-added and non-value-added activities.
Develop a flow chart for the pre-registration process at your university. Identify the value-added and non-value-added activities.
Discuss the relationship between a control chart and statistical hypothesis testing.
What is meant by the statement that a process is in a state of statistical control?
If a process is in a state of statistical control, does it necessarily follow that all or nearly all of the units of product produced will be within the specification limits?
Discuss the logic underlying the use of three-sigma limits on Shewhart control charts. How will the chart respond if narrower limits are chosen? How will it respond if wider limits are chosen?
Consider the control chart shown here. Does the pattern appear random?
Consider the control charts shown here. Does the pattern appear random?
Consider the control charts shown here. Does the pattern appear random?
You consistently arrive at your office about one-half hour later than you would like. Develop a cause-and-effect diagram that identifies and outlines the possible causes of this event.
The fill amount of liquid detergent bottles is being analyzed. Twelve bottles, randomly selected from the process, are measured, and the results are as follows (in fluid ounces): 16.05, 16.03, 16.02, 16.04, 16.05, 16.01, 16.02, 16.02, 16.03, 16.01, 16.00, 16.07.a. Calculate the sample average.b.
Construct a normal probability plot of the failure time data in Exercise 4.6. Does the assumption that failure time for this component is well modeled by a normal distribution seem reasonable?
Construct a normal probability plot of the Viscosity data in Exercise 4.7. Does the assumption that process yield is well modeled by a normal distribution seem reasonable?
Consider the yield data in Table 4E.3. Construct a time-series plot for these data. Interpret the plot.
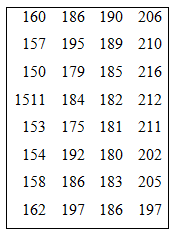
Consider the chemical process yield data in Exercise 4.12. Calculate the sample average and standard deviation.a. Calculate the sample average.b. Calculate the sample standard deviation.
Consider the chemical process yield data in Exercise 4.12. Construct a stem-and-leaf plot and a histogram. Which display provides more information about the process?In exercise
Construct a box plot for the data in Exercise 4.1.
Construct a box plot of the data in Exercise 4.2.
Suppose that two fair dice are tossed and the sum of the dice is observed. Determine the probability distribution of x, the sum of the dice.
Find the mean and standard deviation of χ in Exercise 4.17.x p(x)2 ……………….. 1/363 ………………..
The tensile strength of a metal part is normally distributed with mean 40 lb and standard deviation 5 lb. If 50,000 parts are produced, how many would you expect to fail to meet a minimum specification limit of 35 lb tensile strength? How many would have a tensile strength in excess of 48 lb?
Monthly sales for tissues in the northwest region are (in thousands) 50.001, 50.002, 49.998, 50.006, 50.005, 49.996, 50.003, 50.004. a. Calculate the sample average.b. Calculate the sample standard deviation.
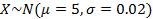
The output voltage of a power supply is normally distributed with mean 5 V and standard deviation 0.02 V. If the lower and upper specifications for voltage are 4.95 V and 5.05 V, respectively, what is the probability that a power supply selected at random will conform to the specifications on
Continuation of Exercise 4.20. Reconsider the power supply manufacturing process in Exercise 4.20. Suppose we wanted to improve the process. Can shifting the mean reduce the number of nonconforming units produced? How much would the process variability need to be reduced in order to have all but
The life of an automotive battery is normally distributed with mean 900 days and standard deviation 35 days. What fraction of these batteries would be expected to survive beyond 1,000 days?
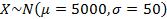
A light bulb has a normally distributed light output with mean 5,000 end foot-candles and standard deviation of 50 end foot-candles. Find a lower specification limit such that only 0.5% of the bulbs will not exceed this limit.
The specifications on an electronic component in a target-acquisition system are that its life must be between 5,000 and 10,000 h. The life is normally distributed with mean 7,500 h. The manufacturer realized a price of $10 per unit produced; however, defective units must be replaced at a cost of
The tensile strength of fiber used in manufacturing cloth is of interest to the purchaser. Previous experience indicates that the standard deviation of tensile strength is 2 psi. A random sample of eight fiber specimens is selected, and the average tensile strength is found to be 127
Payment times of 100 randomly selected customers this month had an average of 35 days. The standard deviation from this group was 2 days.a. Build a 90% two-sided confidence interval on the mean payment time.b. Build a 99% two-sided confidence interval on the mean payment time.c. Is it possible that
The service life of a battery used in a cardiac pacemaker is assumed to be normally distributed. A random sample of 10 batteries is subjected to an accelerated life test by running the, continuously at an elevated temperature until failure, and the following lifetimes (in hours) are obtained:
A local neighborhood has just installed speed bumps to slow traffic. Two weeks after the installation the city recorded the following speeds 500 feet after the last speed bump: 29, 29, 31, 42, 30, 24, 30, 27, 33, 44, 32, 30, 24, 35, 34, 30, 23, 35, 27.a. Find a 99% one-sided confidence interval on
A company has just purchased a new billboard near the freeway. Sales for the past 10 days have been 483, 532, 444, 510, 467, 461, 450, 444, 540, and 499. Build a 95% two-sided confidence interval on sales. Is there any evidence that the billboard has increased sales from its previous
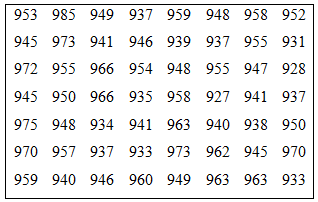
Waiting times for customers in an airline reservation system are (in seconds) 953,955, 948, 951,957,949, 954, 950, 959.a. Calculate the sample average.b. Calculate the sample standard deviation.
A machine is used to fill container with a liquid product. Fill volume can be assumed to be normally distributed. A random sample of 10 containers is selected, and the net contents (oz.) are as follows: 12.03, 12.01, 12.04, 12.02, 12.05, 11.98, 11.96, 12.02, 12.05, and 11.99. Suppose that the
A company is evaluating the quality of aluminum rods received in a recent shipment. Diameters of aluminum alloy rods produced on an extrusion machine are known to have a standard deviation of 0.0001 in. A random sample of 25 rods has an average diameter of 0.5046 in. Test whether or not the mean
The output voltage of a power supply is assumed to be normally distributed. Sixteen observations taken at random on voltage are as follows: 10.35, 9.30, 10.00, 9.96, 11.65, 12.00, 11.25, 9.58, 11.54, 9.95, 10.28, 8.37, 10.44, 9.25, 9.38, and 10.85.a. Test the hypothesis that the mean voltage equals
Last month, a large national bank€™s average payment time was 33 days with a standard deviation of 4 days. This month, the average payment time was 33.5 days with a standard deviation of 4 days. They had 1,000 customers both months.Build a 95% confidence interval on the difference between
Two machines are used for filling glass bottles with a soft-drink beverage. The filling processes have known standard deviations liter and liter, respectively. A random sample of bottles from machine 1 and bottles from machine 2 results in average net contents of 2.04 liters and 2.07 liters from
A supplier received results on the hardness of metal from two different hardening process (1) salt-water quenching and (2) oil quenching. The results are shown in Table 4E.4.a. Construct a 95% confidence interval on the difference in mean hardness.b. Construct a 95% confidence interval on the
A random sample of 200 printed circuit boards contains 18 defective or nonconforming units. Estimate the process fraction nonconforming. Using a 90% two-sided confidence interval, evaluate whether or not it is possible that the true fraction nonconforming in this process is 10%.
A random sample of 500 connecting rod pins contains 65 nonconforming units. Estimate the process fraction nonconforming. Construct a 90% upper confidence interval on the true process fraction nonconforming. Is it possible that the true fraction nonconforming defective is 10%?
During shipment testing, product was flown from Indianapolis to Seattle and back again to simulate 4 takeoffs and landings which can cause cans to open due to pressure changes. Prototype units of the 100 were shipped and 15 opened. Using a 90% two-sided confidence interval, determine if it is
Continuation of Exercise 4.38. The company has made improvements and has repeated the experiment. In this iteration, 12 opened. Using a 95% two-sided confidence interval on the difference in proportions, is it possible to cite improvement?In exercise During shipment testing, product was flown from
Consider the waiting time data in Exercise 4.3.Data: 953, 955, 948, 951, 957, 949, 954, 950, 959a. Find the sample median of these data.b. How much could the largest time increase without changing the sample median?
Of 1,000 customers, 200 had payments greater than 30 days last month. This month, there are 1,100 customers, of which 230 had payments greater than 30 days. a. Estimate the fraction late for last month and this month. b. Construct a 90% confidence interval on the difference in the percentage of
A new purification unit is installed in a chemical process. Before and after installation data was collected regarding the percentage of impurity:Before (1): Sample mean = 9.85, Sample variance = 6.79, Number of samples = 10After (2): Sample mean = 8.08, Sample variance = 6.18, Number of samples =
Two different types of glass bottles are suitable for use by a soft-drink beverage bottler. The internal pressure strength (psi) of the bottle is an important quality characteristic. It is known that 3.0 psi. From a random sample of bottles, the mean pressure strengths are observed to be psi
The diameter of a metal rod is measured by 12 inspectors, each using both a micrometer caliper and a vernier caliper. The results are shown in Table 4E.5. Is there a difference between the mean measurements produced by the two types of caliper? Use alpha = 0.01.
An experiment was conducted to investigate the filling capability of packaging equipment at a winery in Newberg, Oregon. Twenty bottles of Pinot Gris were randomly selected and the fill volume (in mL) measured. Assume that fill volume has a normal distribution. The data are as follows: 753, 751,
Rehab, Inc. is evaluating patient success results for its Northbrook and Southbrook locations. Each successfully treated 10 patients within the last year following elbow surgery. Total recovery times and % range of motion achieved are listed in Table 4E.6.a. Build a 95% two-sided confidence
An article in Solid State Technology (May 1987) describes an experiment to determine the effect of flow rate on etch uniformity on a silicon wafer used in integrated-circuit manufacturing. Three flow rates are tested, and the resulting uniformity (in percent) is observed for six test units at each
An article in the ACI Materials Journal (Vol. 84, 1987, pp. 213-216) describes several experiments investigating the rodding of concrete to remove entrapped air. A 3-in diameter cylinder was used, and the number of times this rod was used is the design variable. The resulting compressive strength
An article in environment International (Vol. 18, No.4, 1992) describes an experiment in which the amount of radon released in showers was investigated. Radon-enriched water was used in the experiment, and six different orifice diameters were tested in shower heads. The data from the experiment are
The time to complete an order (in seconds) is as follows: 96, 102, 104, 108, 126, 128, 150, and 156.a. Calculate the sample average.b. Calculate the sample standard deviation.
The time to failure in hours of an electronic component subjected to an accelerated life test is shown in Table 4E.1. To accelerate the failure test, the units were tested at an elevated temperature (read down, then across).a. Calculate the sample average and standard deviation.b. Construct a
An article in Quality Engineering (Vol.4, 1992, pp. 487-495) presents viscosity data from a batch chemical process. A sample of these data is presented in Table 4E.2. (read down, then across).a. Construct a stem-and-leaf plot for the viscosity data.b. Construct a frequency distribution and
Construct and interpret a normal probability plot of the volumes in Exercise 4.1.
Construct and interpret a normal probability plot of the waiting time measurements in Exercise 4.3.
What are chance and assignable causes of variability? What part do they play in the operation and interpretation of a Shewhart control chart? Discuss.
A manufacturing process produces 500 parts per hour. A sample part is selected about every half-hour, and after five parts are obtained, the average of these five measurements is plotted on a control chart. (a) Is this an appropriate sampling scheme if the assignable cause in the process results
If the time order of production has not been recorded in a set of data from a process, is it possible to detect the presence of assignable causes?
How do the costs of sampling, the costs of producing an excessive number of defective units, and the costs of searching for assignable causes impact the choice of parameters of a control chart?
Consider the control chart shown here. Does the pattern appear random?
Consider the control chart shown here. Does the pattern appear random?
Consider the control chart shown here. Does the pattern appear random?
Apply the Western Electric rules to the control chart in Exercise 5.14. Are any of the criteria for declaring the process out of control satisfied?
Apply the Western Electric rules to the control chart presented in Exercise 5.16. Would these rules result in any out-of-control signals?
Consider the time-varying process behavior shown below. Match each of these several patterns of process performance to the corresponding and R charts shown in Figures (a) to (e) below.
Discuss the relationship between a control chart and statistical hypothesis testing. Discuss.
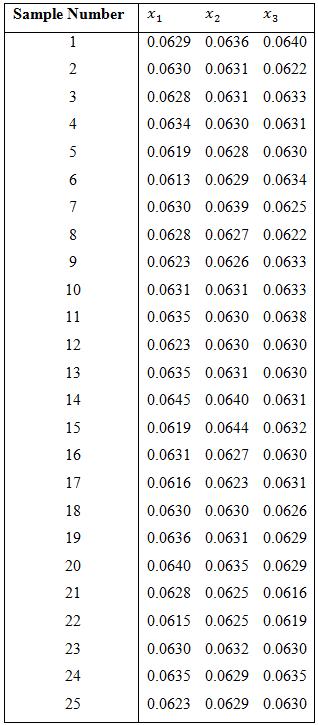
The thickness of a printed circuit board is an important quality parameter. Data on board thickness (in inches) are given in Table 5E.1 for 25 samples of three boards each.a. Set up x̅ and R control charts. Is the process in statistical control?b. Estimate the process standard deviation.c. What
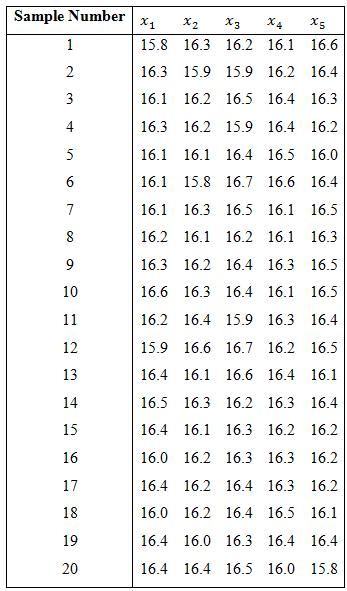
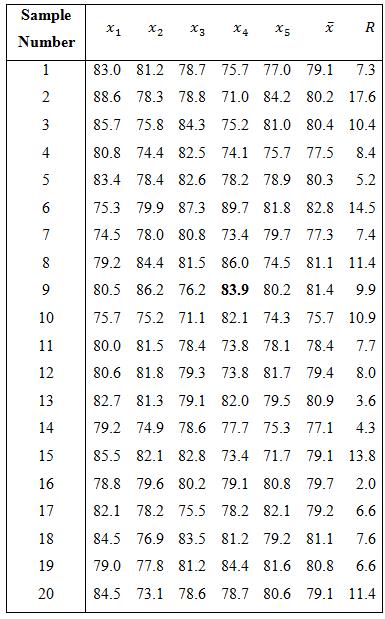
The net weight of a soft drink is to be monitored by and R control charts using a sample size of n = 5. Data for 20 preliminary samples are shown in Table 5E.2. a. Set up and R control charts using these data. Does the process exhibit statistical control?b. Estimate the
Rework Exercise 5.20 using an X̅-S chart.a. Set up X̅ and S control charts. Is the process in statistical control?b. Estimate the process standard deviation.c. What are the limits that you would expect to contain nearly all the process measurements?
Rework Exercise 5.21 using an X̅-S chart.a. Set up X̅-S control charts using these data. Does the process exhibit statistical control?b. Estimate the process mean and standard deviation.c. Does fill weight seem to follow a normal distribution?
Samples of six items are taken from a service process at regular intervals. A quality characteristic is measured and x̅ and R values are calculated from each sample. After 50 groups of size 6 have been taken we have x̅ = 40 and R̅ = 4. The data is normally distributed.a. Compute control limits
Table 5E.3 presents 20 subgroups of five measurements on the time it takes to service a customer.a. Set up and R control charts for this process and verify that it is in statistical control.b. Following establishing of the control charts in part (a), 10 new samples have been provided in
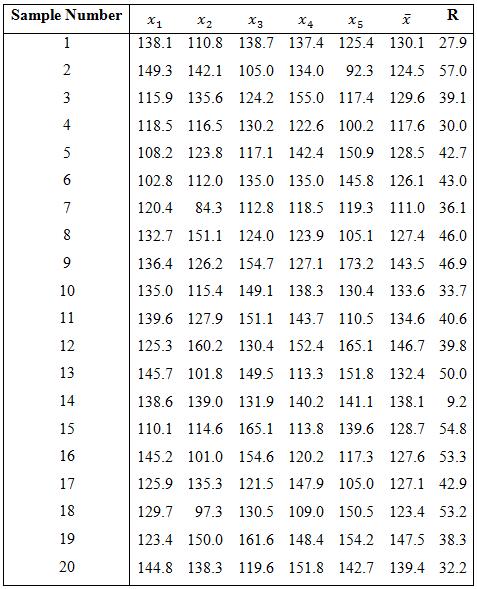
Parts manufactured by an injection modeling process are subjected to a compressive strength test. Twenty samples of five parts each are collected, and the compressive strengths (in psi) are shown in Table 5E.6.a. Establish x̅ and R control charts for compressive strength using these data. Is the
Reconsider the data presented in Exercise 5.26.a. Establish x̅ and S control charts for compressive strength using these data. Is the process in statistical control? After establishing the control charts, 15 new subgroups were collected; the compressive strengths are shown in Table 5E.7.
One-pound coffee cans are filled by a machine, sealed, and then weighed by a local coffee store. After adjusting for the weight of the can, any package that weighs less than 16 oz is cut out of the conveyor. The weights of 25 successive cans are shown in Table 5E.8. Set up a moving range control
Fifteen successive heats of a steel alloy are tested for hardness. The resulting data are shown in Table 5E.9. Set up a control chart for the moving range and a control chart for individual hardness measurements. Is it reasonable to assume that hardness is normally distributed?
Discuss type I and type II errors relative to the control chart. What practical implication in terms of process operation do these two types of errors have?
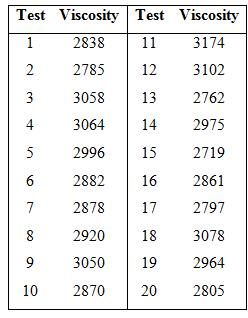
The viscosity of a polymer is measured hourly. Measurements for the last 20 hours are shown as follows:a. Does viscosity follow a normal distribution?b. Set up a control chart on viscosity and a moving range chart. Does the process exhibit statistical control?c. Estimate the process mean and
Continuation of exercise 5.20. The next five measurements on viscosity are 3163, 3199, 3054, 3147, and 3156. Do these measurements indicate that the process is in statistical control?
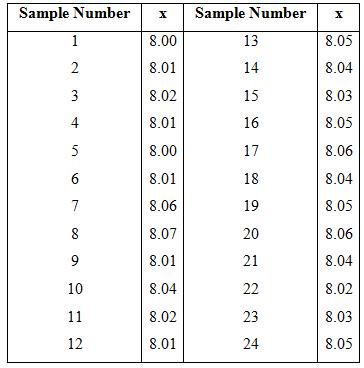
A machine is used to fill cans with an energy drink. A single sample can is selected every hour and the weight of the can is obtained. Since the filling process is automated, it has very stable variability, and long-term experience indicates that σ = 0.05 oz. the individual observations for
Rework Exercise 5.30 using the standardized CUSUM parameters of h = 8.01 and k = 0.25. Compare the results with those obtained previously in Exercise 5.32. What can you say about the theoretical performance of those two CUSUM schemes?In exercise
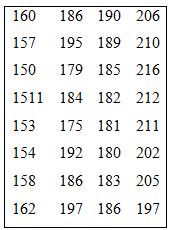
The data in Table 5E.12 are the times it takes for a local payroll company to process checks (in minutes). The target value for the turnaround times is minutes (two working days).a. Estimate the process standard deviation.b. Create a CUSUM chart for this process, using standardized
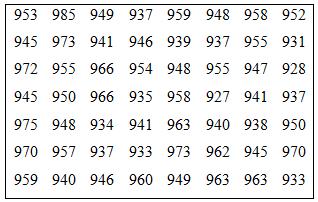
Calcium hardness is measured hourly for a public swimming pool. Data (in ppm) for the last 32 hours are shown in Table 5E.13 (read down from left). The process target is = 175 ppm.a. Estimate the process standard deviation.b. Construct a CUSUM chart for this process using standardized values
Reconsider the data in Exercise 5.32. Set up an EWMA control chart with and for this process. Interpret the results.In exercise
Reconstruct the control chart in Exercise 5.36 using λ = 0.1 and L = 3 for this process. Interpret the results. σ = 0.05, μ0 = 8.02, λ = 0.1 L = 3 In exercise
Reconsider the data in Exercise 5.34. Apply an EWMA control chart to these data using λ = 0.1 and L = 2.7..In exercise
Reconstruct the control chart in Exercise 5.34 using λ = 0.4 and L = 3. Compare this chart to the one constructed in Exercise 5.38.In
What is meant by the statement that a process is in a state of statistical control? Discuss.
Reconsider the data in Exercise 5.35. Set up and apply an EWMA control chart to these data using and .In exerciseCalcium hardness is measured hourly for a public swimming pool. Data (in ppm) for the last 32 hours are shown in Table 5E.13 (read down
A process is in control withand . The process specifications are at. The quality characteristic has a normal distribution.a. Estimate the potential capability.b. Estimate the actual capability.c. How much could the fallout in the process be reduced if the process were corrected to operate
a. Estimate the potential capability of the process.b. Estimate the actual process capability.c. How much improvement could be made in process performance if the mean could be centered at the nominal value?
A process is in statistical control with and . The control chart uses a sample size of . Specifications are at . The quality characteristic is normally distributed.a. Estimate the potential capability of the process.b. Estimate the actual process
a. Estimate the potential capability.b. Estimate the actual capability.c. How much could process fallout be reduced by shifting the mean to the nominal dimension? Assume that the quality characteristic is normally distributed.
Showing 34300 - 34400
of 88243
First
337
338
339
340
341
342
343
344
345
346
347
348
349
350
351
Last
Step by Step Answers
.png)
.png)
.png)
.png)
.png)
.png)
.png)
.png)


.png)
.png)


.png)

.png)
.png)
.png)
.png)
.png)
.png)
.png)
.png)
.png)
.png)
.png)