New Semester
Started
Get
50% OFF
Study Help!
--h --m --s
Claim Now
Question Answers
Textbooks
Find textbooks, questions and answers
Oops, something went wrong!
Change your search query and then try again
S
Books
FREE
Study Help
Expert Questions
Accounting
General Management
Mathematics
Finance
Organizational Behaviour
Law
Physics
Operating System
Management Leadership
Sociology
Programming
Marketing
Database
Computer Network
Economics
Textbooks Solutions
Accounting
Managerial Accounting
Management Leadership
Cost Accounting
Statistics
Business Law
Corporate Finance
Finance
Economics
Auditing
Tutors
Online Tutors
Find a Tutor
Hire a Tutor
Become a Tutor
AI Tutor
AI Study Planner
NEW
Sell Books
Search
Search
Sign In
Register
study help
mathematics
statistics
Business Statistics for Contemporary Decision Making 6th Edition Ken Black - Solutions
What follows is Excel output from a regression model to predict y using x1, x2, x21, x22, and the interaction term, x1 x2. Comment on the overall strength of the model and the significance of each predictor. The data follow the Excel output. Develop a regression model with the same independent
Analyze the following data by using a multiple regression computer software package to predict y using x1 and x2. Notice that x2 is a dummy variable. Discuss the output from the regression analysis; in particular, comment on the predictability of the dummyvariable.
Given here are the data from a dependent variable and two independent variables. The second independent variable is an indicator variable with several categories. Hence, this variable is represented by x2, x3, and x4. How many categories are needed in total for this independent variable? Use a
The Minitab output displayed here is the result of a multiple regression analysis with three independent variables. Variable x1 is a dummy variable.Discuss the computer output and the role x1 plays in this regressionmodel.
Given here is Excel output for a multiple regression model that was developed to predict y from two independent variables, x1 and x2. Variable x2 is a dummy variable. Discuss the strength of the multiple regression model on the basis of the output. Focus on the contribution of the dummy variable.
A researcher gathered 155 observations on four variables: job satisfaction, occupation, industry, and marital status. She wants to develop a multiple regression model to predict job satisfaction by the other three variables. All three predictor variables are qualitative variables with the following
Use a stepwise regression procedure and the following data to develop a multiple regression model to predict y. Discuss the variables that enter at each step, commenting on their t values and on the value ofR2.
Given here are data for a dependent variable and four potential predictors. Use these data and a stepwise regression procedure to develop a multiple regression model to predict y. Examine the values of t and R2 at each step and comment on those values. How many steps did the procedure use?Why do
The computer output given here is the result of a stepwise multiple regression analysis to predict a dependent variable by using six predictor variables. The number of observations was 108. Study the output and discuss the results. How many predictors ended up in the model?Which predictors, if any,
Study the output given here from a stepwise multiple regression analysis to predict y from four variables.Comment on the output at eachstep.
The National Underwriter Company in Cincinnati, Ohio, publishes property and casualty insurance data. Given here is a portion of the data published. These data include information from the U.S. insurance industry about (1) net income after taxes, (2) dividends to policyholders, (3) net underwriting
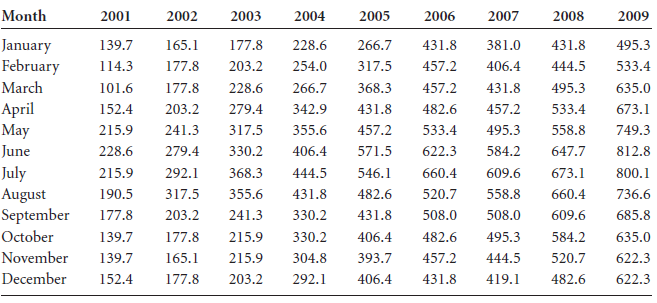
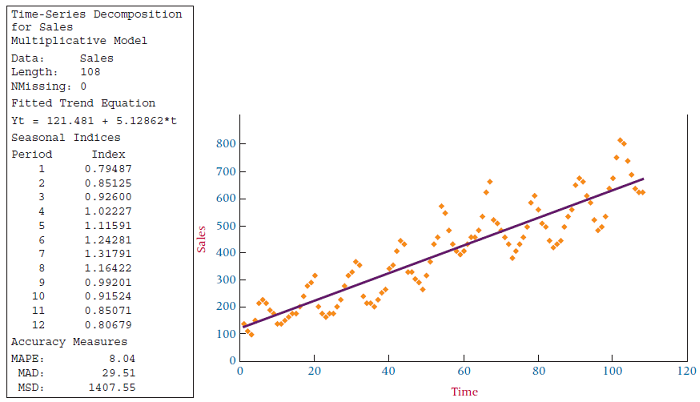
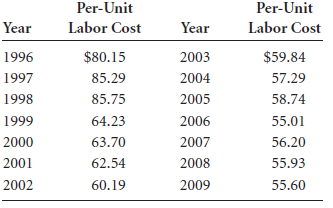
The U.S. Energy Information Administration releases figures in their publication, Monthly Energy Review, about the cost of various fuels and electricity. Shown here are the figures for four different items over a 12-year period. Use the data and stepwise regression to predict the cost of
Develop a correlation matrix for the independent variables in Problem 14.13. Study the matrix and make a judgment as to whether substantial multicollinearity is present among the predictors. Why or why not?
Construct a correlation matrix for the four independent variables for Problem 14.14 and search for possible multicollinearity. What did you find and why?
In Problem 14.17, you were asked to use stepwise regression to predict premiums earned by net income, dividends, and underwriting gain or loss. Study the stepwise results, including the regression coefficients, to determine whether there may be a problem with multicollinearity. Construct a
Study the three predictor variables in Problem 14.18 and attempt to determine whether substantial multicollinearity is present between the predictor variables. If there is a problem of multicollinearity, how might it affect the outcome of the multiple regression analysis?
Given here are the data for a dependent variable, y, and independent variables. Use these data to develop a regression model to predict y. Discuss the output. Which variable is an indicator variable?Was it a significant predictor ofy?
Use the following data and a stepwise regression analysis to predict y. In addition to the two independent variables given here, include three other predictors in your analysis: the square of each x as a predictor and an interaction predictor.Discuss the results of theprocess.
Use the x1 values and the log of the x1 values given here to predict the y values by using a stepwise regression procedure. Discuss the output.Were either or both of the predictorssignificant?
The U.S. Commodities Futures Trading Commission reports on the volume of trading in the U.S. commodity futures exchanges. Shown here are the figures for grain, oilseeds, and livestock products over a period of several years. Use these data to develop a multiple regression model to predict grain
The U.S. Bureau of Mines produces data on the price of minerals. Shown here are the average prices per year for several minerals over a decade. Use these data and a stepwise regression procedure to produce a model to predict the average price of gold from the other variables.Comment on the results
The Shipbuilders Council of America in Washington, D.C., publishes data about private shipyards. Among the variables reported by this organization are the employment figures (per 1000), the number of naval vessels under construction, and the number of repairs or conversions done to commercial ships
The U.S. Bureau of Labor Statistics produces consumer price indexes for several different categories. Shown here are the percentage changes in consumer price indexes over a period of 20 years for food, shelter, apparel, and fuel oil. Also displayed are the percentage changes in consumer price
The U.S. Department of Agriculture publishes data annually on various selected farm products. Shown here are the unit production figures for three farm products for 10 years during a 20-year period. Use these data and a stepwise regression analysis to predict corn production by the production of
The American Chamber of Commerce Researchers Association compiles cost-of-living indexes for selected metropolitan areas. Shown here are cost-of-living indexes for 25 different cities on five different items for a recent year. Use the data to develop a regression model to predict the grocery
A stepwise regression procedure was used to analyze a set of 20 observations taken on four predictor variables to predict a dependent variable. The results of this procedure are given next.Discuss theresults.
Shown here are the data for y and three predictors, x1, x2, and x3. A stepwise regression procedure has been done on these data; the results are also given.Comment on the outcome of the stepwise analysis in light of thedata.
Shown below is output from two Excel regression analyses on the same problem. The first output was done on a "full" model. In the second output, the variable with the smallest absolute t value has been removed, and the regression has been rerun like a second step of a backward elimination process.
The DeBourgh Manufacturing Company was founded in 1909 as a metal-fabricating company in Minnesota by the four Berg brothers. In the 1980s, the company ran into hard times, as did the rest of the metal-fabricating industry. Among the problems that DeBourgh faced were declining sales, deteriorating
Use the forecast errors given here to compute MAD and MSE. Discuss the information yielded by each type of error measurement.Period e1 ..........2.32 ..........1.63 ..........-1.44 ..........1.15 ...........36 .......... -.97 .......... -1.98 ..........-2.19 ...........7
Determine the error for each of the following forecasts. Compute MAD andMSE.
Using the following data, determine the values of MAD and MSE.Which of these measurements of error seems to yield the best information about the forecasts?Why?
Figures for acres of tomatoes harvested in the United States from an 11-year period follow. The data are published by the U.S. Department of Agriculture.With these data, forecasts have been made by using techniques presented later in this chapter.Compute MAD and MSE on these forecasts. Comment on
Use the following time-series data to answer the given questions.a. Develop forecasts for periods 5 through 10 using 4-month moving averages.b. Develop forecasts for periods 5 through 10 using 4-month weighted moving averages.Weight the most recent month by a factor of 4, the previous month by 2,
Following are time-series data for eight different periods. Use exponential smoothing to forecast the values for periods 3 through 8. Use the value for the first period as the forecast for the second period. Compute forecasts using two different values of alpha, α = .1 and
Following are time-series data for nine time periods. Use exponential smoothing with constants of .3 and .7 to forecast time periods 3 through 9. Let the value for time period 1 be the forecast for time period 2. Compute additional forecasts for time periods 4 through 9 using a 3-month moving
The U.S. Census Bureau publishes data on factory orders for all manufacturing, durable goods, and nondurable goods industries. Shown here are factory orders in the United States over a 13-year period ($ billion).a. Use these data to develop forecasts for the years 6 through 13 using a 5-year moving
The following data show the number of issues from initial public offerings (IPOs) for a 13-year period released by the Securities Data Company. Use these data to develop forecasts for the years 3 through 13 using exponential smoothing techniques with alpha values of .2 and .9. Let the forecast for
The "Economic Report to the President of the United States" included data on the amounts of manufacturers' new and unfilled orders in millions of dollars. Shown here are the figures for new orders over a 21-year period. Use a computer to develop a regression model to fit the trend effects for these
The following data on the number of union members in the United States for the years 1984 through 2008 are provided by the U.S. Bureau of Labor Statistics. Using regression techniques discussed in this section, analyze the data for trend. Develop a scatter plot of the data and fit the trend line
Shown below are dollar figures for commercial and industrial loans at all commercial banks in the United States as recorded for the month of April during a recent 9-year period and published by the Federal Reserve Bank of St. Louis. Plot the data, fit a trend line, and discuss the strength of the
The U.S. Department of Agriculture publishes statistics on the production of various types of food commodities by month. Shown here are the production figures on broccoli for January of a recent year through December of the next year.Use these data to compute 12-month centered moving averages (T
The U.S. Department of Commerce publishes census information on manufacturing. Included in these figures are monthly shipment data for the paperboard container and box industry shown on the next page for 6 years.The shipment figures are given in millions of dollars. Use the data to analyze the
The U.S. Department of Labor publishes consumer price indexes (CPIs) on many commodities. Following are the percentage changes in the CPIs for food and for shelter for the years 1980 through 2008. Use these data to develop a linear regression model to forecast the percentage change in food CPIs by
Use the data from Problem 15.15 to create a regression forecasting model using the first-differences data transformation. How do the results from this model differ from those obtained in Problem 15.15?in Problem 15.15Let a =.05.
The Federal Deposit Insurance Corporation (FDIC) releases data on bank failures. Following are data on the number of U.S. bank failures in a given year and the total amount of bank deposits (in $ millions) involved in such failures for a given year. Use these data to develop a simple regression
Use the data in Problem 15.17 to compute a regression model after recoding the data by the first-differences approach. Compute a Durbin-Watson statistic to determine whether significant autocorrelation is present in this first-differences model. Compare this model with the model determined in
Current Construction Reports from the U.S. Census Bureau contain data on new privately owned housing units. Data on new privately owned housing units (1000s) built in the West between 1980 and 2006 follow. Use these time-series data todevelop an autoregression model with a one-period lag. Now try
The U.S. Department of Agriculture publishes data on the production, utilization, and value of fruits in the United States. Shown here are the amounts of noncitrus fruit processed into juice (in kilotons) for a 25-year period. Use these data to develop an autoregression forecasting model with a
Suppose the following data represent the price of 20 reams of office paper over a 50-year time frame. Find the simple index numbers for the data.a. Let 1950 be the base year.b. Let 1980 be the baseyear.
The U.S. Patent and Trademark Office reports fiscal year figures for patents issued in the United States. Following are the numbers of patents issued for the years 1980 through 2007. Using these data and a base year of 1990, determine the simple index numbers for each year.
Using the data that follow, compute the aggregate index numbers for the four types of meat. Let 1995 be the base year for this market basket ofgoods.
Suppose the following data are prices of market goods involved in household transportation for the years 2001 through 2009. Using 2003 as a base year, compute aggregate transportation price indexes for thisdata.
Calculate Laspeyres price indexes for 2007-2009 from the following data. Use 2000 as the baseyear.
Calculate Paasche price indexes for 2008 and 2009 using the following data and 2000 as the baseyear.
Following are the average yields of long-term new corporate bonds over a several-month period published by the Office of Market Finance of the U.S. Department of the Treasury.a. Explore trends in these data by using regression trend analysis. How strong are the models? Is the quadratic model
Compute index numbers for the following data using 1995 as the base year.
Compute unweighted aggregate price index numbers for each of the given years using 2005 as the baseyear.
Using the following data and 2006 as the base year, compute the Laspeyres price index for 2009 and the Paasche price index for2008.
The following data contain the quantity (million pounds) of U.S. domestic fish caught annually over a 25-year period as published by the National Oceanic and Atmospheric Administration.a. Use a 3-year moving average to forecast the quantity of fish for the years 1983 through 2004 for these data.
The U.S. Department of Commerce publishes a series of census documents referred to as Current Industrial Reports. Included in these documents are the manufacturers' shipments, inventories, and orders over a 5-year period. Displayed here is a portion of these data representing the shipments of
Use the seasonal indexes computed to deseasonalize the data in Problem 15.32.in Problem 15.32.Chemicalsand AlliedProductsTime Period ($ billion)January (year 5) ........28.931February ...........30.456March ............32.372April ..............30.905May ............30.743June
Determine the trend for the data in Problem 15.32 using the deseasonalized data from Problem 15.33. Explore both a linear and a quadratic model in an attempt to develop the better trend model.in Problem 15.32.Chemicalsand AlliedProductsTime Period ($ billion)January (year 5) ........28.931February
Shown here are retail price figures and quantity estimates for five different food commodities over 3 years. Use these data and a base year of 2007 to compute unweighted aggregate price indexes for this market basket of food. Using a base year of 2007, calculate Laspeyres price indexes and Paasche
Given below are data on the number of business establishments (millions) and the self-employment rate (%) released by the Small Business Administration, Office of Advocacy, for a 21-year period of U.S. business activity. Develop a regression model to predict the selfemployment rate by the number of
Shown here are the consumer price indexes (CPIs) for housing for the years 1988 through 2005 from the Bureau of Labor Statistics Data Web site. Use the data to answer the following questions.a. Compute the 4-year moving average to forecast the CPIs from 1992 through 2005.b. Compute the 4-year
In the Survey of Current Business, the U.S. Department of Commerce publishes data on farm commodity prices.Time Period Cotton PricesNovember (year 1) .......... 552December .............. 519January (year 2) ........... 505February .............. 512March ............... 541April
The U.S. Department of Commerce publishes data on industrial machinery and equipment. Shown here are the shipments (in $ billions) of industrial machinery and equipment from the first quarter of year 1 through the fourth quarter of year 6. Use these data to determine the seasonal indexes for the
Use the seasonal indexes computed to deseasonalize the data in Problem 15.39.in Problem15.39
Use both a linear and quadratic model to explore trends in the deseasonalized data from Problem 15.40.Which model seems to produce a better fit of thedata?
The Board of Governors of the Federal Reserve System publishes data on mortgage debt outstanding by type of property and holder. The following data give the amounts of residential nonfarm debt (in $ billions) held by savings institutions in the United States over a 10-year period. Use these data to
The data shown here, from the Investment Company Institute, show that the equity fund assets of mutual funds have been growing since 1981. At the same time, money market funds have been increasing since 1980.Use these data to develop a regression model to forecast the equity fund assets by money
The purchasing-power value figures for the minimum wage in year 18 dollars for the years 1 through 18 are shown here. Use these data and exponential smoothing to develop forecasts for the years 2 through 18.Try a = .1, .5, and .8, and compare the results using MAD. Discuss your findings. Select the
Shown on the following page is the Excel output for a regression analysis to predict the number of business bankruptcy filings over a 16-year period by the number of consumer bankruptcy filings. How strong is the model? Note the residuals.Compute a Durbin-Watson statistic from the data and discuss
Foot Locker, Inc., is the world's number one retailer of athletic footwear and apparel. The company has approximately 3,800 retail stores in 21 countries across North America, Europe, and Australia under various brand names. Foot Locker estimates that it controls about 18% of the U.S. $15 billion
Use a chi-square goodness-of-fit test to determine whether the observed frequencies are distributed the same as the expected frequencies (α =.05).
Use the following data and α = .01 to determine whether the observed frequencies represent a uniform distribution.Category fo1 ........ 192 ........ 173 ........ 144 ........
Are the following data Poisson distributed? Use a = .05 and the chi-square goodness-of-fit test to answer this question.What is your estimated lambda?Number of Arrivals fo0 .........281 .........172 .........113 ......... 5
Use the chi-square goodness-of-fit to test to determine if the following observed data are normally distributed. Let = .05.What are your estimated mean and standard deviation?Category Observed10–under 20 ......... 620–under 30 .........1430–under 40 .........2940–under 50
In one survey, successful female entrepreneurs were asked to state their personal definition of success in terms of several categories from which they could select. Thirty-nine percent responded that happiness was their definition of success, 12% said that sales/profit was their definition, 18%
The following percentages come from a national survey of the ages of prerecorded-music shoppers. A local survey produced the observed values.Does the evidence in the observed data indicate that we should reject the national survey distribution for local prerecorded-music shoppers? Use α =.01.
The general manager of a Major League Baseball team believes the ages of purchasers of game tickets are normally distributed. The following data represent the distribution of ages for a sample of observed purchasers of Major League Baseball game tickets. Use the chi-square goodness-of-fit test to
The Springfield Emergency Medical Service keeps records of emergency telephone calls. A study of 150 five-minute time intervals resulted in the distribution of number of calls as follows. For example, during 18 of the 5-minute intervals, no calls occurred. Use the chi-square goodness-of-fit test
According to an extensive survey conducted for Business Marketing by Leo J. Shapiro & Associates, 66% of all computer companies are going to spend more on marketing this year than in previous years. Only 33% of other information technology companies and 28% of non-information technology
Cross-cultural training is rapidly becoming a popular way to prepare executives for foreign management positions within their company. This training includes such aspects as foreign language, previsit orientations, meetings with former expatriates, and cultural background information on the
Use the following contingency table to test whether variable 1 is independent of variable 2.Let a =.01.
Use the following contingency table to determine whether variable 1 is independent of variable 2.Let a =.01.
Use the following contingency table and the chi-square test of independence to determine whether social class is independent of number of children in a family.Let a =.05.
A group of 30-year-olds is interviewed to determine whether the type of music most listened to by people in their age category is independent of the geographic location of their residence.Use the chi-square test of independence, a = .01, and the following contingency table to determine whether
Is the transportation mode used to ship goods independent of type of industry? Suppose the following contingency table represents frequency counts of types of transportation used by the publishing and the computer hardware industries.Analyze the data by using the chi-square test of independence to
According to data released by the U.S. Department of Housing and Urban Development about new homes built in the United States, there is an almost 50-50 split between one-story and two-story homes. In addition, more than half of all new homes have three bedrooms. Suppose a study is done to determine
A study was conducted to determine the impact of a major Mexican peso devaluation on U.S. border retailers. As a part of the study, data were gathered on the magnitude of business that U.S. border retailers were doing with Mexican citizens. Forty-one shoppers of border city department stores were
Use a chi-square goodness-of-fit test to determine whether the following observed frequencies are distributed the same as the expected frequencies.Let a =.01.
Use the chi-square contingency analysis to test to determine whether variable 1 is independent of variable 2.Use 5% level ofsignificance.
Is a manufacturer's geographic location independent of type of customer? Use the following data for companies with primarily industrial customers and companies with primarily retail customers to test this question.Let α =.10.
A national youth organization sells six different kinds of cookies during its annual cookie campaign. A local leader is curious about whether national sales of the six kinds of cookies are uniformly distributed. He randomly selects the amounts of each kind of cookies sold from five youths and
A researcher interviewed 2067 people and asked whether they were the primary decision makers in the household when buying a new car last year. Two hundred seven were men and had bought a new car last year. Sixty-five were women and had bought a new car last year. Eight hundred eleven of the
Are random arrivals at a shoe store at the local mall Poisson distributed? Suppose a mall employee researches this question by gathering data for arrivals during one minute intervals on a weekday between 6:30 P.M. and 8:00 P.M. The data obtained follow. Use a = .05 to determine whether the observed
According to Beverage Digest/Maxwell Report, the distribution of market share for the top seven soft drinks in the United States was: Coca-Cola 17.9%, Pepsi-Cola 11.5%, Diet Coke 9.7%, Mountain Dew 6.3%, Diet Pepsi 6.1%, Sprite 5.7%, and Dr. Pepper 5.6%. Suppose a marketing analyst wants to
Showing 5000 - 5100
of 88243
First
44
45
46
47
48
49
50
51
52
53
54
55
56
57
58
Last
Step by Step Answers
.png)
.png)
.png)
.png)
.png)
.png)
.png)
.png)
.png)
.png)
.png)
.png)
.png)
.png)
.png)
.png)
.png)
.png)
.png)
.png)
.png)
.png)
.png)
.png)
.png)
.png)
.png)
.png)
.png)
.png)
.png)
.png)
.png)
.png)
.png)
.png)
.png)
.png)
.png)
.png)
.png)
.png)
.png)
.png)
-1.png)
.png)
.png)
.png)
.png)
.png)
.png)
.png)
.png)
.png)
.png)
.png)
.png)
.png)
.png)
.png)
-1.png)
-2.png)
.png)
.png)
.png)
.png)
.png)
.png)
.png)
.png)
.png)
.png)
.png)

