New Semester
Started
Get
50% OFF
Study Help!
--h --m --s
Claim Now
Question Answers
Textbooks
Find textbooks, questions and answers
Oops, something went wrong!
Change your search query and then try again
S
Books
FREE
Study Help
Expert Questions
Accounting
General Management
Mathematics
Finance
Organizational Behaviour
Law
Physics
Operating System
Management Leadership
Sociology
Programming
Marketing
Database
Computer Network
Economics
Textbooks Solutions
Accounting
Managerial Accounting
Management Leadership
Cost Accounting
Statistics
Business Law
Corporate Finance
Finance
Economics
Auditing
Tutors
Online Tutors
Find a Tutor
Hire a Tutor
Become a Tutor
AI Tutor
AI Study Planner
NEW
Sell Books
Search
Search
Sign In
Register
study help
business
biostatistics
Biostatistics A Foundation For Analysis In The Health Sciences 9th Edition Wayne W. Daniel - Solutions
Moerloose et al. (A-18) conducted a study to evaluate the clinical usefulness of a new laboratory technique (method A) for use in the diagnosis of pulmonary embolism (PE). The performance of the new technique was compared with that of a standard technique (method B). Subjects consisted of patients
Park et al. (A-17) studied 29 male subjects with clinically confirmed cirrhosis. Among other variables, they measured whole blood manganese levels (MnB), plasma manganese (MnP), urinary manganese (MnU), and pallidal index (PI), a measure of signal intensity in T1 weighted magnetic resonance imaging
Skinner et al. (A-16) conducted a cross-sectional telephone survey to obtain 24-hour dietary recall of infants’ and toddlers’ food intakes, as reported by mothers or other primary caregivers.One finding of interest was that among 561 toddlers ages 15–24 months, the age in weeks of the child
Lamarre-Cliche et al. (A-15) state, “The QT interval corrected for heart rate (QTc) is believed to reflect sympathovagal balance. It has also been established that -blockers influence the autonomic nervous system.” The researchers performed correlation analysis to measure the association
The following data were collected during an experiment in which laboratory animals were inoculated with a pathogen. The variables are time in hours after inoculation and temperature in degrees Celsius.Time Temperature Time Temperature 24 38.8 44 41.1 28 39.5 48 41.4 32 40.3 52 41.6 36 40.7 56 41.8
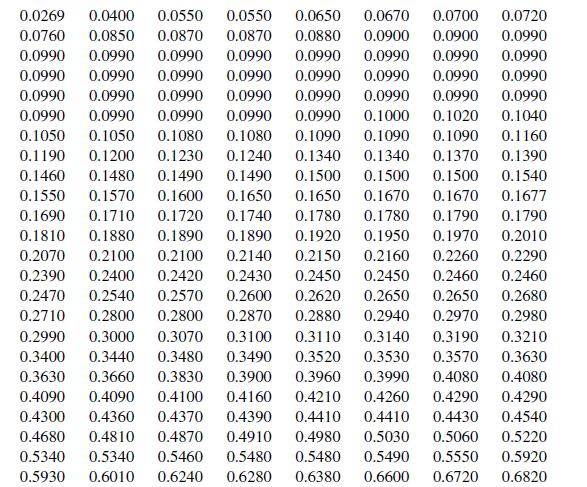
The following are the weights (kg) and blood glucose levels (mg/100 ml) of 16 apparently healthy adult males:Weight (X) Glucose (Y)64.0 108 75.3 109 73.0 104 82.1 102 76.2 105 95.7 121 59.4 79 93.4 107 82.1 101 78.9 85 76.7 99 82.1 100 83.9 108 73.0 104 64.4 102 77.6 87 Find the simple linear
The following table shows the methyl mercury intake and whole blood mercury values in 12 subjects exposed to methyl mercury through consumption of contaminated fish:X Y Methyl Mercury in Mercury Intake Whole Blood( g Hg/day) (ng/g)180 90 200 120 230 125 410 290 X Y Methyl Mercury in Mercury Intake
Fifteen specimens of human sera were tested comparatively for tuberculin antibody by two methods.The logarithms of the titers obtained by the two methods were as follows:Method A (X) B (Y)3.31 4.09 2.41 3.84 2.72 3.65 2.41 3.20 2.11 2.97 2.11 3.22 3.01 3.96 2.13 2.76 2.41 3.42 2.10 3.38 2.41 3.28
The following are the pulmonary blood flow (PBF) and pulmonary blood volume (PBV) values recorded for 16 infants and children with congenital heart disease:Y X PBV (ml/sqM) PBF (L/min/sqM)168 4.31 280 3.40 391 6.20 420 17.30 303 12.30 429 13.99 605 8.73 522 8.90 224 5.87 291 5.00 Y X PBV (ml/sqM)
A study by Triller et al. (A-14) examined the length of time required for home health-care nurses to repackage a patient’s medications into various medication organizers (i.e., pill boxes). For the 19 patients in the study, researchers recorded the time required for repackaging of
Maria Mathias (A-13) conducted a study of hyperactive children. She measured the children’s attitude, hyperactivity, and social behavior before and after treatment. The following table shows for 31 subjects the age and improvement scores from pre-treatment to post-treatment for attitude(ATT),
Dean Parmalee (A-12) wished to know if the year-end grades assigned to Wright State University Medical School students are predictive of their second-year board scores. The following table shows, for 89 students, the year-end score (AVG, in percent of 100) and the score on the secondyear medical
A study by Scrogin et al. (A-11) was designed to assess the effects of concurrent manipulations of dietary NaCl and calcium on blood pressure as well as blood pressure and catecholamine responses to stress. Subjects were salt-sensitive, spontaneously hypertensive male rats. Among the analyses
Describe a situation in your particular area of interest where simple correlation analysis would be useful. Use real or realistic data and do a complete correlation analysis.In each of the following exercises, carry out the required analysis and test hypotheses at the indicated significance levels.
Describe a situation in your particular area of interest where simple regression analysis would be useful. Use real or realistic data and do a complete regression analysis.
Explain why it is risky to use a sample regression equation to predict or to estimate outside the range of values of the independent variable represented in the sample.
What are the possible explanations for a significant sample correlation coefficient?
What is meant by the unit of association in regression and correlation analysis?
What are the assumptions underlying simple correlation analysis when inference is an objective?
For what two purposes can a regression equation be used?
Describe three ways in which one may test the null hypothesis that .
What is the function of the analysis of variance in regression analysis?
Explain the meaning of and the method of computing the coefficient of determination.
Explain the following terms:(a) Total sum of squares(b) Explained sum of squares(c) Unexplained sum of squares
Explain the meaning of in the sample regression equation.
Explain the meaning of in the sample regression equation.
Why is the regression equation called the least-squares equation?
What are the assumptions underlying simple linear regression analysis when one of the objectives is to make inferences about the population from which the sample data were drawn?
be able to calculate and interpret measures of dispersion, such as the range, variance, and standard deviation.
be able to calculate and interpret measures of central tendency, such as the mean, median, and mode.
understand how to reduce data sets into a few useful, descriptive measures.
understand how data can be appropriately organized and displayed.
For Situation A describe how you would use a stratified random sample to collect the data. For Situation B describe how you would use systematic sampling of patient records to collect the data.
Consider the two situations given in Exercise
For each of the following situations, answer questions a through e:(a) What is the sample in the study?(b) What is the population?(c) What is the variable of interest?(d) How many measurements were used in calculating the reported results?(e) What measurement scale was used?Situation A. A study of
For each of the following variables, indicate whether it is quantitative or qualitative and specify the measurement scale that is employed when taking measurements on each:(a) Class standing of the members of this class relative to each other(b) Admitting diagnosis of patients admitted to a mental
List, describe, and compare the four measurement scales.
Define the word measurement.
Define:(a) Statistics (b) Biostatistics(c) Variable (d) Quantitative variable(e) Qualitative variable (f) Random variable(g) Population (h) Finite population(i) Infinite population (j) Sample(k) Discrete variable (l) Continuous variable(m) Simple random sample (n) Sampling with replacement(o)
Explain what is meant by inferential statistics.
Explain what is meant by descriptive statistics.
Continuing with Exercise 1.5.1, consider how you would use the scientific method to test the observation that both exercise and change in diet are related to weight loss. Include all of the steps, paying particular attention to how you might design the experiment and which hypotheses would be
Using the example of weight loss as an endpoint, discuss how you would use the scientific method to test the observation that change in diet is related to weight loss. Include all of the steps, including the hypothesis to be tested and the design of your experiment.
Construct an example where it would be appropriate to use stratified sampling. Discuss how you would use stratified random sampling and stratified sampling proportional to size with this example.Which do you think would best represent the population that you described in your example? Why?
Using the table of random numbers, select a random sample and a systematic sample, each of size 15, from the data in Table 1.4.1. Visually compare the distributions of the two samples. Do they appear similar? Which appears to be the best representation of the data?
Select another simple random sample of size 10 from the population represented in Table 1.4.1.Compare the subjects in this sample with those in the sample drawn in Exercise 1.4.1. Are there any subjects who showed up in both samples? How many? Compare the ages of the subjects in the two samples.
Using the table of random numbers, select a new random starting point, and draw another simple random sample of size 10 from the data in Table 1.4.1. Record the ages of the subjects in this new sample. Save your data for future use. What is the variable of interest in this exercise? What
Using the table of random numbers, select a new random starting point, and draw another simple random sample of size 10 from the data in Table 1.4.1. Record the ages of the subjects in this new sample. Save your data for future use. What is the variable of interest in this exercise? What
Select another simple random sample of size 10 from the population represented in Table 1.4.1.Compare the subjects in this sample with those in the sample drawn in Exercise 1.4.1. Are there any subjects who showed up in both samples? How many? Compare the ages of the subjects in the two samples.
Using the table of random numbers, select a random sample and a systematic sample, each of size 15, from the data in Table 1.4.1. Visually compare the distributions of the two samples. Do they appear similar? Which appears to be the best representation of the data?
Construct an example where it would be appropriate to use stratified sampling. Discuss how you would use stratified random sampling and stratified sampling proportional to size with this example.Which do you think would best represent the population that you described in your example?Why?
Using the example of weight loss as an endpoint, discuss how you would use the scientific method to test the observation that change in diet is related to weight loss. Include all of the steps, including the hypothesis to be tested and the design of your experiment.
Continuing with Exercise 1.5.1, consider how you would use the scientific method to test the observation that both exercise and change in diet are related to weight loss. Include all of the steps, paying particular attention to how you might design the experiment and which hypotheses would be
In a study of the oral home care practice and reasons for seeking dental care among individuals on renal dialysis, Atassi (A-1) studied 90 subjects on renal dialysis. The oral hygiene status of all subjects was examined using a plaque index with a range of 0 to 3 10 = no soft plaque deposits, 3 =
Janardhan et al. (A-2) conducted a study in which they measured incidental intracranial aneurysms(IIAs) in 125 patients. The researchers examined postprocedural complications and concluded that IIAs can be safely treated without causing mortality and with a lower complications rate than previously
Hoekema et al. (A-3) studied the craniofacial morphology of patients diagnosed with obstructive sleep apnea syndrome (OSAS) in healthy male subjects. One of the demographic variables the researchers collected for all subjects was the Body Mass Index (calculated by dividing weight in kg by the
David Holben (A-4) studied selenium levels in beef raised in a low selenium region of the United States. The goal of the study was to compare selenium levels in the region-raised beef to selenium levels in cooked venison, squirrel, and beef from other regions of the United States. The data below
The following table shows the number of hours 45 hospital patients slept following the administration of a certain anesthetic.7 10 12 4 8 7 3 8 5 12 11 3 8 1 1 13 10 4 4 5 5 8 7 7 3 2 3 8 13 1 7 17 3 4 5 5 3 1 17 10 4 7 7 11 8(a) From these data construct:A frequency distribution A relative
The following are the number of babies born during a year in 60 community hospitals.30 55 27 45 56 48 45 49 32 57 47 56 37 55 52 34 54 42 32 59 35 46 24 57 32 26 40 28 53 54 29 42 42 54 53 59 39 56 59 58 49 53 30 53 21 34 28 50 52 57 43 46 54 31 22 31 24 24 57 29(a) From these data construct:A
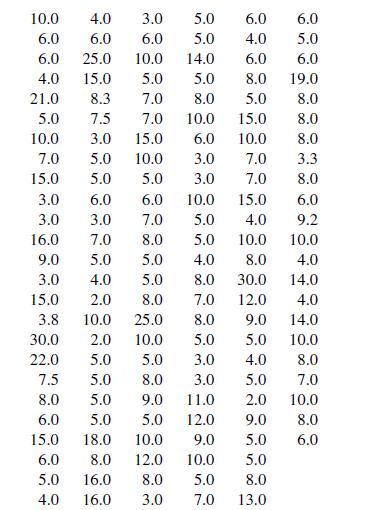
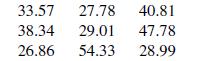
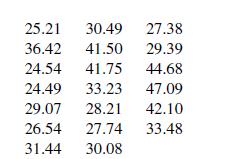
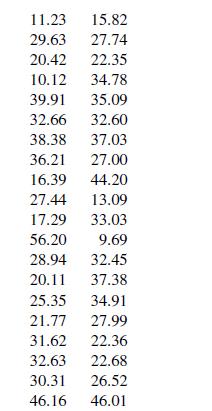
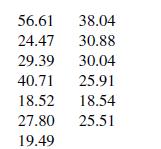
In a study of physical endurance levels of male college freshman, the following composite endurance scores based on several exercise routines were collected.(a) From these data construct:A frequency distribution A relative frequency distribution A frequency polygon A histogram (b) Describe these
The following are the ages of 30 patients seen in the emergency room of a hospital on a Friday night. Construct a stem-and-leaf display from these data. Describe these data relative to symmetry and skewness as discussed in Exercise 2.3.1, part h. 35 36 222 32 21 12 54 47 43 39 60 45 37 53 45 23 64
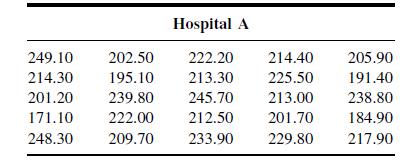
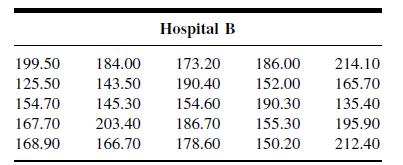
The following are the emergency room charges made to a sample of 25 patients at two city hospitals.Construct a stem-and-leaf display for each set of data. What does a comparison of the two displays suggest regarding the two hospitals? Describe the two sets of data with respect to symmetry and
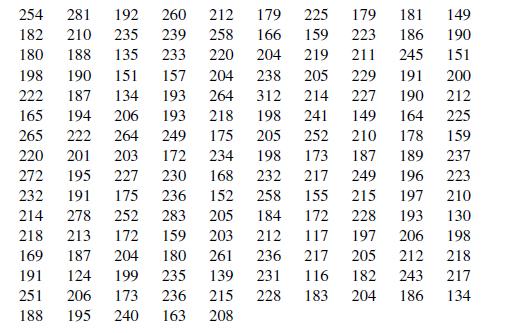
Refer to the ages of patients discussed in Example 1.4.1 and displayed in Table 1.4.1.(a) Use class interval widths of 5 and construct:A frequency distribution A relative frequency distribution A cumulative frequency distribution A cumulative relative frequency distribution A histogram A frequency
The objectives of a study by Skjelbo et al. (A-5) were to examine (a) the relationship between chloroguanide metabolism and efficacy in malaria prophylaxis and (b) the mephenytoin metabolism and its relationship to chloroguanide metabolism among Tanzanians. From information provided by urine
Schmidt et al. (A-6) conducted a study to investigate whether autotransfusion of shed mediastinal blood could reduce the number of patients needing homologous blood transfusion and reduce the amount of transfused homologous blood if fixed transfusion criteria were used. The following table shows
Porcellini et al. (A-8) studied 13 HIV-positive patients who were treated with highly active antiretroviral therapy (HAART) for at least 6 months. The CD4 T cell counts 1* 106>L2 at baseline for the 13 subjects are listed below. 230 205 313 207 227 245 173 58 103 181 105 301 169
Shair and Jasper (A-9) investigated whether decreasing the venous return in young rats would affect ultrasonic vocalizations (USVs). Their research showed no significant change in the number of ultrasonic vocalizations when blood was removed from either the superior vena cava or the carotid artery.
Butz et al. (A-10) evaluated the duration of benefit derived from the use of noninvasive positivepressure ventilation by patients with amyotrophic lateral sclerosis on symptoms, quality of life, and survival. One of the variables of interest is partial pressure of arterial carbon dioxide
According to Starch et al. (A-11), hamstring tendon grafts have been the “weak link” in anterior cruciate ligament reconstruction. In a controlled laboratory study, they compared two techniques for reconstruction: either an interference screw or a central sleeve and screw on the tibial side.
Cardosi et al. (A-12) performed a 4-year retrospective review of 102 women undergoing radical hysterectomy for cervical or endometrial cancer. Catheter-associated urinary tract infection was observed in 12 of the subjects. Below are the numbers of postoperative days until diagnosis of the infection
The purpose of a study by Nozawa et al. (A-13) was to evaluate the outcome of surgical repair of a pars interarticularis defect by segmental wire fixation in young adults with lumbar spondylolysis.The authors found that segmental wire fixation historically has been successful in the treatment of
See Exercise 2.3.1.
See Exercise 2.3.2.
See Exercise 2.3.3.
See Exercise 2.3.4.
See Exercise 2.3.5.
See Exercise 2.3.6.
See Exercise 2.3.7.
In a pilot study, Huizinga et al. (A-14) wanted to gain more insight into the psychosocial consequences for children of a parent with cancer. For the study, 14 families participated in semistructured interviews and completed standardized questionnaires. Below is the age of the sick parent with
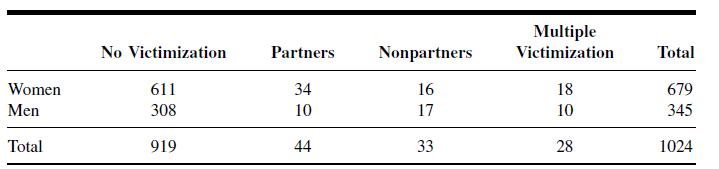
In a study of violent victimization of women and men, Porcerelli et al. (A-2) collected information from 679 women and 345 men aged 18 to 64 years at several family practice centers in the metropolitan Detroit area. Patients filled out a health history questionnaire that included a question about
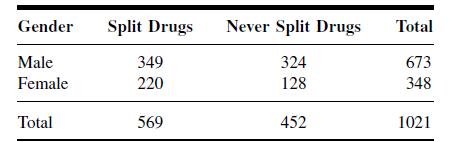
Fernando et al. (A-3) studied drug-sharing among injection drug users in the South Bronx in New York City. Drug users in New York City use the term “split a bag” or “get down on a bag” to refer to the practice of dividing a bag of heroin or other injectable substances. A common practice
Refer to the data in Exercise 3.4.2. State the following probabilities in words and calculate:(a) P(Male Split Drugs)(b) P(Male Split Drugs)(c) P(Male Split Drugs)(d) P(Male)
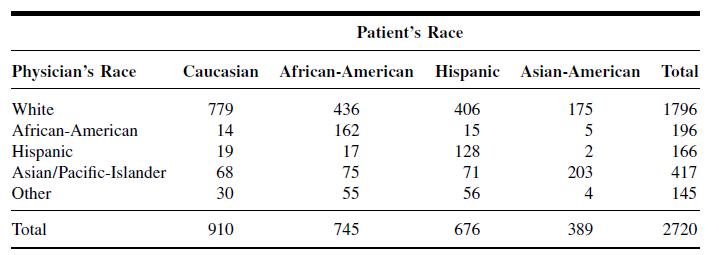
Laveist and Nuru-Jeter (A-4) conducted a study to determine if doctor–patient race concordance was associated with greater satisfaction with care. Toward that end, they collected a national sample of African-American, Caucasian, Hispanic, and Asian-American respondents. The following table
If the probability of left-handedness in a certain group of people is .05, what is the probability of right-handedness (assuming no ambidexterity)?
The probability is .6 that a patient selected at random from the current residents of a certain hospital will be a male. The probability that the patient will be a male who is in for surgery is .2. A patient randomly selected from current residents is found to be a male; what is the probability
In a certain population of hospital patients the probability is .35 that a randomly selected patient will have heart disease. The probability is .86 that a patient with heart disease is a smoker. What is the probability that a patient randomly selected from the population will be a smoker and have
A medical research team wishes to assess the usefulness of a certain symptom (call it S) in the diagnosis of a particular disease. In a random sample of 775 patients with the disease, 744 reported having the symptom. In an independent random sample of 1380 subjects without the disease, 21 reported
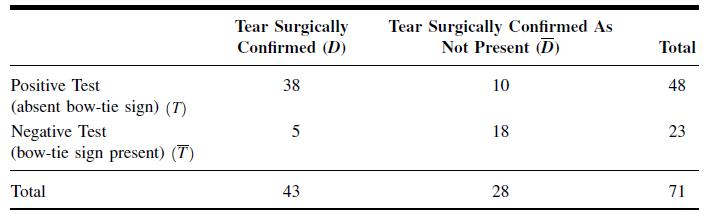
In an article entitled “Bucket-Handle Meniscal Tears of the Knee: Sensitivity and Specificity of MRI signs,” Dorsay and Helms (A-6) performed a retrospective study of 71 knees scanned by MRI. One of the indicators they examined was the absence of the “bow-tie sign” in the MRI as evidence of
Oexle et al. (A-7) calculated the negative predictive value of a test for carriers of X-linked ornithine transcarbamylase deficiency (OTCD—a disorder of the urea cycle). A test known as the “allopurinol test” is often used as a screening device of potential carriers whose relatives are OTCD
In a study by Cross et al. (A-2), patients who were involved in problem gambling treatment were asked about co-occurring drug and alcohol addictions. Let the discrete random variable X represent the number of co-occurring addictive substances used by the subjects. Table 4.2.4 summarizes the
Refer to Exercise 4.2.1.(a) What is probability that an individual selected at random used five addictive substances?(b) What is the probability that an individual selected at random used fewer than three addictive substances?(c) What is the probability that an individual selected at random used
Refer to Exercise 4.2.1. Find the mean, variance, and standard deviation of this frequency distribution.
Based on data collected by the National Center for Health Statistics and made available to the public in the Sample Adult database (A-5), an estimate of the percentage of adults who have at some point in their life been told they have hypertension is 23.53 percent. If we select a simple random
Refer to Exercise 4.3.1. How many adults who have been told that they have hypertension would you expect to find in a sample of 20?
Refer to Exercise 4.3.1. Suppose we select a simple random sample of five adults. Use Equation 4.3.2 to find the probability that, in the sample, the number of people who have been told that they have hypertension will be:(a) Zero (b) More than one(c) Between one and three, inclusive (d) Two or
The same survey database cited in exercise 4.3.1 (A-5) shows that 32 percent of U.S. adults indicated that they have been tested for HIV at some point in their life. Consider a simple random sample of 15 adults selected at that time. Find the probability that the number of adults who have been
Refer to Exercise 4.3.4. Find the mean and variance of the number of people tested for HIV in samples of size 15.
Refer to Exercise 4.3.4. Suppose we were to take a simple random sample of 25 adults today and find that two have been tested for HIV at some point in their life. Would these results be surprising?Why or why not?
Coughlin et al. (A-6) estimated the percentage of women living in border counties along the southern United States with Mexico (designated counties in California, Arizona, New Mexico, and Texas) who have less than a high school education to be 18.7. Assume the corresponding probability is .19.
In a survey of nursing students pursuing a master’s degree, 75 percent stated that they expect to be promoted to a higher position within one month after receiving the degree. If this percentage holds for the entire population, find, for a sample of 15, the probability that the number expecting a
Showing 3300 - 3400
of 5191
First
27
28
29
30
31
32
33
34
35
36
37
38
39
40
41
Last
Step by Step Answers