New Semester
Started
Get
50% OFF
Study Help!
--h --m --s
Claim Now
Question Answers
Textbooks
Find textbooks, questions and answers
Oops, something went wrong!
Change your search query and then try again
S
Books
FREE
Study Help
Expert Questions
Accounting
General Management
Mathematics
Finance
Organizational Behaviour
Law
Physics
Operating System
Management Leadership
Sociology
Programming
Marketing
Database
Computer Network
Economics
Textbooks Solutions
Accounting
Managerial Accounting
Management Leadership
Cost Accounting
Statistics
Business Law
Corporate Finance
Finance
Economics
Auditing
Tutors
Online Tutors
Find a Tutor
Hire a Tutor
Become a Tutor
AI Tutor
AI Study Planner
NEW
Sell Books
Search
Search
Sign In
Register
study help
business
business statistics in practice
Business Statistics For Contemporary Decision Making 3rd Canadian Edition Ken Black, Ignacio Castillo - Solutions
Give an example of how judgment sampling could be used in a study to determine how prosecutors feel about lawyers advertising on television.
For each of the following research projects, list three variables for stratification of the sample.a. A nationwide study of motels and hotels is being conducted. An attempt will be made to determine the extent of the availability of online links for customers. A sample of motels and hotels will be
For each of the following research projects, list at least one area or cluster that could be used in obtaining the sample.a. A study of road conditions in the province of Nova Scotiab. A study of Canadian offshore oil wellsc. A study of the environmental effects of petrochemical plants west of the
Develop a frame for the population of each of the following research projects.a. Measuring the job satisfaction of all union employees in a companyb. Conducting a telephone survey in Edmonton, Alberta, to determine the level of interest in opening a new hunting and fishing specialty store in the
According to Zero Population Growth, the average urban U.S. resident consumes 1.49 kg of food per day. Is this figure accurate for Canadian consumers? Suppose 64 Canadians are identified by a random procedure and their average consumption per day is 1.63 kg of food. Assume a population variance of
The mean of a population is 76 and the standard deviation is 14. The shape of the population is unknown. Determine the probability of each of the following occurring from this population.a. A random sample of size 35 yielding a sample mean of 79 or moreb. A random sample of size 140 yielding a
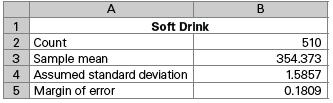
A soft drink company produces a cola in a 355 ml can. Even though the machines are set to fill the cans with 355 ml, variation due to calibration, operator error, and other factors sometimes precludes the cans having the correct fill. To monitor the can fills, a quality team randomly selects some
Based on population figures and other general information on the Canadian population, suppose it has been estimated that, on average, a family of four in Canada has about $1,135 annually in dental expenditures. Suppose further that a regional dental association wants to determine if this figure is
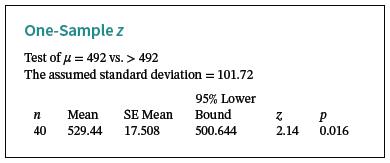
Assume that the national average daily water usage in Canada for 2019 was 492 L per person. Suppose some analysts believe that more water is being used now and want to determine whether this is so. They randomly select a sample of Canadians and carefully keep track of the water used by each sample
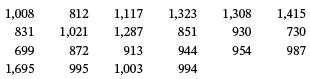
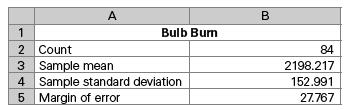
A company has developed a new light bulb that seems to burn longer than most residential bulbs. To determine how long these bulbs burn, the company randomly selects a sample of the bulbs and burns them in the laboratory. The Excel output for a 90% confidence interval is shown here. Discuss the
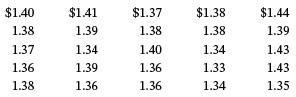
Suppose a study reports that the average price for 1 L of self serve regular unleaded gas is $1.37. You believe that the figure is higher in your area of the country. You decide to test this claim for your part of Canada by randomly calling gas stations. Your random survey of 25 stations produces
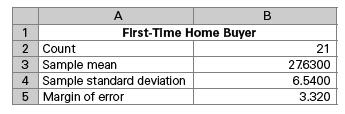
Suppose an analyst wants to estimate the average age of a person who is a first-time home buyer. A random sample of first-time home buyers is taken and their ages are ascertained. The Excel output for a 98% confidence interval is shown here. Study the output and explain its implications.
Candidate Liu believes he will receive 0.55 of the total votes castin his riding. However, in an attempt to validate this figure, his pollstercontacts a random sample of 600 registered voters in the riding. The poll results show that 298 of the voters say they are committed to voting for him. If he
A candy company fills a 550 g package of Halloween candy with individually wrapped pieces of candy. The number of pieces of candy per package varies because the package is sold by mass. The company wants to estimate the number of pieces per package. Inspectors randomly sample 120 packages of this
A manufacturing company produces valves in various sizes and shapes. One particular valve plate is supposed to have a tensile strength of 500 MPa (megapascals). The company tests a random sample of 42 such valve plates from a lot of 650 valve plates. The sample mean is a tensile strength of 506.11
What proportion of pizza restaurants that are primarily for walkin business have a salad bar? Suppose that, in an effort to determine this figure, a random sample of 1,250 of these restaurants across Canada is called. If 997 of the restaurants sampled have a salad bar, what is the 98% confidence
Assume that the average weekly earnings of a production worker in 2010 were $424.20. Suppose a labour analyst wants to determine whether this figure is still accurate today. The analyst randomly selects 54 production workers from across Canada and obtains a representative earnings statement for one
Test each of the following hypotheses by using the given information. Assume the populations are normally distributed.a. H0: σ2 = 20. Ha: σ2 > 20. α = 0.05, n = 15, s2 = 32b. H0: σ2 = 8.5. Ha: σ2 ≠ 8.5. α = 0.10, n = 22, s2 = 17c. H0: σ2 = 45. Ha: σ2 < 45. α = 0.01, n = 8, s2 =
According to a report released by CIBC entitled “Women Entrepreneurs: Leading the Charge,” the average age for Canadian businesswomen in a recent year was 41. In the report, there was some indication that analysts believed that this mean age will increase. Suppose now, several years later,
Suppose that in past years the average price per square metre for warehouses in Canada has been $347.46. A national real estate investor wants to determine whether that figure has changed now. The investor hires an analyst who randomly samples 49 warehouses that are for sale across Canada and finds
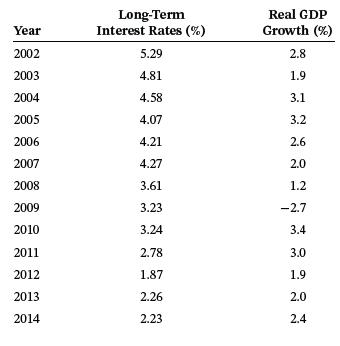
The growth of a country’s Gross Domestic Product (GDP) reflects the strength of the economy. Long-term interest rates, on the other hand, reflect the outlook for inflation in the future. It is said that economic growth often fuels inflation or inflationary expectations. Given here are the
Suppose a null hypothesis is that the population mean is greater than or equal to 100. Suppose further that a random sample of 48 items is taken and the population standard deviation is 14.a. For each of the following α values, compute the probability of committing a Type II error if the
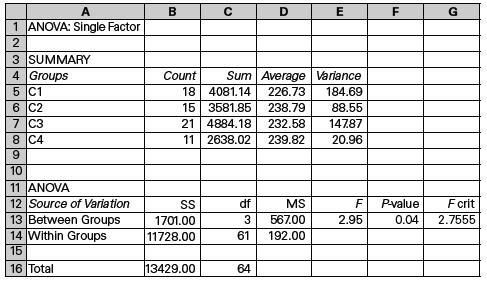
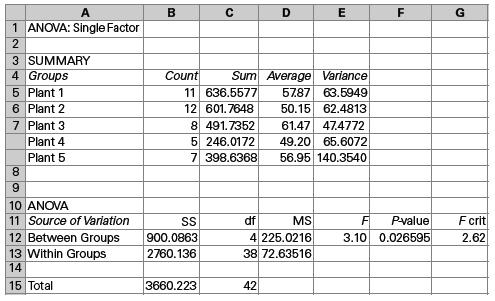
Shown here is the Excel output for a one-way ANOVA. Analyze the results. Include the number of treatment levels, the sample sizes, the F value, the overall statistical significance of the test, and the values of the means. A 1 ANOVA: Single Factor 2 3 SUMMARY 4 Groups 5 C1 6 C2 7 C3 8 C4 9 10 11
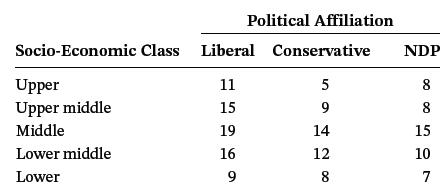
In recent years, the debate over the Canadian economy has been constant. The electorate seems somewhat divided as to whether the economy is in a recovery or not. Suppose a survey was undertaken to ascertain whether the perception of economic recovery in Nova Scotia differs according to political
Use the information given and the eight-step approach to test the hypotheses. Let α = 0.01.H0 : μ = 36Ha : μ ≠ 36n = 63, x̄ = 38.4, σ = 5.93
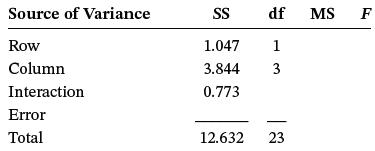
Complete the following two-way ANOVA table. Determine the critical F values and reach conclusions about the hypotheses foreffects. Let α = 0.05. Source of Variance Row Column Interaction Error Total SS df MS 1.047 1 3.844 3 0.773 12.632 نیا 23 F
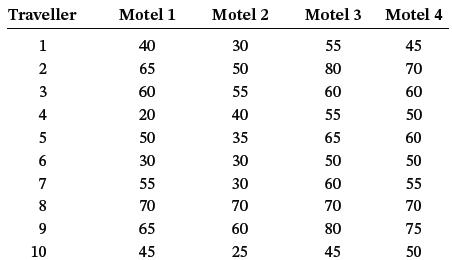
Safety in motels and hotels is a growing concern among travellers. Suppose a survey was conducted by the National Motel and Hotel Association to determine Canadian travellers’ perception of safety in various motel chains. The association chose four different national chains from the economy
Problem 11.16 analyzed the number of hours worked per week per person at five different plants. An F value of 3.10 was obtained with a probability of 0.0266. Because the probability is less than 0.05, the null hypothesis is rejected at α = 0.05. There is an overall difference in the mean weekly
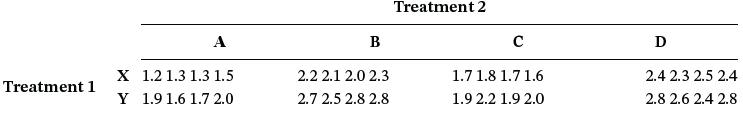
Suppose the following data have been gathered from a study with a two-way factorial design. Use α = 0.05 and a two-way ANOVA to analyze the data. State your conclusions. Treatment 1 A X 1.2 1.3 1.3 1.5 Y 1.9 1.6 1.7 2.0 B 2.2 2.1 2.0 2.3 2.7 2.5 2.8 2.8 Treatment 2 C 1.7 1.8 1.7 1.6 1.9 2.2 1.9
Multinational companies generally provide an allowance for personal entertainment for executives living overseas. Assume that 18% of Canadian-based multinational companies provide such an allowance. An analyst thinks that Canadian-based multinational companies are having a more difficult time
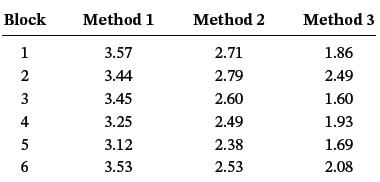
Agricultural analysts are studying three different ways of planting wheat to determine whether significantly different levels of production yield will result. The analysts have access to a large farm on which to conduct their tests. They identify six blocks of land. In each block of land, wheat is
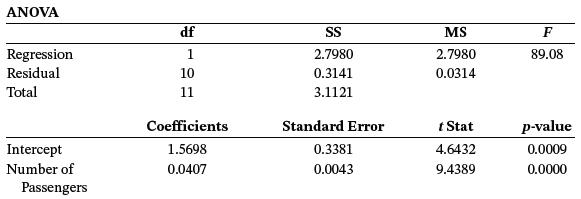
Study the following ANOVA table, which was generated from a simple regression analysis. Discuss the F test of the overall model. Determine the value of t and test the slope of the regression line. ANOVA Regression Residual Total Intercept Number
Assume that according to a survey, a majority of Canadian households have tried to cut long-distance phone bills. Of those who have tried to cut the bills, 32% have done so by switching long distance companies. Suppose business analysts believe that this figure may be higher today. To test this
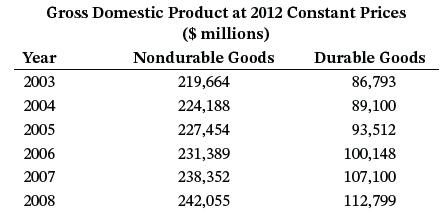
The table below shows the gross domestic product at 2012 constant prices (in $ millions) of consumer durables and nondurables in Canada. Is there a linear relationship between the shipments of durables and nondurables? In other words, if we know the value of nondurables shipped in any one year, can
In Years 1 and 2 combined, 3,337,380 motor vehicles were sold in Canada. Year 2 accounted for 1,716,803 of these vehicles. Suppose that those manufactured overseas (outside North America) accounted for 444,070 of the vehicles sold in Year 2. Suppose 325,421 vehicles built overseas were sold in Year
According to the Canadian Tourism Human Resource Council, 11% of all Canadians in the labour force are employed in the tourism industry.3 Fifty-one percent of those who work in this sector are under 35 years of age. Assume that of those in the Canadian labour force not employed in the tourism
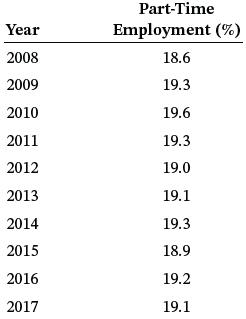
Shown below is the part-time employment incidence (as a percentage of total employment) in Canada between 2008 and 2017, according to the Organisation for Economic Co-operation and Development (OECD). Plot the data, fit a trend line, and discuss the strength of the regression model. In addition,
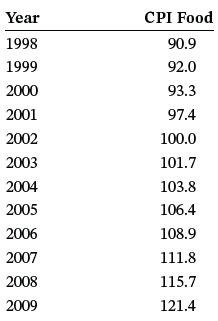
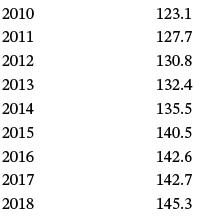
The table below shows the Consumer Price Index (CPI) for food in Canada for the years 1998 to 2018. Using regression techniques discussed in this section, analyze the data for trend. Develop a scatter plot of the data and fit the trend line through the data. Discuss the strength of the model.
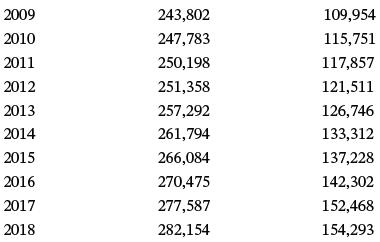
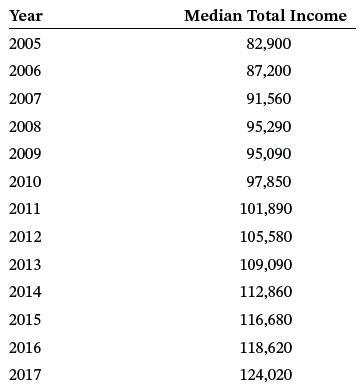
Shown here are the median total incomes for couples with two children.a. Use these data to develop forecasts for the year 2018 using a 5-year moving average.b. Use these data to develop forecasts for the year 2018 using a 5-year weighted moving average. Weight the most recent year by 6, the
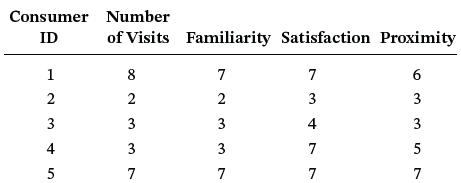
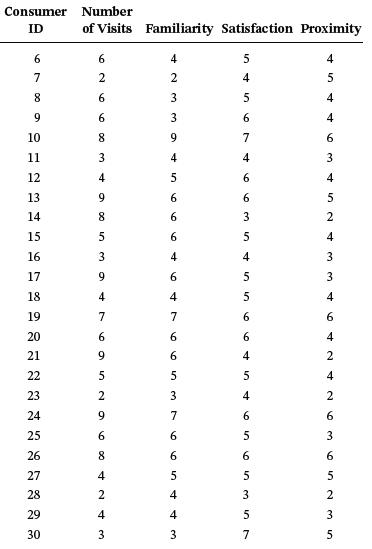
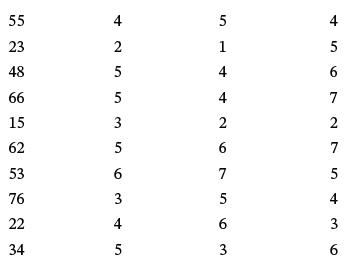
A Canadian supermarket carried out a survey among its customers to predict the factors that influenced the visit frequency to the store. Number of visits refers to the number of times a consumer visited the store in the past 30 days. All the remaining ratings are on a seven-point scale. For
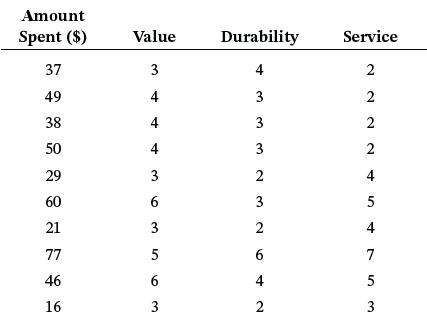
In Problem 14.17, you were asked to use stepwise regression to predict amount spent by value, durability, and service. Study the stepwise results, including the regression coefficients, to determine whether there may be a problem with multicollinearity. Construct a correlation matrix of the three
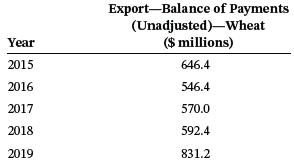
Determine the equation of the trend line for the data shown below on Canadian balance of payments for exports of wheat over a five-year period provided by Statistics Canada. Using the trend line equation, forecast the value for the year 2021. Year 2015 2016 2017 2018 2019 Export-Balance of
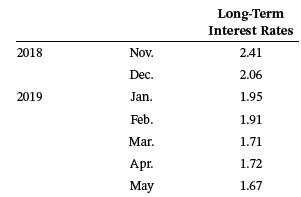
Shown below are the long-term interest rates in Canada over a seven-month period according to the OECD. Use these data to construct a trend line and to forecast the long-term interest rate for June 2019. 2018 2019 Nov. Dec. Jan. Feb. Mar. Apr. May Long-Term Interest
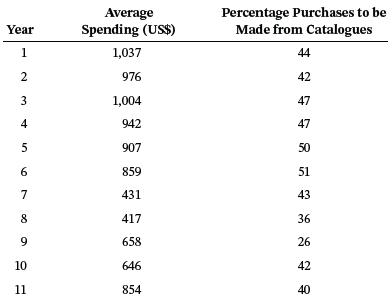
The Chartered Professional Accountants of Canada reported that the average amount of planned spending on gifts for the holiday season in 2018 was $643. In the U.S., however, the average amount of planned spending on gifts for a recent holiday season was US$854, with 40% of those purchases being
The Canada Beef Export Federation reports that the top six destinations for Canadian beef in a recent year were the U.S. with $1,697 million, Mexico with $269 million, Japan with $171 million, South Korea with $28 million, Taiwan with $16 million, and China with $4 million. Construct a pie chart to
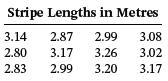
Highway engineers in Alberta are painting white stripes on a highway. The stripes are supposed to be approximately 3 m long. However, because of the machine, the operator, and the motion of the vehicle carrying the equipment, considerable variation occurs among the stripe lengths. Engineers claim
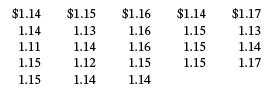
A national survey showed that a certain brand of cold cuts was priced, on average, at $1.15 per 100 g. Suppose a national survey of 23 retail outlets was taken and the price per 100 g of these cold cuts was ascertained. If the following data represent these prices, what is a 90% confidence interval
What proportion of small manufacturing companies in the Greater Toronto Area has a 3D printer? You want to answer this question by conducting a random survey. How large a sample should you take if you want to be 95% confident of the results and you want the error of the confidence interval to be no
Suppose you want to estimate the proportion of cars that are sport utility vehicles (SUVs) being driven in Regina at rush hour by standing on the corner of Victoria Avenue and Albert Street and counting SUVs. You believe the figure is no higher than 0.40. If you want the error of the confidence
Companies often print their corporate policies for training purposes. What is the average length of a company’s policy book? Suppose policy books are sampled from 45 medium-sized companies. The average number of pages in the sample books is 213, and the population standard deviation is 48. Use
Is the environment a major issue with Canadians? To answer that question, an analyst conducts a survey of 1,255 randomly selected Canadians. Suppose 714 of the sampled people replied that the environment is a major issue. Construct a 95% confidence interval to estimate the proportion of Canadians
According to a survey, the average cost of a fast-food meal (quarter-pound cheeseburger, large fries, medium soft drink, excluding taxes) in a certain city is $6.82. Suppose this figure was based on a sample of 27 different establishments and the standard deviation was $0.37. Construct a 95%
A research firm has been asked to determine the proportion of all restaurants in the province of Nova Scotia that serve alcoholic beverages. The firm wants to be 98% confident of its results but has no idea of what the actual proportion is. The firm would like to report an error of no more than
A life insurance salesperson claims the average worker in the city of Winnipeg has no more than $25,000 of personal life insurance. To test this claim, you randomly sample 100 workers in Winnipeg. You find that this sample of workers averages $26,650 of personal life insurance. The population
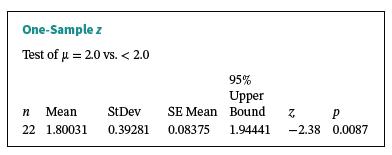
A local company installs natural-gas barbecues. As part of the installation, a ditch is dug to lay a small natural-gas line from the barbecue to the main line. On average, the depth of these lines seems to run about 30 cm. The company claims that the depth does not vary by more than 103.2 cm2 (the
The American Water Works Association reports that, on average, men use between 40 L and 60 L of water daily to shave when they leave the water running. Suppose the following data are the numbers of litres of water used in a day to shave by 12 randomly selected men. Assume that the data come from a
Downtime in virtually any business can be costly. In a manufacturing setting, it means less product produced in a given time period while still having to pay the bills. This might mean late deliveries, backlogs, failure to meet orders, and even loss of market share. Suppose a manufacturing plant
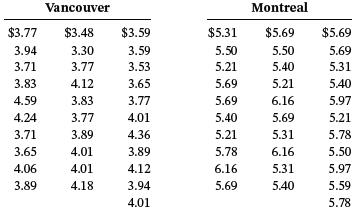
Suppose a market analyst wants to determine the difference in the average price of 4 L of milk in Vancouver and Montreal. To do so, he takes a telephone survey of 31 randomly selected consumers in Vancouver. He first asks whether they have purchased 4 L of milk during the past two weeks. If they
According to Gartner Inc., the largest share of the worldwide PC market is held by HP Inc. with 19.8%. Suppose that a market analyst believes that HP Inc. holds a higher share of the market in Ontario. To verify this theory, he randomly selects 428 people who purchased a personal computer in the
According to Statistics Canada, the average Canadian generates 2 kg of solid waste per day. Suppose we believe that, because of recycling and a greater emphasis on the environment, the figure is now lower. To test this notion, we take a random sample of Canadians and have them keep a log of their
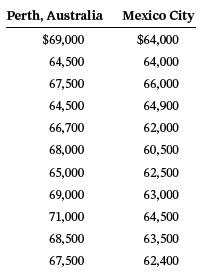
A study was conducted to compare the costs of supporting a family of four Canadians for a year in different foreign cities. The lifestyle of living in Canada on an annual income of $75,000 was the standard against which living in foreign cities was compared. A comparable living standard in Perth,
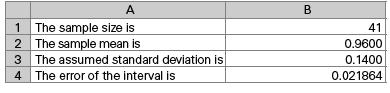
In a recent year, turkey prices increased across Ontario, the top turkey-producing province. Suppose a random sample of turkey prices is taken from across the nation in an effort to estimate the average turkey price per kilogram in Canada. Shown here is the Excel output for such a sample. Examine
A company’s auditor believes the per diem cost in Windsor, Ontario, rose significantly between 2011 and 2021. To test this belief, the auditor samples 51 business trips from the company’s records for 2011; the sample average was $190 per day, with a population standard deviation of $18.50. The
Some fast-food chains offer a lower-priced combination meal in an effort to attract budget-conscious customers. One chain test marketed a burger, fries, and drink combination for $4.71. The weekly sales volume for these meals was impressive. Suppose the chain wants to estimate the average amount
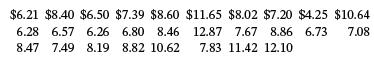
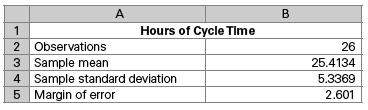
Cycle time in manufacturing can be viewed as the total time it takes to complete a product from the beginning of the production process. The concept of cycle time varies according to the industry and the product or service being offered. Suppose a boat manufacturing company wants to estimate the
Suppose a real estate agent is interested in comparing the asking prices of condos in Montreal and Halifax. The agent conducts a small telephone survey in the two cities, asking the condo prices. A random sample of 21 listings in Montreal resulted in a sample average price of $328,000, with a
A small lawn mower company produced 1,500 lawn mowers during the year. In an effort to determine how maintenance-free these units were, the company decided to conduct a multi-year study of these particular lawn mowers. A sample of 200 owners of these lawn mowers was drawn randomly from company
The highway department wants to estimate the proportion of vehicles on Ontario’s Highway 401 between the hours of midnight and 5 a.m. that are 18-wheel tractor trailers. The estimate will be used to determine highway repair and construction considerations and in highway patrol planning. Suppose
According to the Stern Marketing Group, 9 out of 10 professional women say that financial planning is more important today than it was five years ago. Where do these women go for help in financial planning? Forty-seven percent use a financial advisor (broker, tax consultant, financial planner).
What proportion of commercial airline pilots are more than 40 years of age? Suppose an analyst has access to a list of all pilots who are members of the Air Line Pilots Association. If this list is used as a frame for the study, she can randomly select a sample of pilots, contact them, and
According to Human Resources and Skills Development Canada, the average workweek in Canada was 36.5 hours. Suppose this figure was obtained from a random sample of 20 workers and that the standard deviation of the sample was 4.3 hours. Assume hours worked per week are normally distributed in the
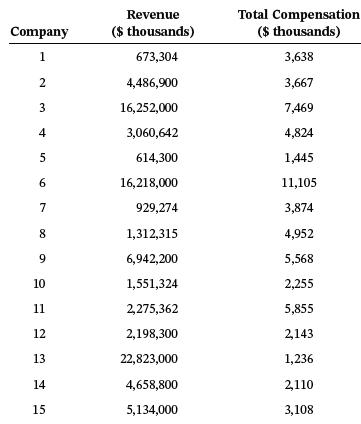
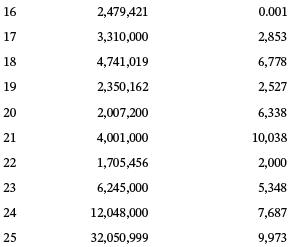
The following data are the revenue and total CEO compensation for 25 large Canadian companies.Use the data to compute a correlation coefficient, r, to determine the correlation between company revenue and total CEO compensation. Company 1 2 3 4 5 6 7 00 8 9 10 11 12 13 14 15 Revenue ($
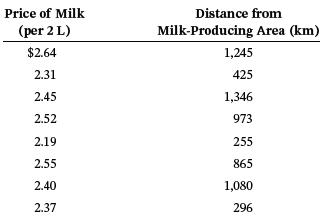
Suppose milk is produced in a certain area. Some people might argue that because of transportation costs, the price of milk in stores increases with the distance of markets from that area. Suppose the milk prices in eight cities are as follows. Price of Milk (per 2
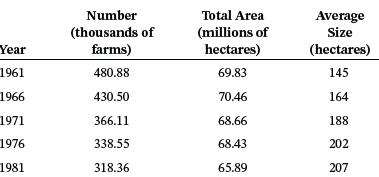
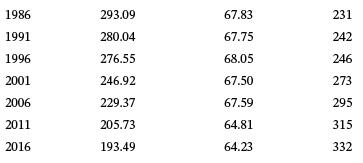
It appears that, over the past 50 years, the number of farms in Canada declined while the average size of farms (in hectares) increased. The following data show five-year interval data for Canadian farms. Use these data to develop the equation of a regression line to predict the average size of a
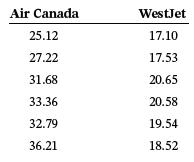
In an effort to determine whether any correlation exists between the share prices of airlines, an analyst sampled six days of activity on the stock market. Using the following share prices of Air Canada and WestJet, compute the coefficient of correlation. Share prices have been rounded off to the
Fill in the blanks.1. Descriptive statistics can be used to _____ the data to describe a data sample either numerically or graphically.2. Statistical inference is inference about a _____ from a random data _____ drawn from it.
Match the level with the correct measurement.1. Nominal a. Measures with a fixed zero that means “no quantity”; a constant interval (distance on the scale)2. Ordinal b. Measures require a fixed distance, but the zero point is arbitrary3. Interval c. Measures classified by shared
Fill in the blanks.The value halfway across the class interval (calculated as the average of the two class endpoints) is called the class __________. For each class, the individual class frequency divided by the total frequency is called the __________ frequency. Moreover, a running total of
Time-series data represent data gathered for a particular characteristic over a period of time at regular intervals. Draw the outline of a time-series graph for each of the following variables.a. Canada’s yearly CO2 emissions for a period of 20 consecutive yearsb. USD/CAD daily average exchange
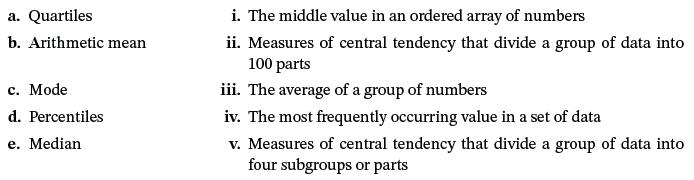
1. Match the measure of central tendency with its correct definition.2. What are the differences between the mean, median, and mode? What are the advantages and disadvantages of each measure?3. Is the arithmetic mean greatly affected by any extreme value or values? Explain.4. Can you contrive a
1. What is the first step in constructing a graph of statistical data?2. Draw the outline of a histogram for each of the following descriptions.a. A set of quiz scores where the quiz was very easyb. The last digit of the winning lottery numbers for a yearc. The average mass of a healthy adult
1. True or false? Pie charts are an effective way of displaying data if the intent is to compare the size of a slice with the whole pie, rather than comparing the slices among themselves.2. What type of chart do you think could be used to help answer the following questions?a. What are the main
Draw the outline of a scatter plot for each of the following sets of two numerical variables.a. The mass and height of 30 people selected at randomb. The mass and IQ of 30 people selected at randomc. The number of advertising dollars spent by a company and the total sales revenue
1. The more dispersed the data are, the larger the range, the interquartile range, the variance, and the standard deviation will be. True or false? Explain.2. If a set of data contains observations that are all the same, the range, the interquartile range, the variance, and the standard deviation
1. Briefly explain the following terms: experiment, elementary events, sample space.2. How would you draw a diagram to represent(a) The intersection(b) The union of two events?3. What is the difference between mutually exclusive events and independent events?4. If two events can never occur
1. How is union probability different from joint probability?2. Can joint probability ever be greater than union probability? Explain.3. How is marginal probability different from conditional probability?4. Can conditional probability ever be greater than marginal probability? Explain.
1. Under what condition can you use the special law of addition instead of the general law?2. If you apply the general law of addition where the special law may be used, would your calculations be wrong? Explain why.3. Give two examples of cases where you can use the special law of addition instead
1. Under what condition can you use the special law of multiplication instead of the general law?2. Under what conditions are the general law and the special law interchangeable?
1. Using an example, explain the difference between unconditional probability and conditional probability.2. What is the relationship between conditional probability and independent events?
Both conditional probability and Bayes’ rule incorporate in their calculations what we already know. In what way are they different?
1. Characterize the following random variables as either discrete or continuous.• The number of heads in 25 tosses of a coin• The amount of gasoline you put in your car• The duration of your phone calls• The number of phone calls you receive per day• The number of friends you run into
1. What is a discrete distribution? Can you provide a rough example based on your personal experience?2. What conditions must be satisfied by the outcome probabilities in a discrete distribution? What do these conditions mean?
1. List the key characteristics of a binomial experiment.2. Give an example of a binomial random variable. What do the values of the variable represent? How are the values of the variable defined?
1. What are the key characteristics of the Poisson distribution?2. Assume that x = 0, 1, 2, 3, . . . is a random variable that follows a Poisson distribution. What do the values of x represent?
1. What are the key characteristics of the hypergeometric distribution?2. The hypergeometric distribution applies only to experiments in which the trials are done without replacement, while the binomial distribution theoretically applies only when sampling is done with replacement. When can the
1. List two important properties of the uniform distribution.2. Describe a situation (in business or otherwise) in which the use of the uniform distribution would be appropriate. Clearly define the random variable.
1. Why is it convenient to use a normal distribution to approximate a binomial distribution? Under what conditions is this approximation appropriate?2. Explain why and how we make a continuity correction when approximating a binomial distribution with a normal distribution.
1. List four important properties of the exponential distribution.2. Can you think of a couple of real-life situations (in business or otherwise) where the use of the exponential distribution might be appropriate? Clearly define the random variable in each situation.
1. What is the basic difference between a random and a nonrandom sample?2. Suppose there are 100 students in your class. You are asked to pick four students at random. You look around and pick four students in a specific order. Is this a true random sample?3. What is the only reason for sampling
1. What do you understand by the central limit theorem and why is it relevant?2. What happens to the sample mean as you increase the sample size?3. What is a finite population? What is the finite population correction factor?
Showing 5900 - 6000
of 6217
First
49
50
51
52
53
54
55
56
57
58
59
60
61
62
63
Step by Step Answers