New Semester
Started
Get
50% OFF
Study Help!
--h --m --s
Claim Now
Question Answers
Textbooks
Find textbooks, questions and answers
Oops, something went wrong!
Change your search query and then try again
S
Books
FREE
Study Help
Expert Questions
Accounting
General Management
Mathematics
Finance
Organizational Behaviour
Law
Physics
Operating System
Management Leadership
Sociology
Programming
Marketing
Database
Computer Network
Economics
Textbooks Solutions
Accounting
Managerial Accounting
Management Leadership
Cost Accounting
Statistics
Business Law
Corporate Finance
Finance
Economics
Auditing
Tutors
Online Tutors
Find a Tutor
Hire a Tutor
Become a Tutor
AI Tutor
AI Study Planner
NEW
Sell Books
Search
Search
Sign In
Register
study help
business
business statistics in practice
Business Statistics For Contemporary Decision Making 3rd Canadian Edition Ken Black, Ignacio Castillo - Solutions
For what kind of data would you use the sampling distribution of proportions?
What is the meaning of the following terms: decision alternatives, states of nature, and payoffs?
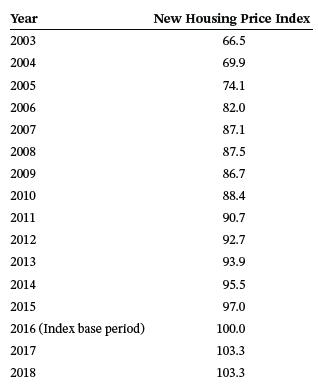
Canada’s new housing price index has been steadily increasing over the years. Given below are data for Canada’s new housing price index between 2003 and 2018. Use these data to determine the equation of a trend line for new housing price indexes. Use the trend model you developed to forecast
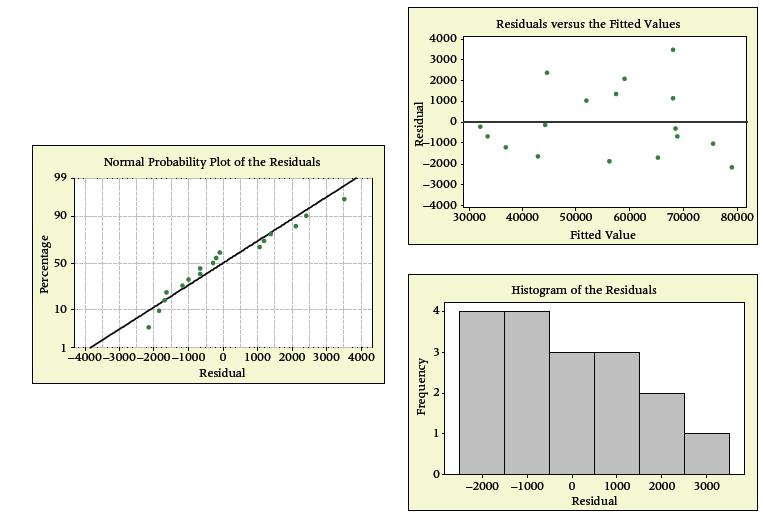
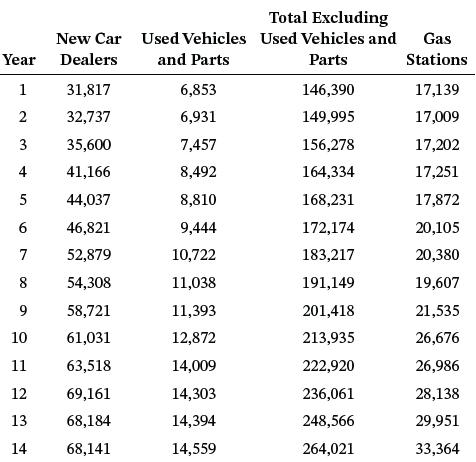
The residual diagnostics for the multiple regression analysis for the data given in Problem 13.32 follow. Discuss any potential problems with meeting the regression assumptions for this regression analysis based on the residual graphics.Data from Problem 13.32The table below shows the growth of new
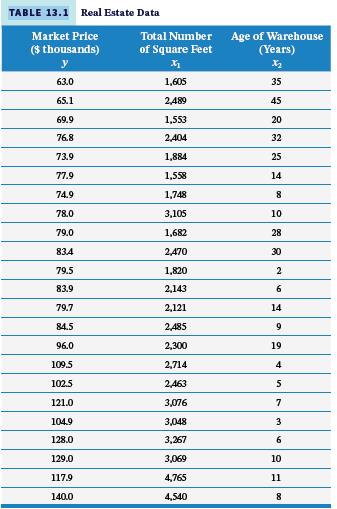
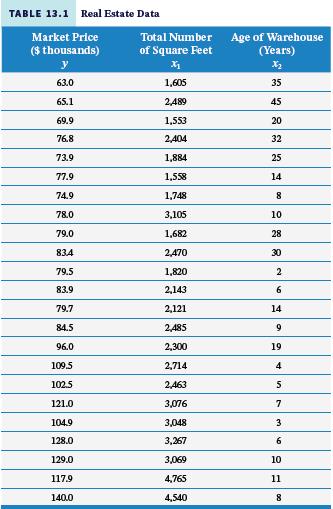
Take the first 10 observations in Table 13.1 and perform a multiple regression on these data. What is the R2? How much of this R2 can be attributed to chance?Data from table 13.1 TABLE 13.1 Real Estate Data Market Price ($
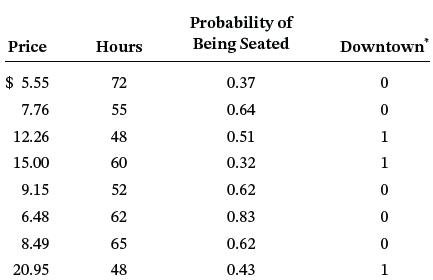
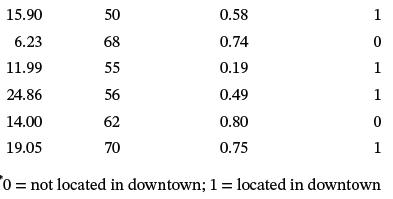
A business analyst developed a multiple regression model to predict the average price of a meal at a restaurant in a western city. After exploring several variables that might affect the average price, the analyst decides the three most important variables that decide the price of a meal are (1)
A business analyst gathered 155 observations on four variables: job satisfaction, occupation, industry, and marital status. She wants to develop a multiple regression model to predict job satisfaction by the other three variables. All three predictor variables are qualitative variables with the
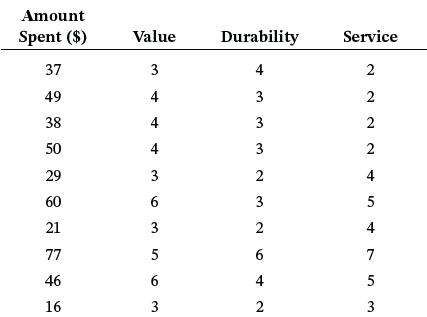
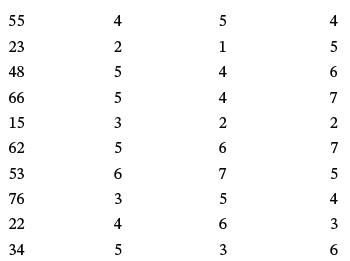
A marketing analyst carries out a survey to assess whether the amount of money a customer spends in a clothing store depends on how the customer feels about the value he receives, the perceived durability of the material, or the service provided by the retail outlet. Customers are asked to rate
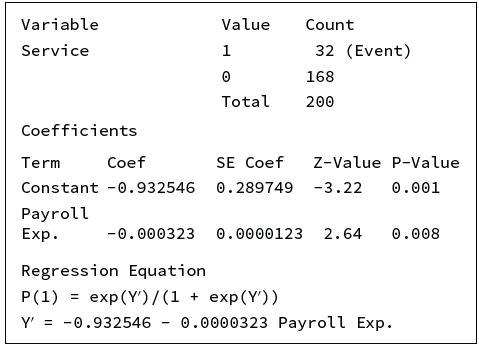
In the following output, the variable “Service” is coded 0 for general medical hospitals and 1 for psychiatric hospitals. Shown below is Minitab output from a logistic regression attempt to predict capitalize Service by payroll expenditures. Study the output. What is the model? How good is the
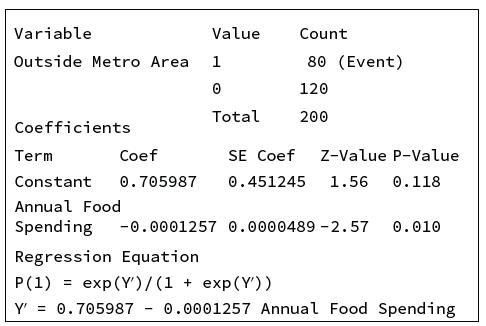
Shown below is Minitab output from a logistic regression attempt to predict if a family is from outside a metro area by annual food spending by household. Families residing in metro regions are coded as 0 and those residing outside metro regions as 1. Study the output. What is the model? Comment on
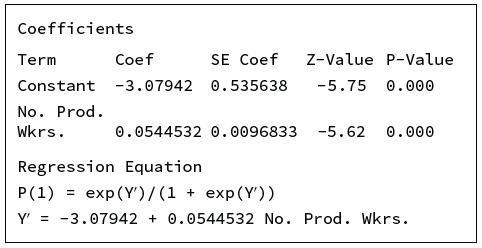
A logistic regression analysis was done in an attempt to predict the value of industrial shipments by the number of production workers. For the purposes of this analysis, Value of Industrial Shipments is coded 0 if the value is small and 1 if the value is large. The Minitab output is given below.
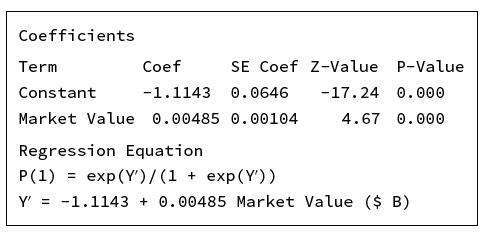
Logistic regression analysis was used to develop a model to predict if a company was a North American company based on its Market Value. A variable was coded 1 if the company headquarters was located in North America, and coded 0 if the company headquarters was outside North America. The partial
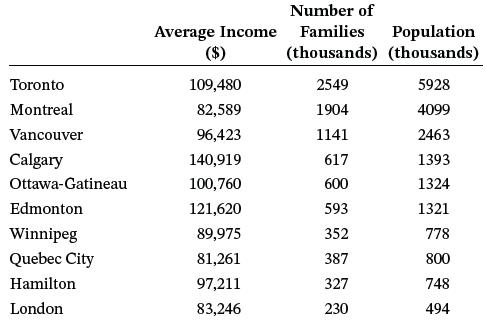
Given below are the population, number of households, and average income for 10 Canadian cities. Use the data to develop a regression model to predict average income from population and number of households. Graph each of these predictors separately with the response variable and use Tukey’s
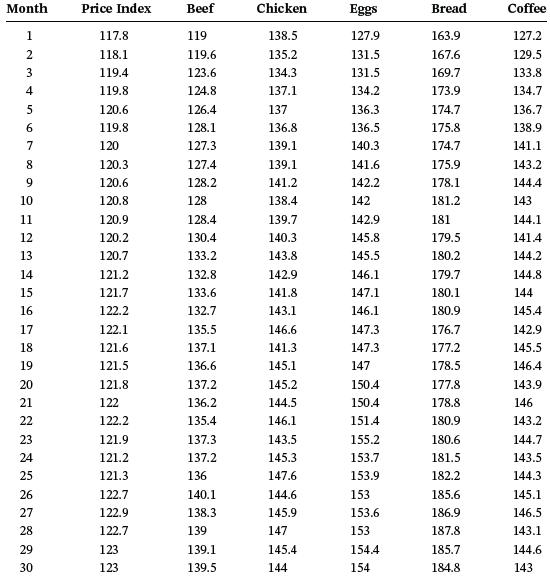
This problem includes the consumer price index for a Canadian city over a period of 30 months. Also displayed are some of the major components of the index: beef, chicken, eggs, bread, and coffee. Use these data and a stepwise regression procedure to develop a model that attempts to predict the
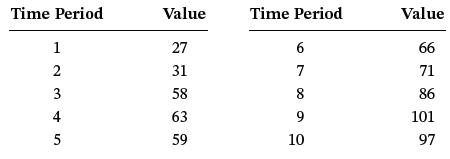
Use the following time-series data to answer the given questions.a. Develop forecasts for periods 5 through 10 using 4-month moving averages.b. Develop forecasts for periods 5 through 10 using 4-month weighted moving averages. Weight the most recent month by a factor of 4, the previous month by 2,
Determine a possible frame for conducting random sampling in each of the following studies.a. The average amount of overtime per week for production workers in a plastics company in Manitobab. The average number of employees in all Safeway supermarkets in British Columbiac. A survey of commercial
A particular automobile costs an average of $21,755 in British Columbia. The standard deviation of prices is $650. Suppose a random sample of 30 dealerships in Vancouver and Victoria is taken, and their managers are asked what they charge for this automobile. What is the probability of getting a
Suppose the average client charge per hour for out-of-court work by lawyers in Saskatchewan is $125. Suppose further that a random telephone sample of 32 lawyers in Saskatchewan is taken and that the sample average charge per hour for out-of-court work is $110. If the population variance is $525,
A survey of 2,645 consumers by DDB Needham Worldwide showed that how a company handles a crisis when at fault is one of the top influences in consumer buying decisions, with 73% claiming it is an influence. Quality of product was the number one influence, with 96% of consumers stating that quality
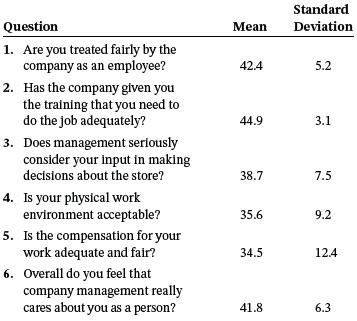
Suppose you are sending out questionnaires to a randomly selected sample of 100 managers. The frame for this study is the membership list of the Board of Trade. The questionnaire contains demographic questions about the company and its top manager. In addition, it asks questions about the
A business analyst is conducting a study of Loblaw supermarkets across the country. How can she use cluster or area sampling to take a random sample of employees of this firm?
A directory of personal computer retail outlets in Canada contains 12,080 alphabetized entries. Explain how systematic sampling could be used to select a sample of 300 outlets.
The average rent of a one-bedroom apartment in a town is $850 per month. What is the probability of randomly selecting a sample of 50 one-bedroom apartments in this town and getting a sample mean of less than $830 if the population standard deviation is $100?
According to the International Atomic Energy Agency, electricity per-capita consumption in Canada was 16,621 kWh in 2016.5 A random sample of 51 households was monitored for one year to determine electricity usage. If the population standard deviation of annual usage is 3,500 kWh, what is the
Marketing companies are turning to mobile media for new opportunities. A recent study by IBM showed that 46% of all marketers conduct transactions on mobile websites. Suppose a random sample of 300 marketing companies is taken.a. What is the probability that between 114 and 153 (inclusive)
In a particular area in the Prairies, an estimated 75% of the homes use heating oil as the principal heating fuel during the winter. A random telephone survey of 150 homes is taken in an attempt to determine whether this figure is correct. Suppose 120 of the 150 homes surveyed use heating oil as
According to Statistics Canada, the average hourly wages in the manufacturing sector are as follows: Alberta: $26.50, Ontario: $24.69, British Columbia: $26.47.6 Suppose 40 workers are selected randomly from across Alberta and asked what their hourly wage is. What is the probability that the sample
Give a variable that could be used to stratify the population for each of the following studies. List at least four subcategories for each variable.a. A political party wants to conduct a poll prior to an election for the premier of New Brunswickb. A soft drink company wants to take a sample of
A survey shows that a typical business traveller spends an average of $280 per day in Toronto. This cost includes hotel, meals, car rental, and incidentals. A survey of 60 randomly selected business travellers who have been to Toronto on business recently is taken. For the population mean of $280
1. Explain why it is important to calculate the confidence interval in addition to calculating the point estimate of a population parameter.2. Explain what being 95% confident that the population mean is in an interval actually indicates.3. An increase in the level of confidence will result in a
Use the following information to construct the confidence intervals specified to estimate μ.a. 95% confidence for x̄ = 25, σ = 3.5, and n = 60b. 98% confidence for x̄ = 119.6, σ = 23.89, and n = 75c. 90% confidence for x̄ = 3.419, σ = 0.974, and n = 32d. 80% confidence for x̄ = 56.7, σ =
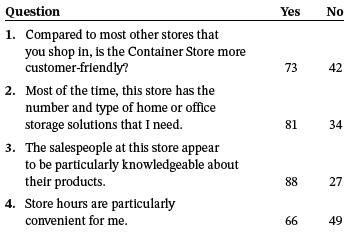
In the late 1970s, Kip Tindell (chairman and CEO), Garrett Boone (chairman emeritus), and John Mullen (architect) drew up plans with products that were devoted to simplifying people’s lives, such as commercial parts bins, wire drawers, mailboxes, milk crates, wire leaf burners, and many others.
1. When is it appropriate to use the confidence interval based on the t distribution for the population mean?2. List two important properties of the t distribution.3. What is the behaviour of tα and tα/2 as the number of degrees of freedom describing a t distribution increases?
1. Provide a couple of business examples where the confidence interval of the population proportion might be useful.2. Explain how the standard error of the population proportion behaves as the sample size n increases.
Why is it that some business analysts do not include the technique presented in this section for estimating the population variance among their statistical repertoire?
1. When calculating the sample size for estimating the population mean or the population proportion, is there ever a need to take a preliminary sample? Why?2. Should we always round up the calculated sample size n for both the population mean and the population proportion? Why or why not?3. Why is
A&W is one of the most recognizable and popular brand names. The company opened its first drive-in restaurant in Canada in Winnipeg in 1956 and now has over 950 locations from Vancouver Island to Newfoundland. Over the years the format of the restaurants has changed, from drive-ins, where wait
1. The null hypothesis is denoted by __________, while the alternative hypothesis is denoted by __________.2. Explain what rejection and nonrejection regions are and how they relate to hypothesis testing.3. What is the relationship of α to the Type I error? What is the relationship of β to the
1. Explain what a p-value is and how it is used in hypothesis testing.2. Explain how a p-value relates to the rejection and nonrejection regions in hypothesis testing.
1. Even if σ is unknown, what is the assumption about the probability distribution of the population for the measurement being studied?2. Under what conditions should we use a z test or a t test when testing hypotheses about a population mean?
Are the conclusions from a hypothesis test about a variance useful and reliable if the population for the measurement being studied is not normally distributed?
1. What is an operating characteristic (OC) curve?2. What is a power curve?3. What is the relationship between sample size and the location of the rejection limits?
Seitz LLC, an ISO 9001-2008 certified organization, is a leading designer and manufacturer of thermoplastic motion control systems and components and an industry leader in plastics and gear trains. Founded in 1949 by the late Karl F. Seitz, the company began as a small tool-making business and grew
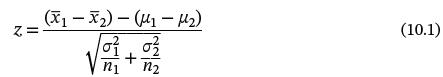
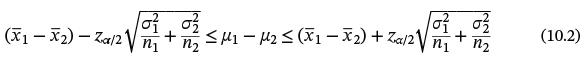
1. The sampling plan calls for selecting two independent samples in order to use Formulas 10.1 and 10.2 to estimate the difference in two means. Explain in your own words what it means for the two samples to be independent. 2. Explain in your own words the relationship between a hypothesis test
1. Under what conditions should we use a z formula when dealing with the difference in two means? A t formula?2. Are the conclusions from this section useful and reliable if the populations for the measurements being studied are not normally distributed?3. What is the key difference between the t
1. Provide a few examples of situations in which the two samples being studied are related or dependent.2. Explain how data collection for dependent samples differs from data collection for independent samples.3. When dealing with statistical inferences for two related populations, what is the key
1. Is the F test of two population variances extremely sensitive to violations of the assumption that the populations are normally distributed? What is the key implication of this?2. Explain why we cannot merely place a minus sign on the upper-tail critical value and obtain the lower-tail critical
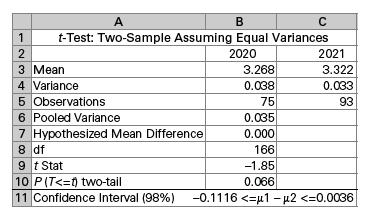
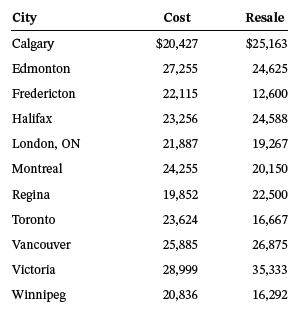
Because of uncertainty in real estate markets, many homeowners are considering remodelling and constructing additions rather than selling. Probably the most expensive room in the house to remodel is the kitchen. In terms of resale value, is remodelling the kitchen worth the cost? Assume that the
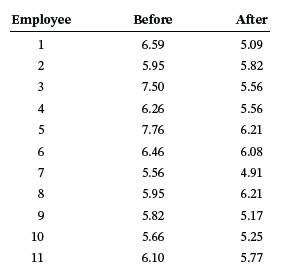
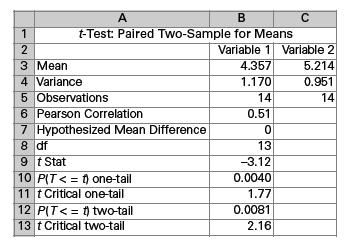
Eleven employees were put under the care of the company nurse because of high cholesterol readings. The nurse lectured them on the dangers of this condition and put them on a new diet. Shown are the cholesterol readings in millimoles per litre (mmol/L) of the 11 employees both before the new diet
Is there a significant difference in the fuel efficiency of a car for regular unleaded and premium unleaded gas? To test this hypothesis, an analyst randomly selected 15 drivers for a study. They were to drive their cars for one month on regular unleaded and for one month on premium unleaded gas.
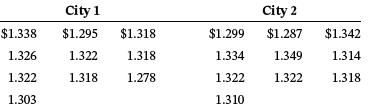
Suppose the data shown here are the results of a survey to investigate gas prices. Ten service stations were selected randomly in each of two cities and the figures represent the prices of a litre of unleaded regular gas on a given day. Use the F test to determine whether there is a significant
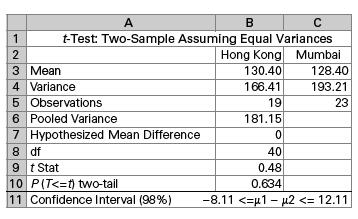
Suppose a recent study showed that the average annual amount spent by a Nova Scotia household on hotdog wieners was $23.84 compared with an average of $19.83 for Alberta households. Suppose a random sample of 12 Nova Scotia households showed that the standard deviation of these purchases was $7.52,
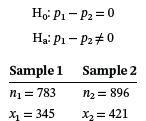
Test the following hypotheses by using the given data. Let α equal 0.05. Ho: P₁-P₂ = 0 Ha: P1 - P20 Sample 1 n₁ = 783 x₂ = 345 Sample 2 n₂ = 896 x₂ = 421
A study was conducted to compare the salaries of accounting clerks and data entry operators. One of the hypotheses to be tested is that the variability of salaries among accounting clerks is the same as the variability of salaries of data entry operators. To test this hypothesis, a random sample of
A national grocery store chain wants to test the difference in the average mass of turkeys sold in Guelph, Ontario, and the average mass of turkeys sold in Sudbury, Ontario. According to the chain’s analyst, a random sample of 20 turkeys sold at the chain’s stores in Guelph yielded a sample
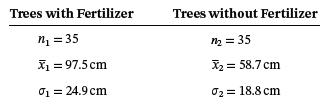
A tree nursery has been experimenting with fertilizer to increase the growth of seedlings. A sample of 35 two-year-old pine trees is grown for three more years with a cake of fertilizer buried in the soil near the trees’ roots. A second sample of 35 two-year-old pine trees is grown for three more
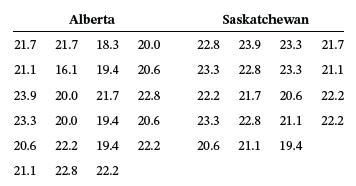
As the prices of heating oil and natural gas increase, consumers become more careful about heating their homes. Analysts want to know how warm homeowners keep their houses in January and how the results from Alberta and Saskatchewan compare. The analysts randomly called 23 Alberta households
A study by Colliers International presented the highest and the lowest global rental rates (in U.S. dollars) per year per square foot of office space. Among the cities with the lowest rates were Perth, Australia; Edmonton; and Calgary, with rates of $8.81, $9.55, and $9.69, respectively. At the
Why do employees blow the whistle on other employees for unethical or illegal behaviour? One study conducted by the American Institute of Certified Public Accountants (AICPA) reported the likelihood that employees would blow the whistle on another employee for such things as unsafe working
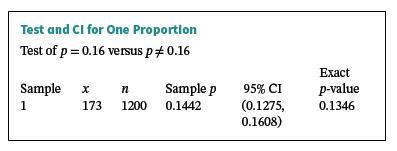
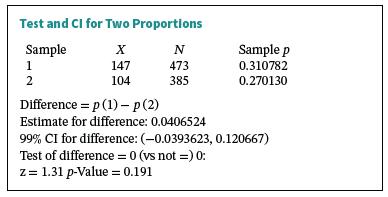
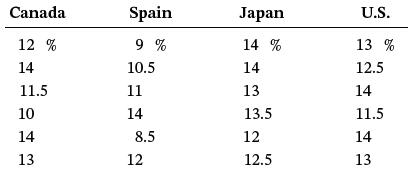
A large manufacturing company produces computer printers that are distributed and sold all over Canada. Due to lack of industry information, the company has a difficult time ascertaining its market share in different parts of the country. It hires a market research firm to estimate its market share
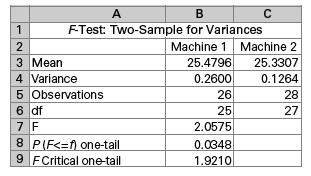
A manufacturing company produces plastic pipes that are specified to be 25 cm long and 0.3 cm thick with an opening of 1.9 cm. These pipes are moulded on two different machines. To maintain consistency, the company periodically randomly selects pipes for testing. In one specific test, pipes were
1. Explain in your own words the meaning of an experimental design.2. Define the terms treatment variable, classification variable, factor, level, and dependent variable.
Some Toronto Stock Exchange analysts believe that 24-hour trading on the stock exchange is the wave of the future. As an initial test of this idea, assume that the Toronto Stock Exchange will open for two after-hours “crossing sections” and the results of these extra-hour sessions will be
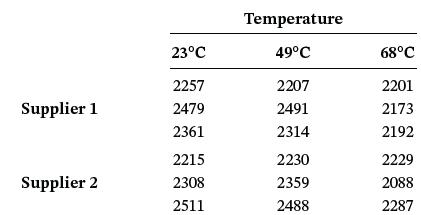
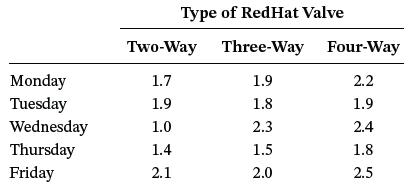
With headquarters located in Brantford, Ontario, ASCO Valve Canada is one of Canada’s top producers of solenoid valves. The company was founded in 1965, and since that time it has emerged as a successful industrial company that currently employs more than 75 people across Canada. ASCO offers an
1. Explain the difference between the treatment variation and the error variation.2. What are the three assumptions that underlie analysis of variance?3. How is the F value conceptually defined in the analysis of variance situation?
WestJet Airlines is able to keep fares low in part because of relatively low maintenance costs on its airplanes. One of the main reasons for the low maintenance costs is that WestJet flies mainly one type of aircraft, the Boeing 737. However, WestJet flies three different versions of the 737.
1. Explain why we conduct multiple comparison tests between groups.2. What can be done to handle multiple comparison tests when the sample sizes are unequal?
1. Explain in your own words what a blocking variable is.2. Consider Problem 11.12. Provide three examples of blocking variables that can be used for that particular experiment.Data from problem 11.12That the starting salaries of new accounting graduates would differ according to geographic regions
Is there a difference in the family demographics of people who stay at hotels? Suppose a study is conducted in which three categories of hotels are used: economy hotels, modestly priced chain hotels, and exclusive hotels. One of the dependent variables studied might be the number of children in the
1. When are factorial designs used?2. Describe a business research situation where a factorial design application is possible.3. Draw a 2 × 3 factorial design graph where interaction is present. What do we mean when we say that interaction does exist?4. Draw a 2 × 3 factorial design graph where
Determine the value of the correlation coefficient, r, for the following data. c 4 6 У 18 12 7 11 14 13 8 7 17 7 21 4
In statistics, the phrase “correlation does not imply causation” is used to emphasize that correlation between two variables does not automatically imply that one causes the other. Can you think of two variables (in the world of business or otherwise) that are correlated, yet one does not cause
1. What is regression analysis?2. You know the price and sales history of a product. You need to predict the effect of next year’s price on sales. Do you think regression analysis is the right technique to use? Explain.
1. What does slope mean in regression analysis?2. What does intercept mean in regression analysis?
1. What are residuals in regression analysis?2. Why is it important to analyze the residuals?3. How would you identify nonlinear residuals?4. How would you identify heteroscedasticity using residuals?5. How would you identify non independent error terms using residuals?
1. What does the standard error of the estimate mean in regression analysis?2. Does the standard error of the estimate tell us anything about the predictive accuracy of the regression model? Explain your answer.
1. What is the coefficient of determination?2. How would you interpret a given value of the coefficient of determination?
Why should you check the slope and the overall model before using the sample regression model you have developed?
1. What is a confidence interval?2. A regression equation gives the value of y given the value of x. Do we then need to construct a confidence interval around predicted values?
How would you use regression analysis to predict future values? What type of data is used for this purpose?
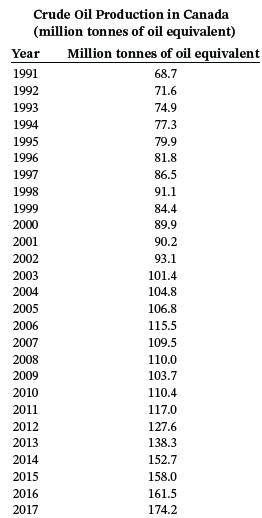
Given below is the crude oil production (million tonnes of oil equivalent) in Canada between 1991 and 2017. Use these time-series data to develop an autoregression model with a one-period lag. Now try an autoregression model with a two-period lag. Discuss the results and compare the two models.
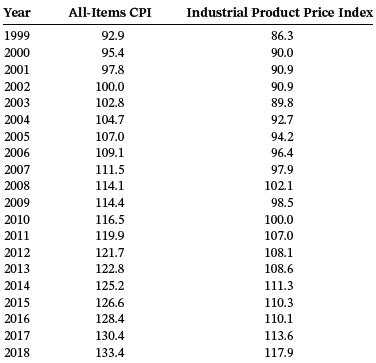
Given below are the Canadian Industrial Product Price Index and the Consumer Price Index (CPI) for the years 1999 to 2018. Use these data to develop a simple regression forecasting model that attempts to predict CPI from Industrial Product Price Index. Compute a Durbin-Watson statistic for this
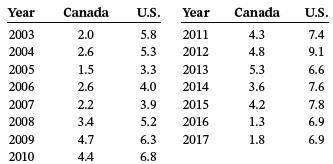
The following table shows the percentage household savings rates in Canada and in the U.S. from 2003 to 2017. Use these data to develop a linear regression model to forecast the percentage change in the Canadian savings rate by the percentage change in the U.S. savings rate. Compute a Durbin-Watson
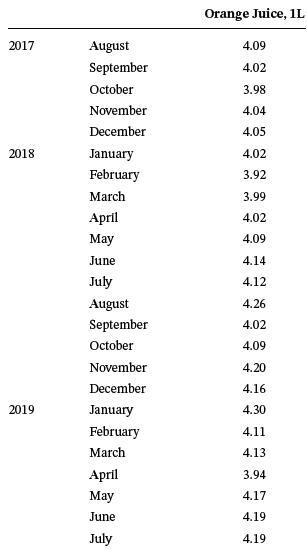
Given below are the monthly prices of orange juice for 24 months. Use these data to compute 12-month centred moving averages (T·C). Using these computed values, determine the seasonal effects (S·I).
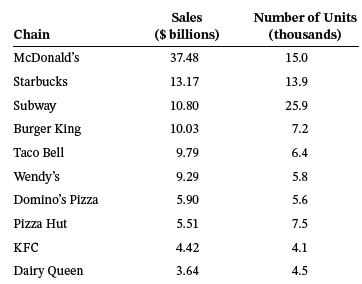
It seems logical that restaurant chains with more units (restaurants) would have greater sales. This assumption is mitigated, however, by several possibilities: some units may be more profitable than others, some units may be larger, some units may serve more meals, some units may serve more
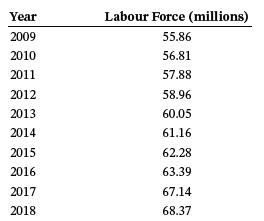
Shown here are the labour force figures (in millions) for the country of Bangladesh over a 10-year period published by the World Bank. Develop the equation of a trend line through these data and use the equation to predict the labour force of Bangladesh for the year 2021.
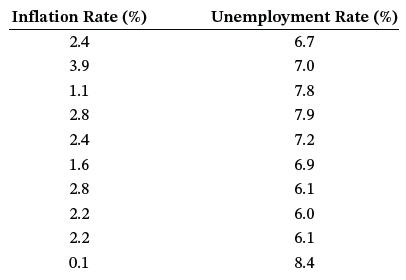
How strong is the correlation between the inflation rate and the unemployment rate? The following data are given as pairs of inflation rates and unemployment rates for the month of May for 10 recent years. Inflation Rate (%) 2.4 3.9 1.1 2.8 2.4 1.6 2.8 2.2 2.2 0.1 Unemployment Rate
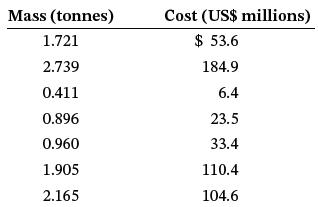
People in the aerospace industry believe the cost of a space project is a function of the mass of the major object being sent into space. Use the following data to develop a regression model to predict the cost of a space project by the mass of the space object. Determine r 2 and se. Mass
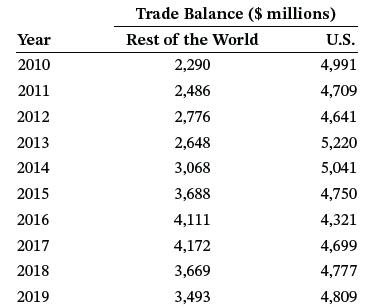
Canada’s trade balance with the rest of the world has been steadily increasing over the past several years. It is well known that the U.S. is Canada’s leading trade partner. Is there a predictable linear relationship between our total trade balance and our trade balance with the U.S.? Develop a
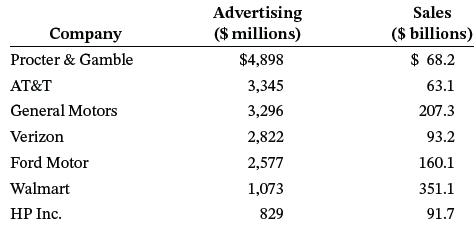
Is the amount of money spent by companies on advertising a function of the total sales of the company? Shown are sales income and advertising cost data for seven companies, published by Advertising Age.Use the data to develop a regression line to predict the amount of advertising by sales. Compute
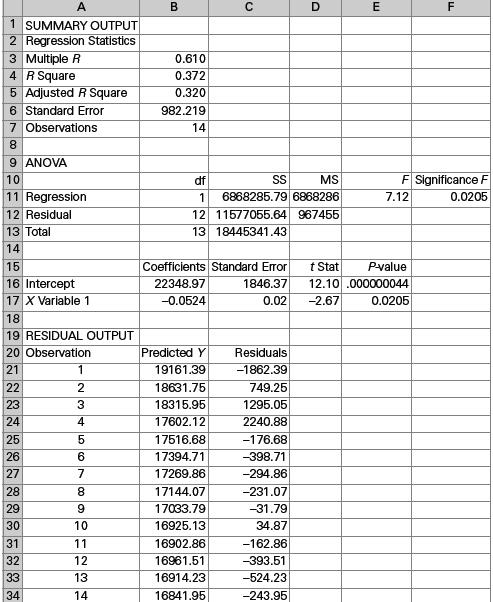
Study the following Excel regression output for an analysis attempting to predict the number of union members by the size of the labour force for selected years over a 30-year period. Analyze the computer output. Discuss the strength of the model in terms of the proportion of variation accounted
1. What is the difference between simple regression analysis and multiple regression analysis?2. What is a partial regression coefficient and how is it different from a full regression coefficient?3. How would you interpret the partial regression coefficient?
Why is it important to test the multiple regression model once it is developed? What would you test it for?
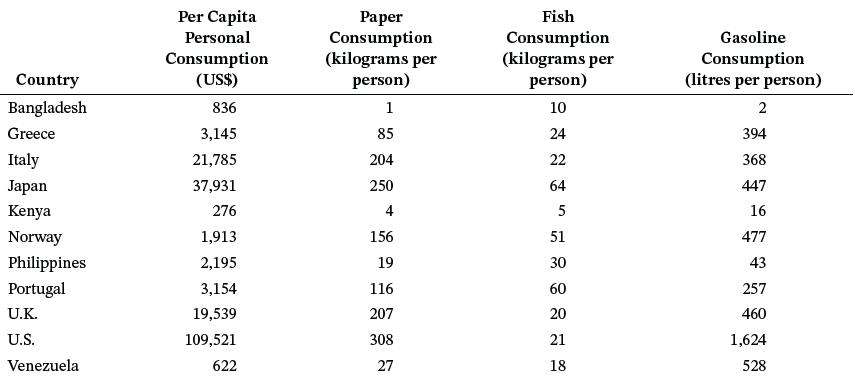
Is there a particular product that is an indicator of per capita personal consumption for countries around the world? Shown below are data on per capita personal consumption, paper consumption, fish consumption, and gasoline consumption for 11 countries. Use the data to develop a multiple
1. What are residuals?2. Describe what you can learn by analyzing the residuals.3. Explain the term standard error of the estimate.4. What is the coefficient of determination and what does it tell us?5. What is the difference between R2 and adjusted R2?
What can we learn from the ANOVA table in a multiple regression analysis output?
1. What are influential observations? How do influential observations potentially affect the regression equation?2. Suppose you are given a multiple regression equation to predict the inflation rate in Canada, based on the data between the years 2006 and 2019. Can you use this equation to predict
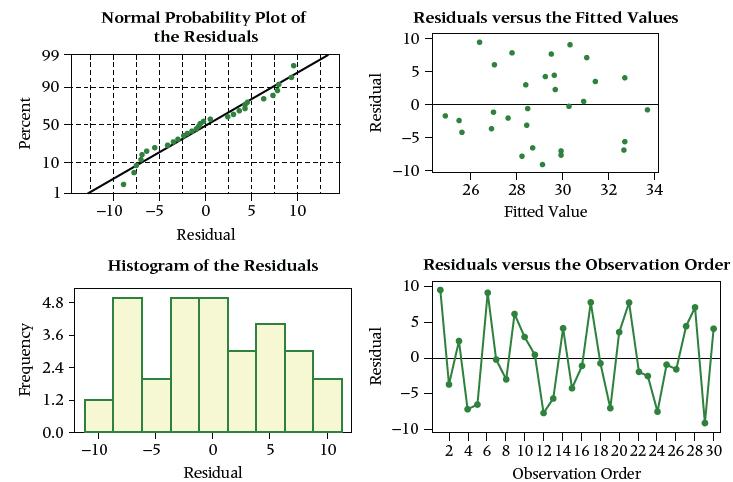
Study the residual diagnostics that follow. Discuss any potential problems with meeting the regression assumptions for this regression analysis based on the residual graphics. Percent Frequency 99 90 50 10 4.8 3.6 2.4 1.2 0.0 Normal Probability Plot of the Residuals TII -10 -5 0 5
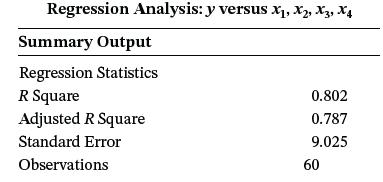
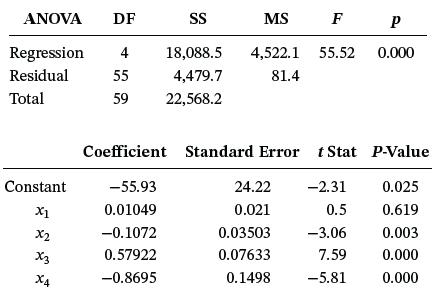
Study the regression output that follows. How many predictors are there? What is the equation of the regression model? Using the key statistics discussed in this chapter, discuss the strength of the model and the predictors. Regression Analysis: y versus x1, X2, X3, X4 Summary Output Regression
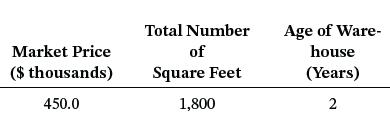
To Table 13.1 add one more observation that happens to be a custom-built property, priced dissimilarly to other properties:Recalculate the regression equation. How did the regression model change?Data from table 13.1 Market Price ($ thousands) 450.0 Total Number of Square Feet 1,800 Age of
Showing 6000 - 6100
of 6217
First
49
50
51
52
53
54
55
56
57
58
59
60
61
62
63
Step by Step Answers