New Semester
Started
Get
50% OFF
Study Help!
--h --m --s
Claim Now
Question Answers
Textbooks
Find textbooks, questions and answers
Oops, something went wrong!
Change your search query and then try again
S
Books
FREE
Study Help
Expert Questions
Accounting
General Management
Mathematics
Finance
Organizational Behaviour
Law
Physics
Operating System
Management Leadership
Sociology
Programming
Marketing
Database
Computer Network
Economics
Textbooks Solutions
Accounting
Managerial Accounting
Management Leadership
Cost Accounting
Statistics
Business Law
Corporate Finance
Finance
Economics
Auditing
Tutors
Online Tutors
Find a Tutor
Hire a Tutor
Become a Tutor
AI Tutor
AI Study Planner
NEW
Sell Books
Search
Search
Sign In
Register
study help
business
business statistics in practice
Business Statistics For Contemporary Decision Making 3rd Canadian Edition Ken Black, Ignacio Castillo - Solutions
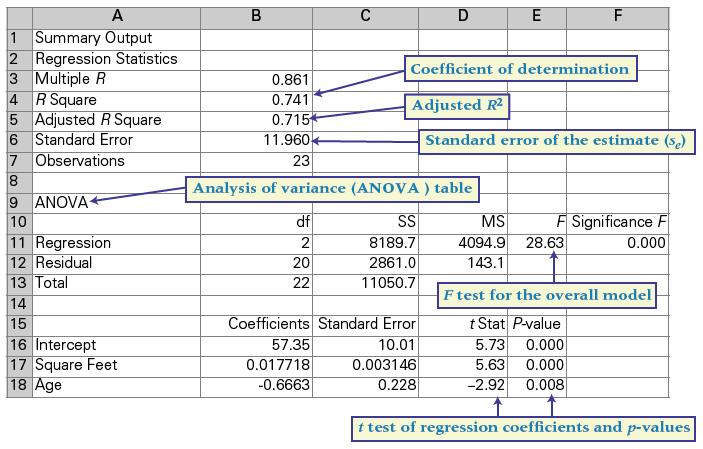
In Figure 13.5, the coefficient of determination (R2) is determined to be 0.741. Given that it is based on a sample size of 23, what R2 would you expect, even when there is no relationship between the dependent and independent variables?Data from Figure 13.5 A 1 Summary Output 2 Regression
Assume that you get a coefficient of determination of 0.741, based on a sample size of 23, as shown in Figure 13.5. Further assume that the regression was based on 10 predictor variables. Given that there are 10 predictors as opposed to just 2, what R2 would you expect to get by pure chance even
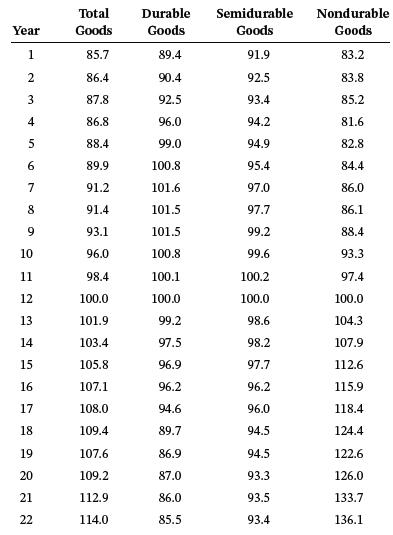
Statistics Canada produces consumer price indexes for several different categories. Shown here are the percentage changes in consumer price indexes over a period of 22 years for durable goods, semidurable goods, and nondurable goods. Also displayed are the percentage changes in the total goods
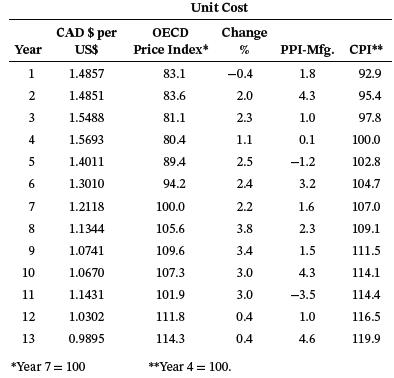
The table on the next page shows Canada’s exchange rate for US$1 for a 13-year period. Use these data and multiple regression analysis to predict the exchange rate from the different variables like price index in relation to OECD (Organisation for EconomicCo-operation and Development) countries,
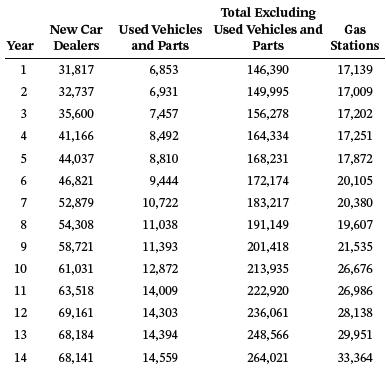
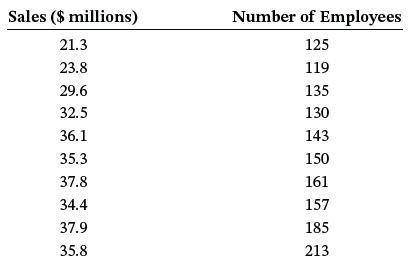
The table below shows the growth of new car dealers over a 17-year period. Use the data to predict the number of new car dealers on the basis of the amount spent on used vehicles and parts, total excluding vehicles and parts, and gasoline stations. Discuss the results, highlighting both the
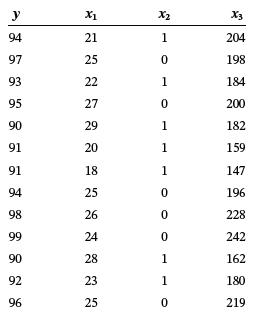
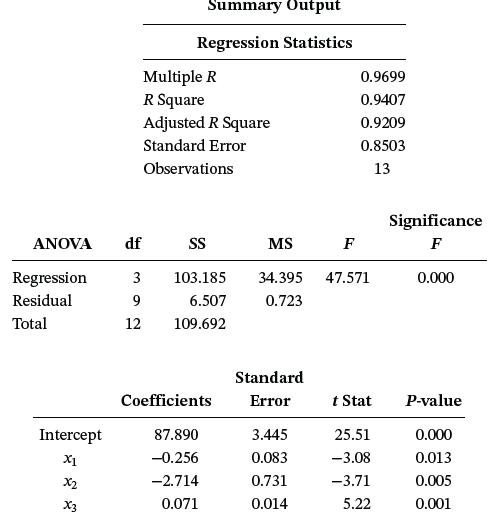
Shown here are the data for y and three predictors, x1, x2, and x3. A multiple regression analysis has been done on these data. Comment on the outcome of the analysis in light of the data.
Suppose you develop a multiple regression based on 10 years of data to predict the export volume in Canada using six independent variables. You get an R2 of 0.5. How confident would you be that this relationship is not due to chance?
Ceapro is an Edmonton-based biotechnology company known for turning oats into beneficial products. Ceapro is the world’s only commercial manufacturer of avenanthramides, a group of therapeutic molecules found exclusively in oats. Its clients use avenanthramides as ingredients in cosmetics and
1. What are first-order models and how are they different from second-order models?2. What is a quadratic model?3. In what context would you use the ladder of transformation?4. What is Tukey’s four-quadrant approach? When is it useful?
1. What is an indicator or a dummy variable? Give three examples.2. How would you code a dummy variable with three categories?
1. What does the term search procedures mean in regression analysis?2. Name some commonly used search procedures in regression analysis and briefly describe them.
1. What is multicollinearity and why is it a problem?2. What procedures would you use to detect multicollinearity?
1. What kinds of situations call for the use of logistic regression?2. List three ways in which logistic regression differs from multiple regression.3. What is the main difference between simple linear regression and logistic regression?4. What is an “odds ratio”?
Dofasco Inc. was founded in 1912 in Hamilton, Ontario, by Clifton W. Sherman. Dofasco provides steel to various industries, including the automotive and pipe industries, and today is considered one of Canada’s leading steel makers. Originally, its strategy was based on producing as much steel as
1. What is a time series? Would you say that data collected at random intervals over a number of years may be called a time series? Why or why not?2. What are the four components of time-series data? Do all time-series data have all four components?3. Name two methods of measuring forecasting
1. What are smoothing techniques and when would you use them?2. What is the basic assumption behind naive forecasting models?3. Describe the differences between simple averages, moving averages, and weighted moving averages.4. Exponential smoothing is a form of weighted average. How is weighting
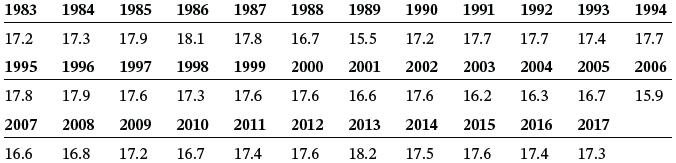
Shown here is the contribution of renewables to energy supply in Canada, shown as a percentage of the total primary energy supply. Use these data to develop an autoregression forecasting model with a two-period lag. Discuss the results of this analysis. 1983 1984 1985 1986 1987 1988 1989
1. When you use linear regression to do trend analysis, what is the independent variable?2. How do quadratic models differ from linear models in regression analysis?
1. What are seasonal effects?2. What is the main technique used to isolate seasonality?
1. What is autocorrelation and why does it pose a problem in regression analysis?2. What statistic is commonly used to measure autocorrelation?3. Name and describe two methods by which you can overcome the autocorrelation problem.4. Autocorrelation can be a problem in trend analysis. What about
1. Why are index numbers necessary? Why can’t we compare raw numbers directly with each other?2. How do unweighted aggregate price index numbers differ from weighted aggregate price index numbers?3. Why do weighted aggregate price index numbers provide a more realistic picture than unweighted
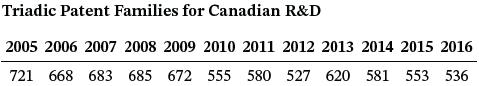
Following are the numbers of patents issued for Canadian research and development (R&D) by three sources: Japan Patent Office, European Patent Office, and the U.S. Patent and Trademark Office (Triadic Patent Families). Using these data and a base year of 2005, determine the simple index numbers
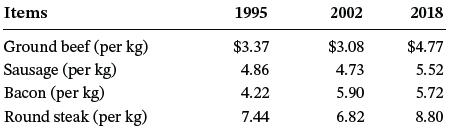
Using the data that follow, compute the aggregate index numbers for prices of the four types of meat. Let 1995 be the base year for this market basket of goods. Items Ground beef (per kg) Sausage (per kg) Bacon (per kg) Round steak (per
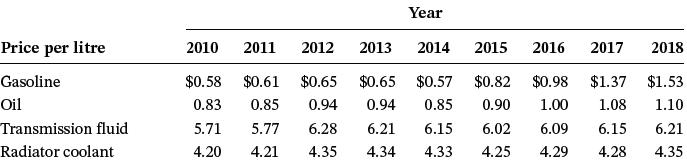
Suppose the following data are prices of market goods involved in household transportation for the years 2010 through 2018. Using 2012 as a base year, compute aggregate transportation price indexes for this data. Price per litre Gasoline Oil Transmission fluid Radiator coolant Year 2010 2011 2012
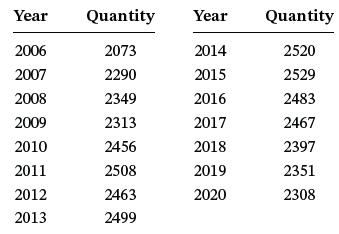
Compute index numbers for the following data using 2006 as the base year. Year 2006 2007 2008 2009 2010 2011 2012 2013 Quantity 2073 2290 2349 2313 2456 2508 2463 2499 Year 2014 2015 2016 2017 2018 2019 2020 Quantity 2520 2529 2483 2467 2397 2351 2308
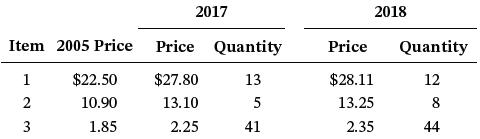
Calculate Paasche price indexes for 2017 and 2018 using the following data and 2005 as the base year. Item 2005 Price 1 2 3 $22.50 10.90 1.85 2017 Price Quantity $27.80 13 13.10 5 2.25 41 2018 Price Quantity $28.11 12 13.25 8 2.35 44
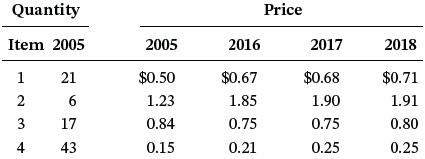
Calculate Laspeyres price indexes for 2016 to 2018 from the following data. Use 2005 as the base year. Quantity Item 2005 1 21 6 234 2 3 17 4 43 2005 $0.50 1.23 0.84 0.15 2016 $0.67 1.85 0.75 0.21 Price 2017 $0.68 1.90 0.75 0.25 2018 $0.71 1.91 0.80 0.25
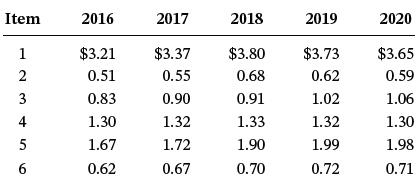
Compute unweighted aggregate price index numbers for each of the given years, using 2016 as the base year. Item 2016 $3.21 0.51 0.83 1.30 1.67 0.62 1234 2 5 6 2017 $3.37 0.55 0.90 1.32 1.72 0.67 2018 2019 $3.80
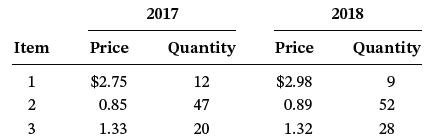
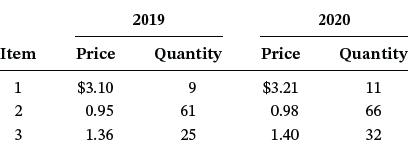
Using the following data and 2017 as the base year, compute the Laspeyres price index for 2019 and the Paasche price index for 2020. Item 1 2 3 لنا Price $2.75 0.85 1.33 2017 Quantity 12 47 20 Price $2.98 0.89 1.32 2018 Quantity 9 52 28
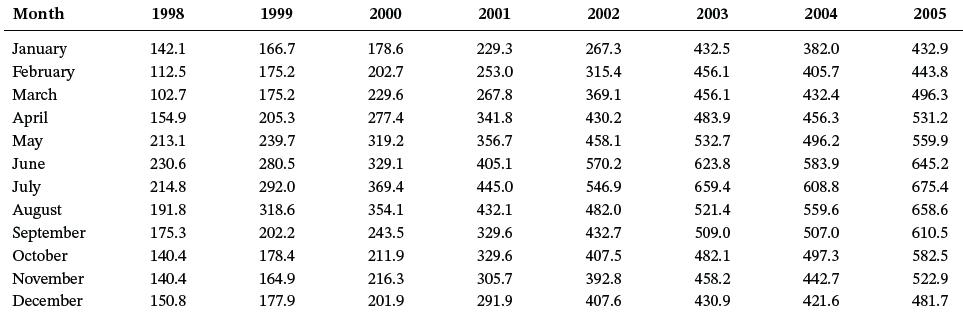
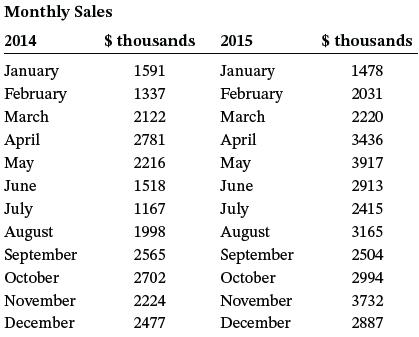
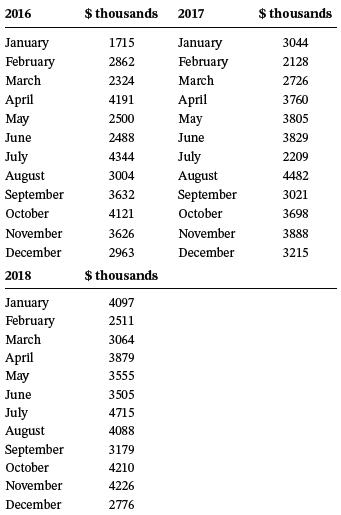
Given below are the sales (in $ thousands) of a regional department store in Canada, monthly from January 2014 through December 2018. Use time-series decomposition methods to develop the seasonal indexes for these data. Monthly
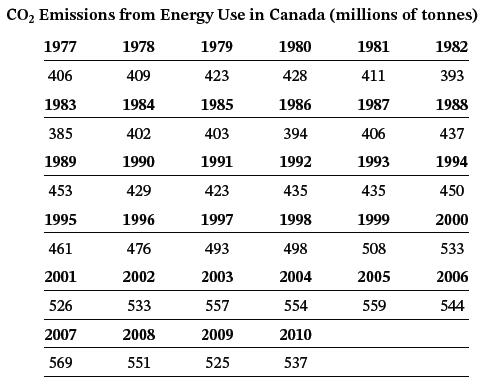
The following table contains the annual data for carbon dioxide (CO2) emissions in Canada over a 34-year period as published by the OECD.a. Use a 3-year moving average to forecast the CO2 emissions for the years 1980 through 2010 for these data. Compute the error of each forecast and then determine
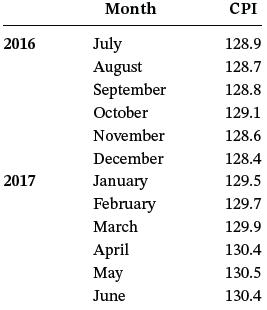
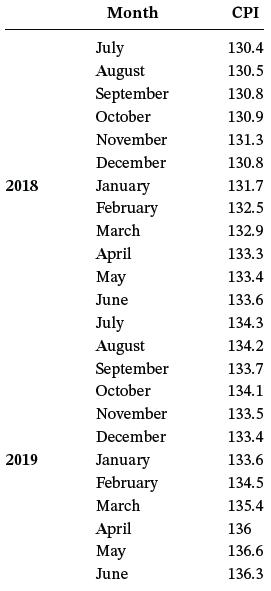
Shown here are the Canadian total monthly consumer price index (CPI) values for July 2016 through June 2019. Use the data to answer the following questions.a. Compute the 4-month moving average to forecast the CPI from November 2016 to June 2019.b. Compute the 4-month weighted moving average to
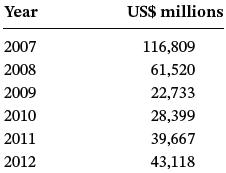
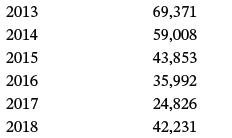
The OECD publishes data on inflows of foreign direct investments in different countries, including Canada, for which data are given below. Use these data to develop an autoregression model with a 1-period lag. Discuss the strength of the model. Year 2007 2008 2009 2010 2011 2012 US$
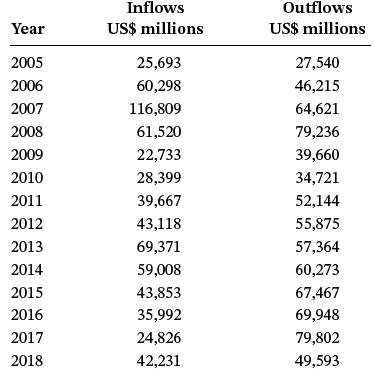
The data shown here, from the OECD, show the inflows and outflows of foreign direct investments in Canada. Use these data to develop a regression model to forecast the foreign inflows by foreign outflows. Conduct a Durbin-Watson test on the data and the regression model to determine whether
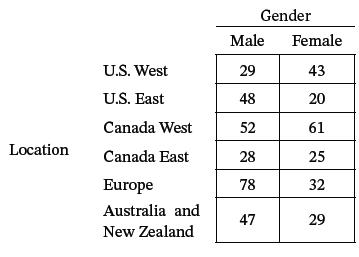
Foot Locker, Inc., is the world’s number one retailer of athletic footwear and apparel. Headquartered in New York City, the company has over 32,175 employees and 3,310 retail stores in 27 countries across North America, Europe, Asia, Australia, and New Zealand operating under such brand names as
1. A national drugstore chain would use the chi-square goodness-of-fit test for a particular product category to determine which of the following?a. Whether sales follow a uniform distribution throughout Canada.b. Whether observed sales revenues matched expected sales revenues.c. Whether
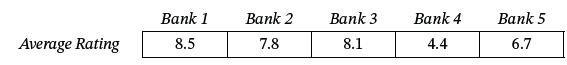
1. Under what conditions would you consider using chi-square tests?a. The data are in a categorical form.b. The data are ranked.c. The data are continuous.d. The type of data is not relevant.2. An analyst asks 1,000 consumers across Canada to rate five major banks on a 10-point scale of
A study was conducted to assess the magnitude of business that Canadian border retailers were doing with U.S. residents. Forty-one shoppers in border city department stores were interviewed; 24 were U.S. residents, and the rest were Canadian residents. Thirty-five discount store shoppers were
A study found that the average workweek is getting longer for U.S. full-time workers. Forty-three percent of the responding workers in the survey cited “more work, more business” as the reason for this increase in workweek, 37% of the workers named insufficient number of workers to get the work
According to a recent survey, 40% of luxury car manufacturers, 12% of sports car makers, and 48% of economy auto manufacturers were planning to spend more on marketing in a certain year than in previous years. Suppose a business analyst conducts her own survey. She randomly selects 280 companies
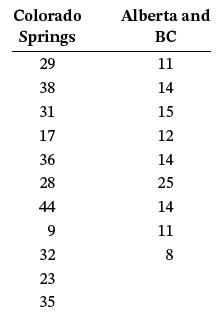
The Canadian Real Estate Association reported in a recent year that the median price of a single-family home in Calgary is $380,737 and the median price of a single-family home in Halifax is $282,499. Suppose a survey of 13 randomly selected single-family homes is taken in Calgary and a survey of
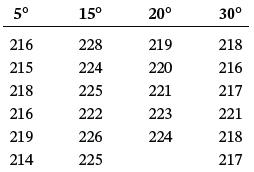
A particular metal part can be produced at different temperatures (in degrees Celsius). All other variables being equal, a company would like to determine whether the strength of the metal part is significantly different for different temperatures. Given are the strengths of random samples of parts
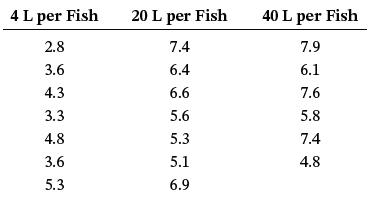
Commercial fish raising is a growing industry in North America. What makes fish raised commercially grow faster and larger? Suppose that a fish industry study is conducted over the three summer months in an effort to determine whether the amount of water allotted per fish makes any difference in
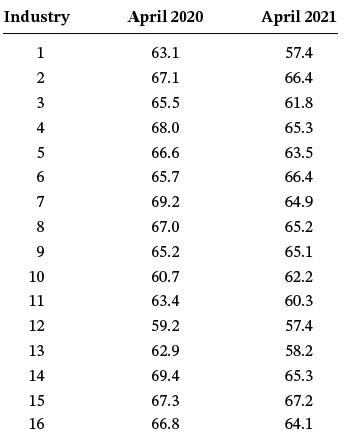
Suppose 16 people in various industries are contacted in 2020 and asked to rate business conditions on several factors. The ratings of each person are tallied into a “business optimism” score. The same people are contacted in 2021 and asked to do the same thing. The higher the score, the more
According to an NCR white paper, it can probably be concluded that most cashiers at high-volume stores receive little or no training on how to properly scan items. What little cashier training is done is typically focused on operating the point-of-sale terminal (register),while the scanner is
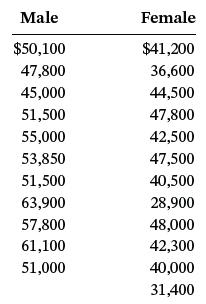
Does the male stock market investor earn significantly more than the female stock market investor? One study by the New York Stock Exchange showed that the male investor has an income of $46,400 and that the female investor has an income of $39,400. Suppose an analyst wanted to prove that the male
Catalyst Paper is a paper manufacturer in Richmond, British Columbia. In 2018 the company was bought by Paper Excellence Canada. With a workforce of about 1,500 employees, Catalyst has a global customer base and over $1 billion in sales each year. Its annual production capacity is 1.3-million
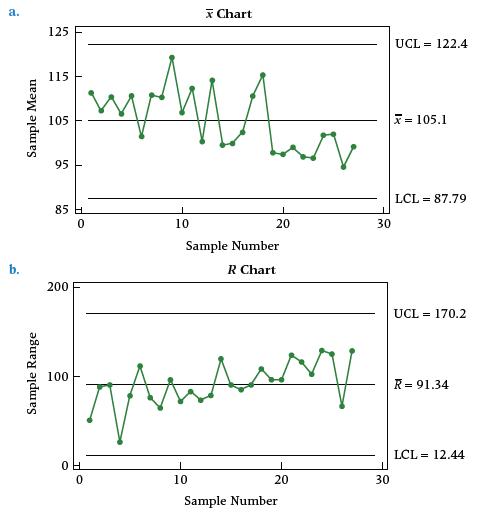
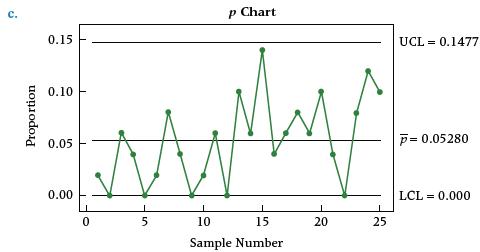
Study each of the following control charts and determine whether any of them indicate problems in the processes. Comment on each chart. a. b. Sample Range 125 115 105 95 85 H 0 200 100 m OH 0 MAA Hur 1 10 x Chart 20 Sample Number R Chart Tamasny 10 20 Sample Number 30 30 UCL = 122.4 = 105.1 LCL =
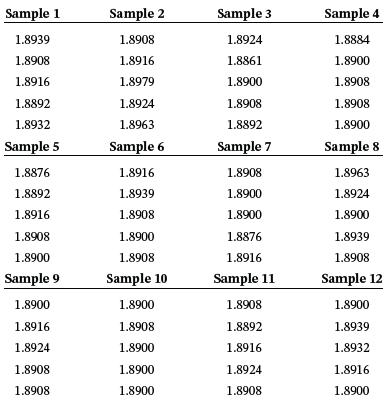
A fruit juice company sells a plastic jug filled with 1.89 L of cranberry-apple juice. Inspectors are concerned about the consistency of volume of fill in these containers. Every two hours for three days of production, a sample of five containers is randomly selected and the volume of fill is
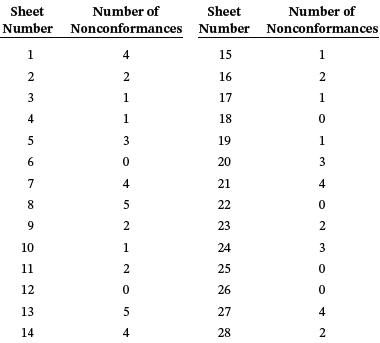
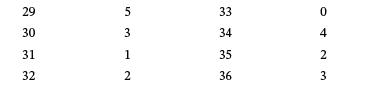
A metal-manufacturing company produces sheet metal. Statistical quality control technicians randomly select sheets to be inspected for blemishes and size problems. The number of nonconformances per sheet is tallied. Shown here are the results of testing 36 sheets of metal. Use the data to construct
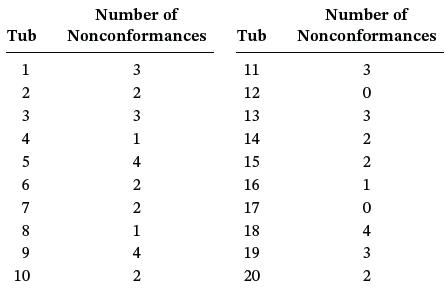
A bathtub manufacturer closely inspects several tubs on every shift for nonconformances such as leaks, lack of symmetry, unstable base, and drain malfunctions. The following list gives the number of nonconformances per tub for 40 tubs. Use these data to construct a c chart of nonconformances for
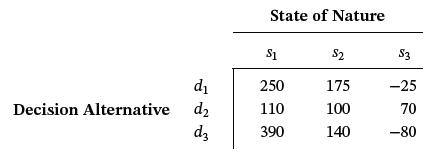
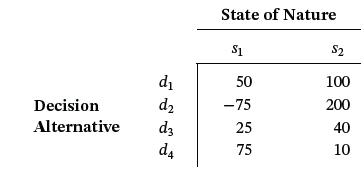
Use the decision table given here to complete parts (a) through (d).a. Use the maximax criterion to determine which decision alternative to select.b. Use the maximin criterion to determine which decision alternative to select.c. Use the Hurwicz criterion to determine which decision alternative to
The Fletcher-Terry Company is a worldwide leader in the development of glass-cutting tools and accessories for professional glaziers, glass manufacturers, glass artisans, and professional framers. The company can trace its roots back to 1868. For many decades, Fletcher-Terry had much success making
The introduction of a new product into the marketplace is quite risky. The percentage of new product ideas that successfully make it into the marketplace is as low as 1%. Research and development costs must be recouped, along with marketing and production costs. However, if a new product is warmly
Use the decision table given here to complete parts (a) through (d).a. Use the maximax criterion to determine which decision alternative to select.b. Use the maximin criterion to determine which decision alternative to select.c. Use the Hurwicz criterion to determine which decision alternative to
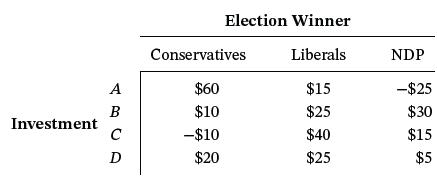
Election results can affect the payoff from certain types of investments. Suppose a brokerage firm is faced with the prospect of investing $20 million a few weeks before the national election. They feel that if the Conservatives are elected, certain types of investments will do quite well, but if
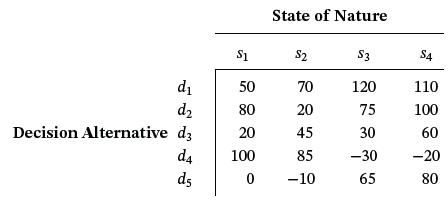
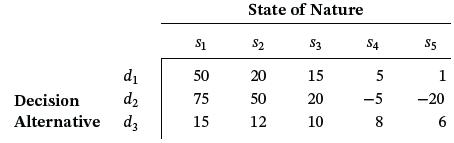
Use the following decision table to construct a decision tree. d₁ Decision d₂ Alternative d3 $1 50 75 15 State of Nature $2 20 50 12 $3 15 20 10 S4 55∞0 -5 8 $5 1 -20 6
Suppose the probabilities of the states of nature occurring for Problem 19.5 are s1 = 0.15, s2 = 0.25, s3 = 0.30, s4 = 0.10, and s5 = 0.20. Use these probabilities and EMVs to reach a conclusion about the decision alternatives in Problem 19.5.Data from problem 19.5Use the following decision table
How much is the expected monetary payoff with perfect information in Problem 19.5? From this answer and the decision reached in Problem 19.6, what is the value of perfect information?Data from problem 19.5Use the following decision table to construct a decision tree.Data from problem 19.6Suppose
What are the four major approaches to making decisions under uncertainty? Explain the basic criterion on which each approach is based.
1. What is meant by risk?2. Explain the term expected value of perfect information.3. What is utility?
How does the expected value of sample information differ from the expected value of perfect information? Give an example of an instance where the expected value of sample information may be used.
A home buyer is completing an application for a home mortgage. He is given the option of locking in a mortgage loan interest rate or waiting 60 days until closing and locking in a rate on the day of closing. The buyer is not given the option of locking in at any time in between. If the buyer locks
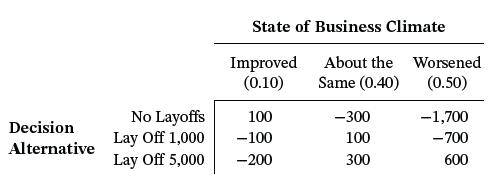
A CEO faces a tough human resources decision. Because the company is currently operating in a budgetary crisis, the CEO will lay off 1,000 people, lay off 5,000 people, or lay off no one. One of the problems for the CEO is that she cannot foretell what the business climate will be like in the
Use the following decision table to complete parts (a) through (d).a. Use the maximax criterion to determine which decision alternative to select.b. Use the maximin criterion to determine which decision alternative to select.c. Use the Hurwicz criterion to determine which decision alternative to
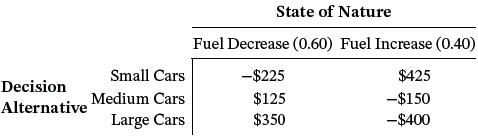
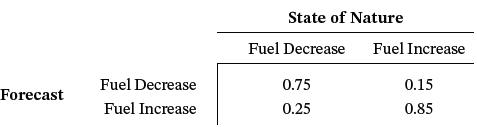
a. A car rental agency faces the decision of buying a fleet of cars, all of which will be the same size. It can purchase a fleet of small cars, medium cars, or large cars. The smallest cars are the most fuel- efficient and the largest cars use the most fuel. One of the problems for the
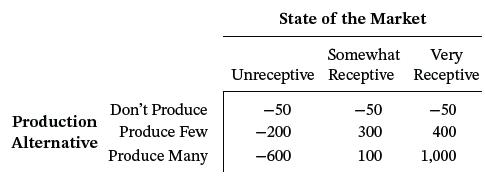
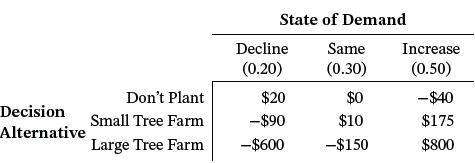
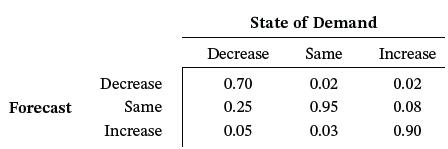
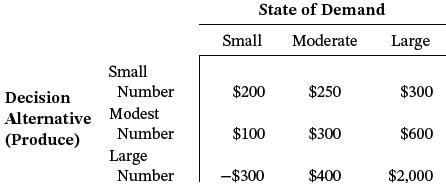
a. A small group of investors is considering planting a tree farm. Their choices are (1) don’t plant trees, (2) plant a small number of trees, or (3) plant a large number of trees. The investors are concerned about the demand for trees. If demand for trees declines, planting a large tree farm
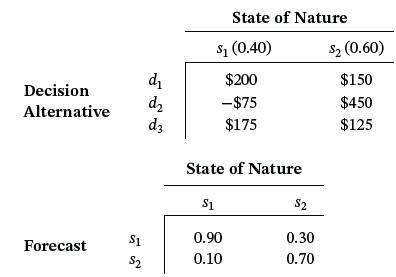
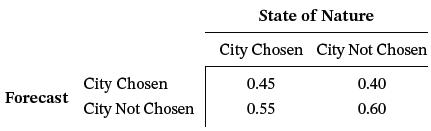
Shown here is a decision table from a business situation. The decision-maker has an opportunity to purchase sample information in the form of a forecast. With the sample information, the prior probabilities can be revised. Also shown are the probabilities of forecasts from the sample information
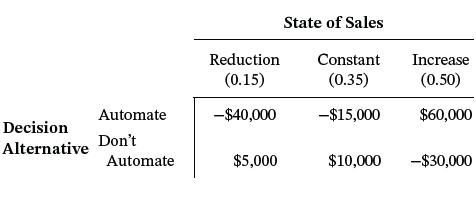
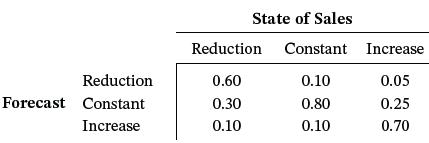
a. A small retailer began as a mom-and-pop operation selling crafts and consignment items. During the past two years, the store’s volume grew significantly. The owners are trying to decide whether to purchase an automated checkout system. The store’s present manual system is slow. They are
Managers of a manufacturing firm decided to add picture frames to its list of production items. However, they have not decided how many to produce because they are uncertain about the level of demand. Shown here is a decision table that has been constructed to help the managers in their decision
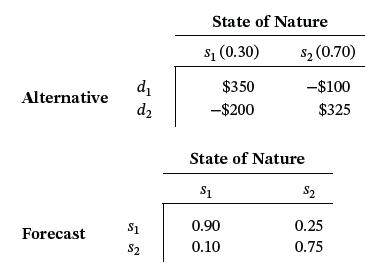
Shown here is a decision table. A forecast can be purchased by the decision-maker. The forecaster is not correct 100% of the time. Also given is a table containing the probabilities of the forecaster being correct under different states of nature. Use the first table to compute the EMV of this
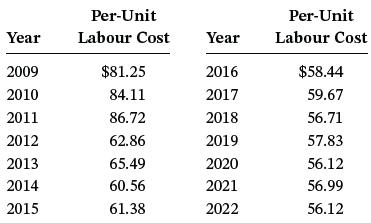
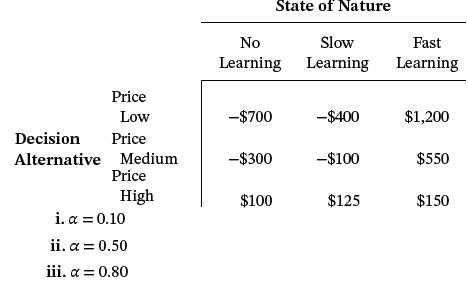
Some companies use production learning curves to set pricing strategies. They price their product lower than the initial cost of making the product; after some period of time, the learning curve takes effect and the product can be produced for less than its selling price. In this way, the company
a. Some oil speculators are interested in drilling an oil well. The rights to the land have been secured and they must decide whether to drill. The states of nature are that oil is present or that no oil is present. Their two decision alternatives are drill or don’t drill. If they strike oil, the
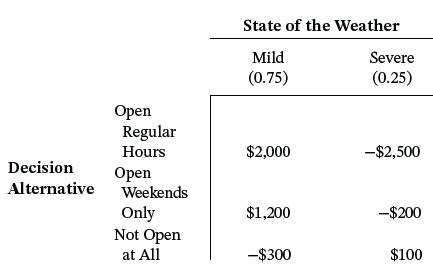
An entertainment company owns two amusement parks in British Columbia. It is faced with the decision of whether to open the parks in the winter. If it chooses to open the parks in the winter, it can leave the parks open during regular hours (as in the summer) or it can open only on the weekends. To
A Canadian manufacturing company has decided to consider producing a particular model of one of its products just for sale in Germany. Because of the German requirements, the product must be made specifically for German consumption and cannot be sold in Canada. Company officials believe the market
A person has a chance to invest $50,000 in a business venture. If the venture works, the investor will reap $200,000. If the venture fails, the investor will lose his money. It appears that there is about a 0.50 probability of the venture working. Using this information, answer the following
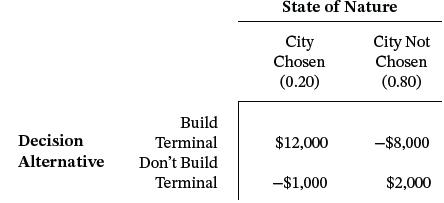
a. A city is considering airport expansion. In particular, the mayor and city council are trying to decide whether to sell bonds to construct a new terminal. The problem is that at present demand for gates is not strong enough to warrant construction of a new terminal. However, a major airline is
In 1895, Ignaz Schwinn and his partner, Adolph Arnold, incorporated Arnold, Schwinn & Company to produce bicycles. In the early years, with bicycle products such as the “Roadster,” a single-speed bike that weighed 19 pounds (about 9 kg), Schwinn products appealed to people of all ages as a
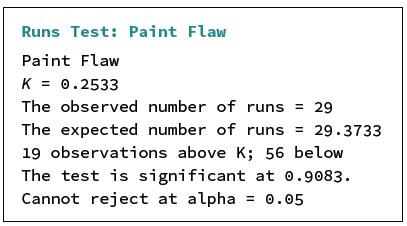
1. In your own words, describe the meaning of nonparametric statistics.2. List two advantages and two disadvantages of nonparametric statistics.3. State the null and the alternative hypotheses in a runs test.
1. In your own words, describe the Mann-Whitney U test.2. What are the two key assumptions of the Mann-Whitney U test?
1. In your own words, describe the Wilcoxon matched-pairs signed rank test.2. What are the two key assumptions underlying the Wilcoxon matched-pairs signed rank test?
1. What can we use the Kruskal-Wallis test to determine?2. State the null and alternative hypotheses of the Kruskal-Wallis test.
1. What is the parametric alternative to the Friedman test?2. What are the key assumptions underlying the Friedman test?3. State the null and alternative hypotheses of the Friedman test.
1. What technique can be used to analyze the degree of association of two variables when only ordinal level data or ranked data are available?2. In the Spearman’s rank correlation technique, how are ranks assigned within each group?
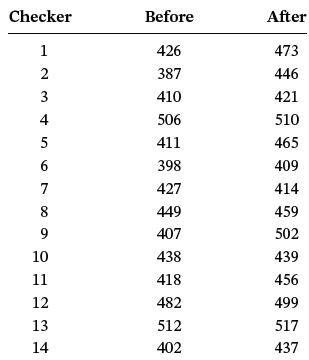
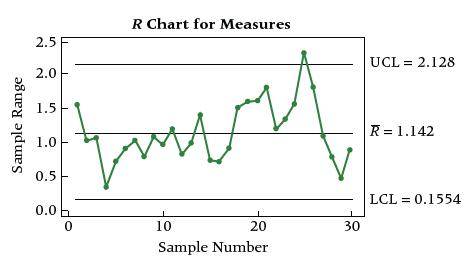
Study the R chart for the product and data used in Problem 18.24. Comment on the state of the production process for this item.Data from problem 18.24Study the chart on the size of a product that is supposed to measure 12 cm. Does the process appear to be out of control? Why or why not? Sample
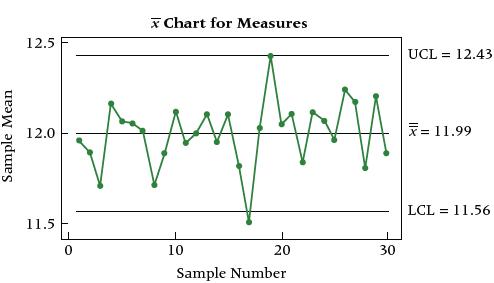
Study the chart on the size of a product that is supposed to measure 12 cm. Does the process appear to be out of control? Why or why not? Sample Mean 12.5 12.0 11.5 ot! 0 Chart for Measures M 1 10 AAAA M 20 Sample Number 30 UCL = 12.43 = 11.99 LCL = 11.56
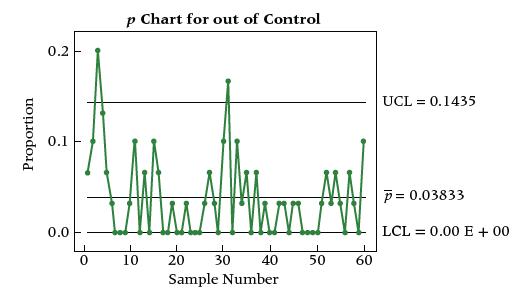
Study the p chart for a manufactured item. The chart represents the results of testing 30 items at a time for compliance. Sixty different samples were taken for this chart. Discuss the results and the implications for the production process. Proportion 0.2 0.1 0.0 0 p Chart for out of
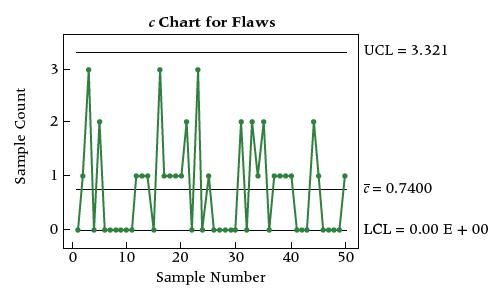
Study the c chart for nonconformances for a part produced in a manufacturing process. Comment on the results. Sample Count 3 N 0 0 1 10 c Chart for Flaws 20 30 Sample Number 40 50 UCL = 3.321 T = 0.7400 LCL = 0.00 E + 00
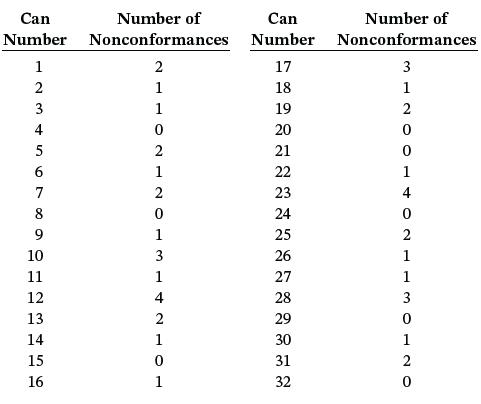
A soft drink bottling company just ran a long line of 355 mL soft drink cans filled with cola. A sample of 32 cans is selected by inspectors looking for nonconforming items. Among the things the inspectors look for are paint defects on the can, improper seal, incorrect volume, leaking contents,
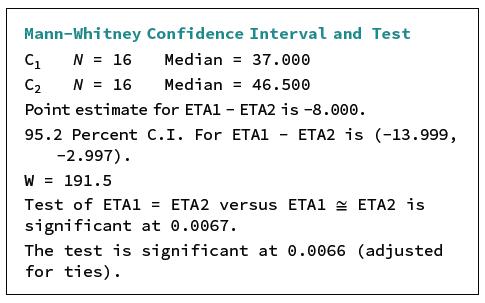
Study the following Minitab output. What is the purpose of this statistical test? What are the results of this analysis? Mann-Whitney Confidence Interval and Test Median = 37.000 Median = 46.500 Point estimate for ETA1 - ETA2 is -8.000. 95.2 Percent C.I. For ETA1 ETA2 is (-13.999, -2.997). W =
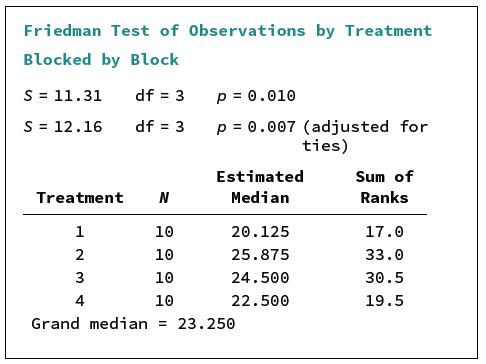
Study the following Minitab output. What is the purpose of this statistical test? What type of design was it? What was the result of the test? Friedman Test of Observations by Treatment Blocked by Block S = 11.31 S = 12.16 Treatment df = 3 df = 3 1 2 3 4 p = 0.010 p = 0.007 (adjusted
1. What is the difference between manufacturing-based quality and value quality?2. What are the two different ways in which quality control can be undertaken?3. What is meant by “productivity”?4. What do the following terms mean: Six Sigma, lean manufacturing, benchmarking, JIT, reengineering,
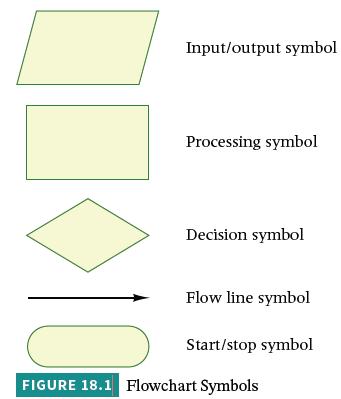
For each of the following scenarios, sketch the process with activities and decision points. Construct a flowchart by using the symbols depicted in Figure 18.1.a. A customer enters the office of an insurance agent wanting to purchase auto insurance and leaves the office with a paid policy in
What are the seven tools of process analysis? Provide a brief description of each.
A bank has just sent out a monthly reconciliation statement to a customer with an error in the person’s monthly income. Brainstorm to determine some possible causes of this error. Try to think of some possible reasons for the causes. Construct a fishbone diagram to display your results.
1. What are control charts?2. What is the difference between x–charts, R charts, p charts, and c charts?
A toy-manufacturing company has been given a large order for small plastic whistles that will be given away by a large fast-food hamburger chain with its kids’ meal. Seven random samples of four whistles have been taken. The mass of each whistle has been ascertained in grams. The data are shown
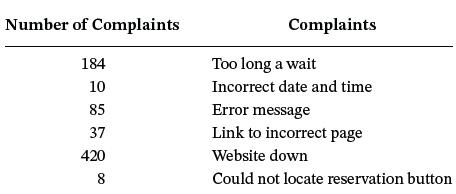
A local upscale restaurant uses a website to take and manage its reservations. It has been receiving an unusually high number of customer complaints about its reservation system. The restaurant conducted a survey of customers, asking them whether they had encountered any of the following problems
A survey of U.S. small-business owners was conducted to determine the challenges for growth for their businesses. The top challenge, selected by 46% of the small-business owners, was the economy. A close second was finding qualified workers (37%). Suppose 15% of the small-business owners selected
According to Statistics Canada (for 2017), 60% of all Canadian households have an air conditioner and 81% have trees on their property. 5 Suppose 91% of all Canadian households with an air conditioner have trees on their property. A Canadian household is randomly selected.a. What is the probability
Showing 6100 - 6200
of 6217
First
49
50
51
52
53
54
55
56
57
58
59
60
61
62
63
Step by Step Answers