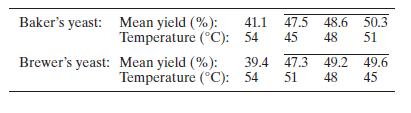
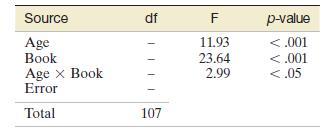
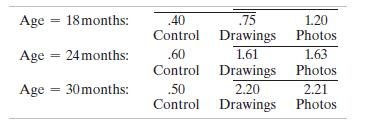
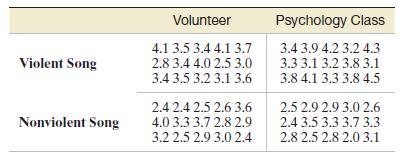
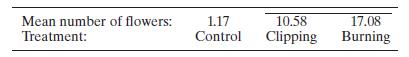
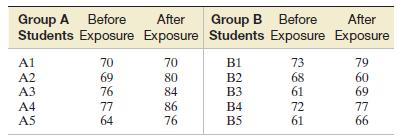
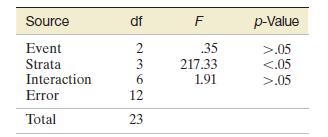
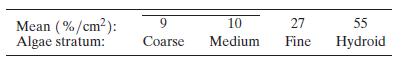
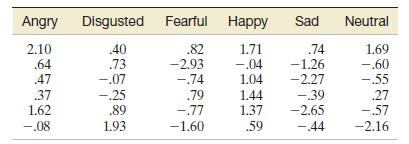
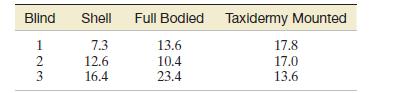
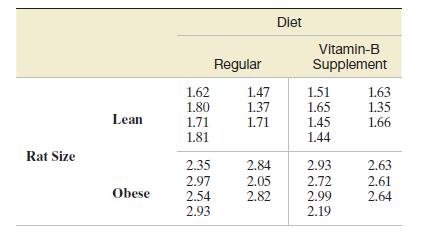
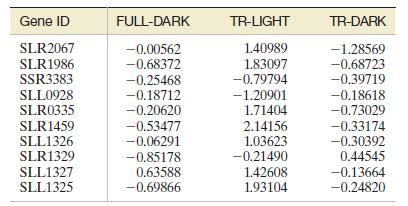
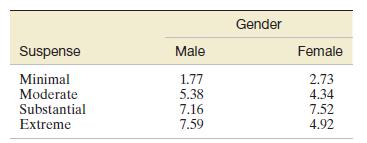
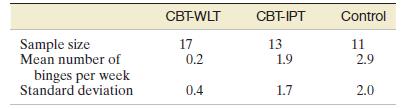
All Matches
Solution Library
Expert Answer
Textbooks
Search Textbook questions, tutors and Books
Oops, something went wrong!
Change your search query and then try again
Toggle navigation
FREE Trial
S
Books
FREE
Tutors
Study Help
Expert Questions
Accounting
General Management
Mathematics
Finance
Organizational Behaviour
Law
Physics
Operating System
Management Leadership
Sociology
Programming
Marketing
Database
Computer Network
Economics
Textbooks Solutions
Accounting
Managerial Accounting
Management Leadership
Cost Accounting
Statistics
Business Law
Corporate Finance
Finance
Economics
Auditing
Ask a Question
Search
Search
Sign In
Register
study help
business
business statistics
Questions and Answers of
Business Statistics
Six different national brands of chocolate chip cookies were randomly selected at the supermarket. The grams of fat per serving are as follows: 8; 8; 10; 7; 9; 9. Assume the underlying distribution
A survey of the mean number of cents off that coupons give was conducted by randomly surveying one coupon per page from the coupon sections of a recent San Jose Mercury News. The following data were
Find the 95% Confidence Interval for the true population mean for the amount of soda served.a. (12.42, 14.18)b. (12.32, 14.29)c. (12.50, 14.10)d. Impossible to determine quality control specialist
Insurance companies are interested in knowing the population percent of drivers who always buckle up before riding in a car.a. When designing a study to determine this population proportion, what is
Suppose that the insurance companies did do a survey. They randomly surveyed 400 drivers and found that 320 claimed they always buckle up. We are interested in the population proportion of drivers
According to a recent survey of 1,200 people, 61% feel that the president is doing an acceptable job. We are interested in the population proportion of people who feel the president is doing an
An article regarding interracial dating and marriage recently appeared in the Washington Post. Of the 1,709 randomly selected adults, 315 identified themselves as Latinos, 323 identified themselves
Refer to the information in Exercise 8.117.a. Construct three 95% confidence intervals.i. percent of all Asians who would welcome a white person into their families.ii. percent of all Asians who
Stanford University conducted a study of whether running is healthy for men and women over age 50. During the first eight years of the study, 1.5% of the 451 members of the 50-Plus Fitness
A telephone poll of 1,000 adult Americans was reported in an issue of Time Magazine. One of the questions asked was “What is the main problem facing the country?” Twenty percent answered
Refer to Exercise 8.120. Another question in the poll was “[How much are] you worried about the quality of education in our schools?” Sixty-three percent responded “a lot”. We are interested
A point estimate for the true population proportion is:a. 0.90b. 1.27c. 0.79d. 400 According to a Field Poll, 79% of California adults (actual results are 400 out of 506 surveyed) feel that
A 90% confidence interval for the population proportion is _______.a. (0.761, 0.820)b. (0.125, 0.188)c. (0.755, 0.826)d. (0.130, 0.183)According to a Field Poll, 79% of California adults (actual
Find the confidence interval at the 90% Confidence Level for the true population proportion of southern California community homes meeting at least the minimum recommendations for earthquake
The point estimate for the population proportion of homes that do not meet the minimum recommendations for earthquake preparedness is ______.a. 0.6614b. 0.3386c. 173d. 338 Five hundred and eleven
On May 23, 2013, Gallup reported that of the 1,005 people surveyed, 76% of U.S. workers believe that they will continue working past retirement age. The confidence level for this study was reported
A national survey of 1,000 adults was conducted on May 13, 2013 by Rasmussen Reports. It concluded with 95%confidence that 49% to 55% of Americans believe that big-time college sports programs
Public Policy Polling recently conducted a survey asking adults across the U.S. about music preferences. When asked, 80 of the 571 participants admitted that they have illegally downloaded music.a.
You plan to conduct a survey on your college campus to learn about the political awareness of students. You want to estimate the true proportion of college students on your campus who voted in the
Among various ethnic groups, the standard deviation of heights is known to be approximately three inches. We wish to construct a 95% confidence interval for the mean height of male Swedes.
Announcements for 84 upcoming engineering conferences were randomly picked from a stack of IEEE Spectrum magazines. The mean length of the conferences was 3.94 days, with a standard deviation of 1.28
Suppose that an accounting firm does a study to determine the time needed to complete one person’s tax forms. It randomly surveys 100 people. The sample mean is 23.6 hours. There is a known
A sample of 16 small bags of the same brand of candies was selected. Assume that the population distribution of bag weights is normal. The weight of each bag was then recorded. The mean weight was
A camp director is interested in the mean number of letters each child sends during his or her camp session. The population standard deviation is known to be 2.5. A survey of 20 campers is taken. The
What is meant by the term “90% confident” when constructing a confidence interval for a mean?a. If we took repeated samples, approximately 90% of the samples would produce the same confidence
The Federal Election Commission collects information about campaign contributions and disbursements for candidates and political committees each election cycle. During the 2012 campaign season, there
The American Community Survey (ACS), part of the United States Census Bureau, conducts a yearly census similar to the one taken every ten years, but with a smaller percentage of participants. The
The average height of young adult males has a normal distribution with standard deviation of 2.5 inches. You want to estimate the mean height of students at your college or university to within one
If the confidence interval is change to a higher probability, would this cause a lower, or a higher, minimum sample size?
If the tolerance is reduced by half, how would this affect the minimum sample size?
If the value of p is reduced, would this necessarily reduce the sample size needed?
Is it acceptable to use a higher sample size than the one calculated by 2 zpq pq? e2
A company has been running an assembly line with 97.42%% of the products made being acceptable. Then, a critical piece broke down. After the repairs the decision was made to see if the number of
a. What is the distribution for the weights of one 25-pound lifting weight? What is the mean and standard deivation?b. What is the distribution for the mean weight of 100 25-pound lifting weights?c.
Draw the graph from Exercise 7.1Exercise 7.1What is the distribution for the weights of one 25-pound lifting weight? What is the mean and standard deivation?b. What is the distribution for the mean
Find the probability that the mean actual weight for the 100 weights is greater than 25.2.A manufacturer produces 25-pound lifting weights. The lowest actual weight is 24 pounds, and the highest is
Draw the graph from Exercise 7.3. Exercise 7.3Find the probability that the mean actual weight for the 100 weights is greater than 25.2.A manufacturer produces 25-pound lifting weights. The lowest
Find the 90th percentile for the mean weight for the 100 weights.A manufacturer produces 25-pound lifting weights. The lowest actual weight is 24 pounds, and the highest is 26 pounds. Each weight is
Draw the graph from Exercise 7.5.Exercise 7.5Find the 90th percentile for the mean weight for the 100 weights.A manufacturer produces 25-pound lifting weights. The lowest actual weight is 24 pounds,
a. What is the distribution for the sum of the weights of 100 25-pound lifting weights?b. Find P(Σx < 2,450). is uniform. A sample of 100 weights is taken.A manufacturer produces 25-pound lifting
Draw the graph from Exercise 7.7Exercise 7.7a. What is the distribution for the sum of the weights of 100 25-pound lifting weights?b. Find P(Σx < 2,450). is uniform. A sample of 100 weights is
Find the 90th percentile for the total weight of the 100 weights.A manufacturer produces 25-pound lifting weights. The lowest actual weight is 24 pounds, and the highest is 26 pounds. Each weight is
Draw the graph from Exercise 7.9Exercise 7.9Find the 90th percentile for the total weight of the 100 weights.A manufacturer produces 25-pound lifting weights. The lowest actual weight is 24 pounds,
a. What is the standard deviation?b. What is the parameter m?The length of time a particular smartphone's battery lasts follows an exponential distribution with a mean of ten months. A sample of 64
What is the distribution for the length of time one battery lasts?The length of time a particular smartphone's battery lasts follows an exponential distribution with a mean of ten months. A sample of
What is the distribution for the mean length of time 64 batteries last?The length of time a particular smartphone's battery lasts follows an exponential distribution with a mean of ten months. A
What is the distribution for the total length of time 64 batteries last?The length of time a particular smartphone's battery lasts follows an exponential distribution with a mean of ten months. A
Find the probability that the sample mean is between seven and 11.The length of time a particular smartphone's battery lasts follows an exponential distribution with a mean of ten months. A sample of
Find the 80th percentile for the total length of time 64 batteries last.
Find the IQR for the mean amount of time 64 batteries last.
Find the middle 80% for the total amount of time 64 batteries last.
Find P(Σx > 420).A uniform distribution has a minimum of six and a maximum of ten. A sample of 50 is taken.
Find the 90th percentile for the sums.A uniform distribution has a minimum of six and a maximum of ten. A sample of 50 is taken.
Find the 15th percentile for the sums.A uniform distribution has a minimum of six and a maximum of ten. A sample of 50 is taken.
Find the first quartile for the sums.A uniform distribution has a minimum of six and a maximum of ten. A sample of 50 is taken.
Find the third quartile for the sums.A uniform distribution has a minimum of six and a maximum of ten. A sample of 50 is taken.
Find the 80th percentile for the sums.A uniform distribution has a minimum of six and a maximum of ten. A sample of 50 is taken.
A population has a mean of 25 and a standard deviation of 2. If it is sampled repeatedly with samples of size 49, what is the mean and standard deviation of the sample means?A uniform distribution
A population has a mean of 48 and a standard deviation of 5. If it is sampled repeatedly with samples of size 36, what is the mean and standard deviation of the sample means?A uniform distribution
A population has a mean of 90 and a standard deviation of 6. If it is sampled repeatedly with samples of size 64, what is the mean and standard deviation of the sample means?
A population has a mean of 120 and a standard deviation of 2.4. If it is sampled repeatedly with samples of size 40, what is the mean and standard deviation of the sample means?
A population has a mean of 17 and a standard deviation of 1.2. If it is sampled repeatedly with samples of size 50, what is the mean and standard deviation of the sample means?
A population has a mean of 17 and a standard deviation of 0.2. If it is sampled repeatedly with samples of size 16, what is the expected value and standard deviation of the sample means?
A population has a mean of 38 and a standard deviation of 3. If it is sampled repeatedly with samples of size 48, what is the expected value and standard deviation of the sample means?
A population has a mean of 14 and a standard deviation of 5. If it is sampled repeatedly with samples of size 60, what is the expected value and standard deviation of the sample means?
A question is asked of a class of 200 freshmen, and 23% of the students know the correct answer. If a sample of 50 students is taken repeatedly, what is the expected value of the mean of the sampling
A game is played repeatedly. A player wins one-fifth of the time. If samples of 40 times the game is played are taken repeatedly, what is the standard deviation of the mean of the sampling
Previously, De Anza statistics students estimated that the amount of change daytime statistics students carry is exponentially distributed with a mean of \($0.88.\) Suppose that we randomly pick 25
Suppose that the distance of fly balls hit to the outfield (in baseball) is normally distributed with a mean of 250 feet and a standard deviation of 50 feet. We randomly sample 49 fly balls.a. If X̅
According to the Internal Revenue Service, the average length of time for an individual to complete (keep records for, learn, prepare, copy, assemble, and send) IRS Form 1040 is 10.53 hours (without
Suppose that a category of world-class runners are known to run a marathon (26 miles) in an average of 145 minutes with a standard deviation of 14 minutes. Consider 49 of the races. Let X̅ the
The length of songs in a collector’s iTunes album collection is uniformly distributed from two to 3.5 minutes. Suppose we randomly pick five albums from the collection. There are a total of 43
In 1940 the average size of a U.S. farm was 174 acres. Let’s say that the standard deviation was 55 acres. Suppose we randomly survey 38 farmers from 1940. a. In words, X = b. In words, X C. X N =
Determine which of the following are true and which are false. Then, in complete sentences, justify your answers.a. When the sample size is large, the mean of X̅ is approximately equal to the mean
The percent of fat calories that a person in America consumes each day is normally distributed with a mean of about 36 and a standard deviation of about ten. Suppose that 16 individuals are randomly
The distribution of income in some Third World countries is considered wedge shaped (many very poor people, very few middle income people, and even fewer wealthy people). Suppose we pick a country
Which of the following is NOT TRUE about the distribution for averages?a. The mean, median, and mode are equal.b. The area under the curve is one.c. The curve never touches the x-axis.d. The curve is
The cost of unleaded gasoline in the Bay Area once followed an unknown distribution with a mean of $4.59 and a standard deviation of $0.10. Sixteen gas stations from the Bay Area are randomly chosen.
A large population has skewed data with a mean of 70 and a standard deviation of 6. Samples of size 100 are taken, and the distribution of the means of these samples is analyzed.a. Will the
A population has a standard deviation of 50. It is sampled with samples of size 100. What is the variance of the means of the samples?
A farmer picks pumpkins from a large field. The farmer makes samples of 260 pumpkins and inspects them. If one in fifty pumpkins are not fit to market and will be saved for seeds, what is the
A store surveys customers to see if they are satisfied with the service they received. Samples of 25 surveys are taken.One in five people are unsatisfied. What is the variance of the mean of the
A company gives an anonymous survey to its employees to see what percent of its employees are happy. The company is too large to check each response, so samples of 50 are taken, and the tendency is
A pollster asks a single question with only yes and no as answer possibilities. The poll is conducted nationwide, so samples of 100 responses are taken. There are four yes answers for each no answer
The mean of the sampling distribution of sample proportions has a value of p of 0.3, and sample size of 40.a. Is there a difference in the expected value if p and q reverse roles?b. Is there a
A school has 500 students. Usually, there are an average of 20 students who are absent. If a sample of 30 students is taken on a certain day, what is the probability that at least 2 students in the
A bottle of water contains 12.05 fluid ounces with a standard deviation of 0.01 ounces. Define the random variable X in words. X = ____________.
A normal distribution has a mean of 61 and a standard deviation of 15. What is the median?
A company manufactures rubber balls. The mean diameter of a ball is 12 cm with a standard deviation of 0.2 cm. Define the random variable X in words. X = ______________.
What is the median?X ~ N(–4, 1)
Fill in the blank X ~ N(3, 5)σ = _______
Fill in the blank X ~ N(–2, 1)μ = _______
What does a z-score measure?
What does standardizing a normal distribution do to the mean?
Is X ~ N(0, 1) a standardized normal distribution? Why or why not?
What is the z-score of x = 12, if it is two standard deviations to the right of the mean?
What is the z-score of x = 9, if it is 1.5 standard deviations to the left of the mean?
What is the z-score of x = –2, if it is 2.78 standard deviations to the right of the mean?
What is the z-score of x = 7, if it is 0.133 standard deviations to the left of the mean?
Suppose X ~ N(2, 6). What value of x has a z-score of three?
Showing 500 - 600
of 2206
1
2
3
4
5
6
7
8
9
10
11
12
13
14
15
Last