New Semester
Started
Get
50% OFF
Study Help!
--h --m --s
Claim Now
Question Answers
Textbooks
Find textbooks, questions and answers
Oops, something went wrong!
Change your search query and then try again
S
Books
FREE
Study Help
Expert Questions
Accounting
General Management
Mathematics
Finance
Organizational Behaviour
Law
Physics
Operating System
Management Leadership
Sociology
Programming
Marketing
Database
Computer Network
Economics
Textbooks Solutions
Accounting
Managerial Accounting
Management Leadership
Cost Accounting
Statistics
Business Law
Corporate Finance
Finance
Economics
Auditing
Tutors
Online Tutors
Find a Tutor
Hire a Tutor
Become a Tutor
AI Tutor
AI Study Planner
NEW
Sell Books
Search
Search
Sign In
Register
study help
business
business statistics
Business Statistics 4th Canadian Edition Norean Sharpe, Richard De Veaux, Paul Velleman, David Wright - Solutions
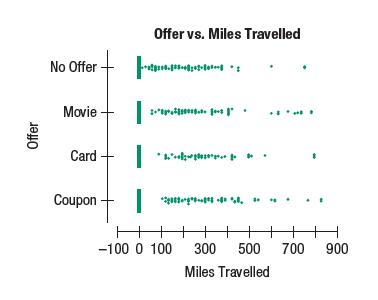
Closer examination of the miles data from the Porter project (see For Example: “Analyzinga one-way design for Ottawa–Toronto f lights”) shows that only about 5% of the students overall actually flew, so the Miles Travelled are about 95% zeros and theother values are highly skewed to the
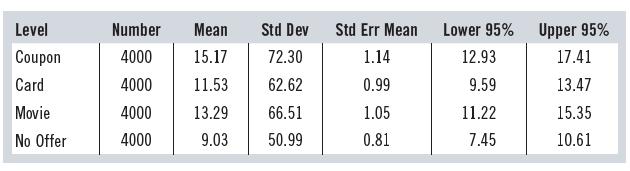
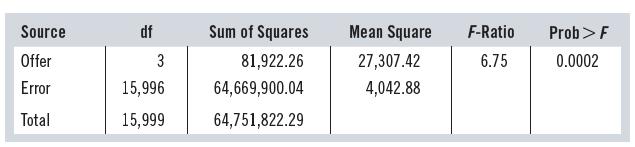
You decide to implement the simple one-factor completely randomized design, sending out four offers (Coupon, Card, Movie, or No Offer) to 4000 students each (see For Example: “Designing an experiment for Ottawa–Toronto flights”). A year later you collect the results and find the following
Continuing from For Example: “Experimental design principles for Ottawa–Torontof lights,” you’re considering splitting up the students into two groups before mailingthe offers: those who live or go to school in Montreal, and those who live or goto school in Ottawa or Toronto. Using home and
Explain how the four principles of experimental design are used in the Porter experiment described For Example: “A marketing experiment for Ottawa– Toronto flights.”
Having discovered that most student passengers on the Porter Ottawa–Toronto routeuse the free internet service in the airport lounges (see For Example: “Observationalstudies for Ottawa–Toronto f lights”), you decide to find out how best to attractmore students to f ly the route. After
Porter offers flights to and from the Island airport in Toronto, providing faster access to the downtown area than Pearson International Airport, which is farther from the city centre. Porter’s fare structure focuses on business passengers; it also provides complimentary refreshments and internet
The owner of the car dealership is curious about the maximum discount his salespeople are willing to give to customers. In particular, two of his salespeople, Frank and Nikita, seem to have very different ideas about how much discount to allow. To test his suspicion, he selects 30 cars from the lot
We concluded in For Example: “The t-test for the difference of two mean car discounts” that, on average, women receive a larger discount than men at the car dealership. How big is the difference, on average? Find a 95% confidence interval for the difference.
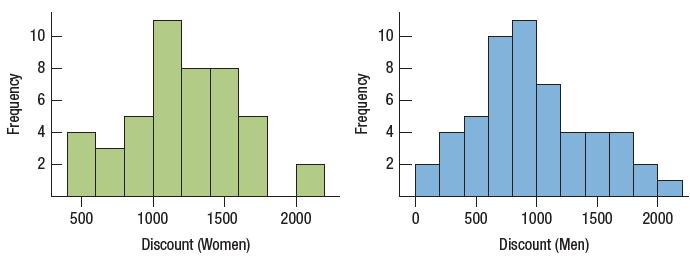
“The t-test for the difference of two mean car discounts,” we rejected the null hypothesis that the mean discount received by men and women is the same. Here are the histograms of the discounts for both women and men. Check the assumptions and conditions and state any concerns you might have
The owner of a large car dealership wants to understand the negotiation process for buying a new car. Cars are given a “sticker price,” but a potential buyer may negotiate a better price. The owner wonders if there’s a difference in how men and women negotiate and who, if either, obtains the
From 58 randomly selected retail sales, an analyst finds that the mean amount spent is \($26.05\) with a standard deviation of \($10.20\) and is approximately Normally distributed. Test the hypothesis that the mean is still \($24.85,\) as it was last year, against the alternative that it has
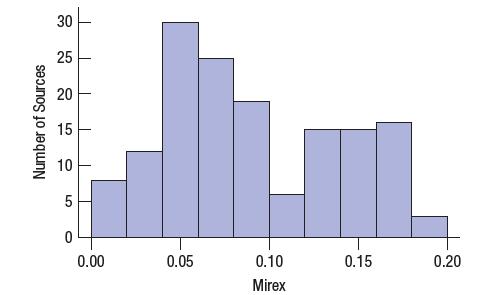
Researchers purchased whole farmed salmon at random from 51 farms in eightregions in six countries (see For Example: “Finding a confidence interval for the meancontaminant levels in fish”). The histogram shows the concentrations of the insecticideMirex in the 150 samples of farmed salmon we
Suppose that a year later, a full accounting of all the Smart Wool transactions (see For Example: “The reasoning of hypothesis tests about website customers”) finds that 26.5% of visits resulted in sales. Have any errors been made?
Survey companies like Nanos Research often survey about 1000 people in order toget a narrow standard deviation on their results and hence significant results. To seethe effect of using a much smaller sample, let’s suppose that only 30 people had beensurveyed.QUESTION: If the survey of whether
Find the critical z value for the Smart Wool hypothesis (see For Example:“The reasoning of hypothesis tests about website customers”) using a = 0.05 and show that the same decision would have been made using critical values.
The analyst at SmartWool (see For Example: “Setting the a level for website customers”) makes another change to the website, puts it online, selects 200 recent web visits at random, and finds that 29% of them have resulted in a sale.Would this be a surprising proportion of sales if the true
Following from For Example: “Conclusions about website customersfrom P-values,” the manager of the analyst at SmartWool wants her to compare an alevel of 0.05 with an a level of 0.01 for her hypothesis tests. What would her conclusionbe if the P-value comes to (a) 0.06; (b) 0.03; or (c) 0.003?
SmartWool, an online vendor of fancy woolen ski mitts, recently redesigned its website, and analysts at Smart Wool want to know if the proportion of visits resulting in a sale has changed since the new site went online.QUESTION If the old site’s proportion was 20%, frame appropriate null and
The manager in For Example: “The distribution of a sample proportion of retail customers”also examines the amount spent by customers using the self-checkout stations.He finds that the distribution of these amounts is unimodal but skewed to the high endbecause some customers make unusually
The analyst conducting the Rogers survey in For Example: “Sampling distribution forproportions of telecommunications customers” says that, unfortunately, only 20 of thecustomers he tried to contact actually responded, but that of those 20, 8 are packagesubscribers.QUESTIONS1. If the proportion
Rogers provides cable, phone, and internet services to customers, some of whom subscribe to “packages” including several services. Nationwide, suppose that 30% of Rogers customers are “package subscribers” and subscribe to all three types of service. A local representative in Toronto
A supermarket has installed “self-checkout” stations that allow customers to scan and bag their own groceries. These are popular, but because customers occasionally encounter a problem, a staff member must be available to help out. The manager wants to estimate what proportion of customers need
The Charlevoix Seismic Zone (CSZ) is the most seismically active region of eastern Canada. Earthquakes of magnitude 6.0 and over occur once every 52.4 years on average. The last one occurred in 1925. Let us assume that earthquakes occur independently of each other and so the time interval between
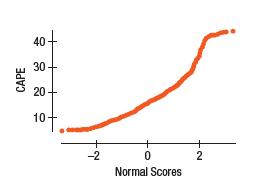
The Cyclically Adjusted Price/Earnings ratio (CAPE10) smooths out short-term f luctuations in the price/earnings ratio of companies traded on the stock market and is used by some investors as an indicator of when to buy and sell. A normal probability plot of the CAPE10 for the New York Stock
Suppose an MBA program says it admits only people with GMAT scores among the top 10%. How high a GMAT score does it take to be eligible?
Assuming the GMAT scores are nearly Normal with a mean of 500 and a standard deviation of 100, what proportion of GMAT scores falls between 450 and 600?
The Graduate Management Admission Test (GMAT) has scores from 200 to 800.Scores are supposed to follow a distribution that is roughly unimodal and symmetricand is designed to have an overall mean of 500 and a standard deviation of 100. In anyone year, the mean and standard deviation may differ from
The Charlevoix Seismic Zone (CSZ) is the most seismically active region of easternCanada. Earthquakes of magnitude 6.0 and over occur once every 52.4 years on average.The last one occurred in 1925. Let us assume that earthquakes occur independentlyof each other and so follow a Poisson
A venture capital firm has a list of potential investors who have previously invested innew technologies. On average, these investors invest in about 5% of the opportunitiespresented to them. A new client of the firm is interested in finding investors for a 3-Dprinting technology for printing
You are considering investing \($1000\) into one or possibly two different investment funds. Historically, each has delivered 5% a year in profit with a standard deviation of 3%. So, a \($1000\) investment would produce \($50\) with a standard deviation of \($30\).QUESTION:Assuming the two funds
Calculating the expected value of a lottery ticket,” we found the expected gain per ticket to be -\($2.10.\) What is the standard deviation? What does it say about your chances in the lottery? Comment.
A fundraising lottery offers 500 tickets for \($3\) each. If the grand prize is \($250\) and four second prizes are \($50\) each, what is the expected value of a single ticket? (Don’t count the price of the ticket in this yet.) Now, including the price, what is the expected value of the ticket?
Bob is 70% sure that Helen should be promoted to a management position. In order to increase the probability of making the right decision, he sends her for a psychological test. The test isn’t perfect, but the company has records of the test results from people who’ve gone on to become either
A recent Ontario highway safety study found that in 77% of all accidents the driverwas wearing a seat belt. Accident reports indicated that 92% of those drivers escapedserious injury (defined as hospitalization or death), but only 63% of the non-belteddrivers were so fortunate.QUESTION: Draw the
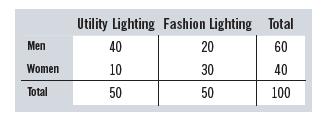
Using the table from For Example: “Marginal probabilities for retail purchases,” if a customer purchases a fashion light, what is the probability that the customer is a woman?
Lee suspects that men and women make different kinds of purchases at Lee’s Lights(see For Example: “Using the General Addition Rule for retail purchases”). The tableshows the purchases made by the last 100 customers who actually made a purchase:QUESTION:What’s the probability that one of
Lee notices that when two customers enter the store together, their behaviour isn’t independent. In fact, there’s a 20% chance they’ll both make a purchase.QUESTION:When two customers enter the store together, what is the probability that at least one of them will make a purchase?
Some customers prefer to see the merchandise in the store but then make their purchaselater using Lee’s Lights’s new internet site. Tracking customer behaviour, Leedetermines that there’s a 9% chance of a customer making a purchase in this way. Weknow that about 30% of customers make
Lee knows that the probability that a customer will make a purchase is 30%.QUESTION:If we can assume that customers behave independently, what is the probability that the next two customers entering Lee’s Lights make purchases?
Lee’s Lights sells lighting fixtures. Some customers are there only to browse, so Lee records the behaviour of all customers for a week to assess how likely it is that a customer will make a purchase. Lee finds that of 1000 customers entering the store during the week, 300 make purchases. Lee
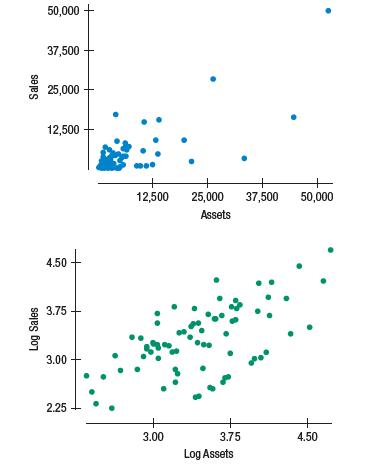
Consider the relationship between a company’s Assets and its Sales as reported inannual financial statements. Here’s a scatterplot of those variables for 79 of the largestcompanies together with a scatterplot of the logarithm of each variable:QUESTION: What should we say about the relationship
Find and interpret the R2 for the regression found in For Example: “A linear model for retail expansion across Canada”.
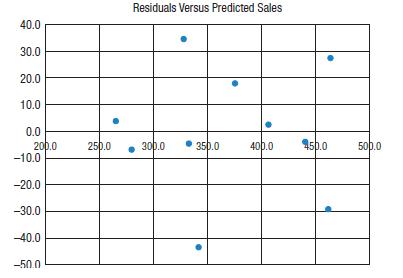
Here is a scatterplot of the residuals for the linear model found in For Example: “A linear model for retail expansion across Canada” plotted against the predicted values:QUESTION: Show how the plotted values were calculated. What patterns do you see in the plot? What conclusions do you draw?
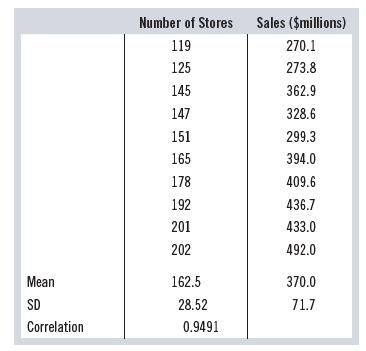
As a retailer expands across Canada, its sales increase. Here are some data on sales and number of stores over the last 10 years, including the means, standard deviations, and correlation coefficient:QUESTION: Obtain and interpret a linear model to estimate sales from the number of stores. Number
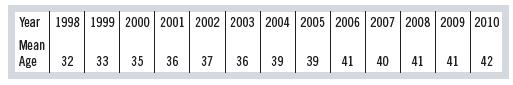
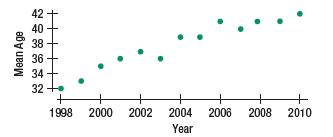
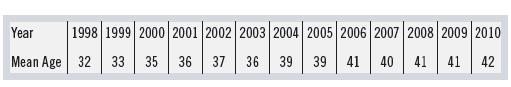
“Finding the correlation coefficient for cycling accidents”Cycle/car accidents are a serious concern for insurance companies.Here are data on the mean age of cyclists killed each year in the United States during the decade from 1998 to 2010:Here is a scatterplot of the data:QUESTION: The data
When examining the ages of victims in cycle/car accidents, why does it make the most sense to plot Year on the x-axis and Mean Age on the y-axis?
Cycle/car accidents are a serious concern for insurance companies. About 53,000 cyclists have died in traffic crashes in the United States since 1932. Demographic information such as this is often available from government agencies. It can be useful to insurers, who use it to set appropriate rates,
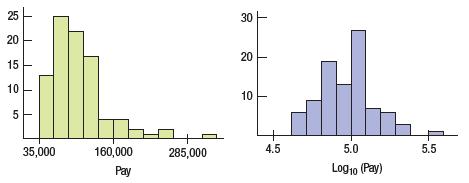
Every year Fortune magazine publishes a list of the 100 best companies to work for. One statistic often looked at is the average annual pay for the most common job title at the company. Here’s a histogram of the average annual pay values and a histogram of the logarithm of the pay values. Which
Advertising. A company that distributes a variety of pet foods is planning its next advertising campaign.Since different publications are read by different market segments, the company would like to know how pet ownership is distributed across different income segments.The U.S. Census Bureau
Ipsos’s Canadian media landscape. This study captures the daily activities of Canadians to show marketers what opportunities they have to present their messages. It finds that, in an average day, adult Canadians divide their time as follows:Time Spent (hours) Activity 5.8 Engaging with media
Downtown parking. In the downtown area of a city, a condo building has 100 households. Eighteen percent of these households have 1 car and 4% have 2 cars. The rest have no cars.Represent the information given above using a stacked bar graph in which the vertical axis isa) the number of householdsb)
Department store. A department store is planning its next advertising campaign. Since different publications are read by different market segments, it would like to know if it should be targeting specific age segments. The results of a marketing survey are summarized in the following table by Age
Canadian airports. Canadian governments have leased their major airports to a private sector interest that needs to make a profit from their operation. Apart from fees from airlines, non-aeronautical income percentages are shown below. Due to the popularity of ride hailing, airport operators are
MBAs, part 2.A university reported the following data on the gender of its students in its two MBA programs:Gender Type Full-Time Part-Time Total Men 116 66 182 Women 48 38 86 Total 164 104 268a) What percentage of all MBA students were women?b) What percentage of full-time MBAs were women?c) What
Canadian reportable accidents. Accidents in Canada involving dangerous goods must be reported to the government and are recorded by Statistics Canada. Set out below is a summary of the number of such accidents in four selected provinces during 2016:Road Rail Air Facility Quebec 11 0 0 14 Ontario 15
Movie ratings. The movie ratings system is a voluntary system operated jointly by the Motion Picture Association of America (MPAA) and the National Association of Theatre Owners (NATO). The ratings themselves are given by a board of parents who are members of the Classification and Ratings
MBAs, part 1.A survey of the entering MBA students at a university in Canada classified the country of origin of the students, as seen in the table.Origin MBA Program Two-Year MBA Evening MBA Total Asia/Pacific Rim 31 33 64 Europe 5 0 5 Latin America 20 1 21 Middle East/Africa 5 5 10 North America
Transport injuries in Canada. The table below shows the number of deaths in Canada from some forms of transport accidents by gender, in 2016:Males Females Pedestrian 204 154 Pedal Cyclist 51 18 Motorcyclist 167 26 Car Occupant 274 167 Bus Occupant 0 2 Source: Statistics Canada, Deaths by Cause,
New product. A company started and managed by Business students is selling campus calendars. The students have conducted a market survey with the various campus constituents to determine sales potential and identify which market segments should be targeted. (Should they advertise in the alumni
Stock performance. The following table displays information for 470 of the S&P 500 stocks on how their oneday change on one specific day compared with their year to date performance up to that specific day.Specific day Year to Date Positive Change Negative Change Positive Change 164 233 Negative
Printing textbooks. A publisher sells textbooks on a broad range of subjects to Canadian university students.The students purchase online access to the book and associated materials, and can optionally order a printed copy of the book at an extra charge. The percentage of students ordering the
International unemployment rates. The table below gives the unemployment rate according to stats.oecd.org for selected countries. Create a graphical representation of these data that facilitates comparison among the countries, and state your reason for your choice of graph compared with another
International comparison of government debt. The government net financial liabilities as a percentage of GDP is given in the table below for selected countries according to stats.oecd.org. Present these data in a graph that allows you to compare the results among the countries. Give your reason for
Nuclear reactors around the world. The number of nuclear reactors that were operational in selected countries in 2014 is given in the table below, together with the number of additional nuclear reactors under construction or planned as of the same date.Operational Under Construction or Planned
International natural gas reserves and resources. Countries divide natural gas into reserves (the amount economically extractable at current prices) and resources (the amount technically extractable if the price is high enough).Reserves and resources are given in the table below in trillion cubic
Multinational exports. The exports of a multinational company from four of the countries in which it operates are given in the table.Country Debt Britain £1.4 bn Canada 1.2 $CDN bn Japan 10.5 ¥ bn United States 17.6 $US bn In what way do you need to transform these data before making a chart that
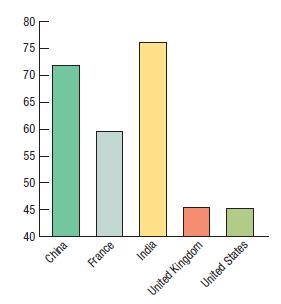
Importance of power. In the same survey discussed in Exercise 27, GfK Roper Consulting also asked, “How important is having control over people and resources to you?” The percentages of people who responded that it was of more than average importance are given in the following table:a) List the
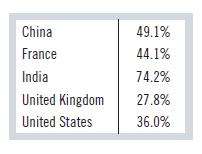
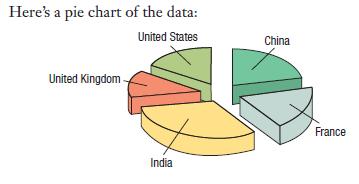
Importance of wealth. GfK Roper Reports Worldwide surveyed people in 2004, asking them, “How important is acquiring wealth to you?” The percentage of people who responded that it was of more than average importance were: 71.9% China, 59.6% France, 76.1% India, 45.5%United Kingdom, and 45.3%
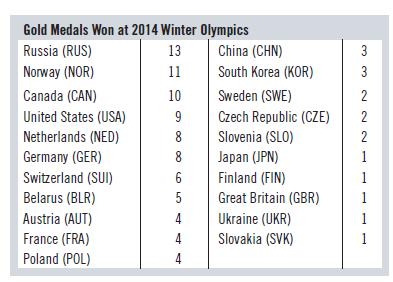
Winter Olympics. Twenty-one countries won gold medals in the 2014 Winter Olympics. The following table lists the countries, along with the total number of medals each won:a) Try to make a display of these data. What problems do you encounter?b) Can you find a way to organize the data so that the
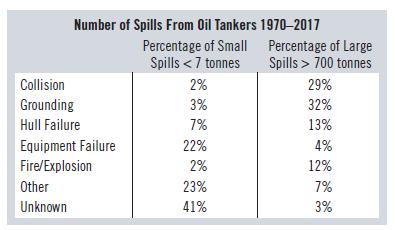
Environmental hazard. Data from the International Tanker Owners Pollution Federation Limited (www.itopf.com) give the cause of spillage for small and large oil tanker accidents for 1970–2017. Draw a graph comparing the causes of small spills with the causes of large spills. Give a reason for your
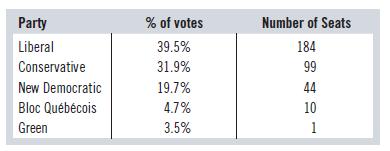
Canadian election results, part 2.In the 2015 Canadian federal election, the number of seats and the percentage of votes were divided among the parties as follows:a) Draw a graph of this data that allows you to compare the percentage of seats with the percentage of votes for each party.b) Comment
Small business productivity. A survey asked small business owners. “How difficult or easy do you think it will be for your company to obtain credit when you need it?” The business owners answered as follows: 22% said “Very difficult”;21% “Somewhat difficult”; 28% “About average”;11%
Mattel. In a recent annual report, Mattel Inc. reported that its domestic market sales were broken down as follows:49.6% Mattel Girls and Boys brand; 36.1% Fisher-Price brand; and the rest of Mattel’s over $3.5 billion revenues were due to its American Girl brand. Create an appropriate graphical
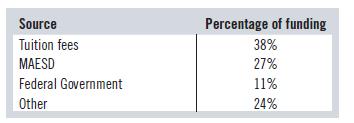
Ontario university funding. In Ontario, the Ministry of Advanced Education and Skills Development (MAESD)partially funds universities, plus a large proportion of the funding comes from other sources, notably tuition fees as shown in the table.Suppose that in future MAESD chooses to concentrate its
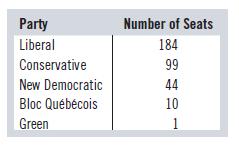
Canadian election results, part 1.In the 2015 Canadian federal election, the number of seats was divided among the parties as shown in the table in the next column. The Liberals won the election, forming a majority government, i.e., even if all the other parties voted against them, they could not
Plastic pollution. Of the 8.3bn tonnes of plastic produced during the past 65 years, 2.5bn is still in use and 5.8bn was used once. After that single use, 0.1bn was recycled and is part of the 2.5bn still in use, 0.8bn was incinerated, and 4.9bn was discarded. Draw a pie chart to represent this
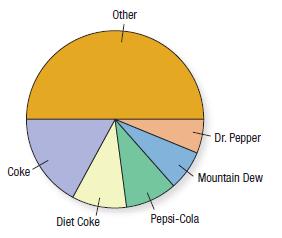
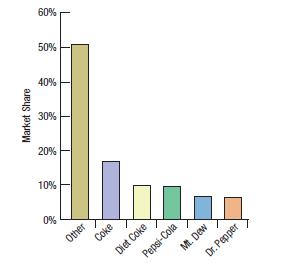
World market share, part 3.Here’s a pie chart of the data in Exercise 16:a) Which display of these data is best for comparing the market shares of these companies? Explain.b) Does Mountain Dew or Dr. Pepper have a bigger market share? Is that comparison easier to make with the pie chart or the
Market share, part 2.Here’s a bar chart of the data in Exercise 15:a) Compared to the pie chart in Exercise 15, which is better for displaying the relative portions of market share? Explain.b) What is missing from this display that might make it misleading? (Source: Based on Pepsi Thirsty for a
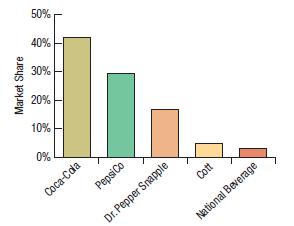
World market share, part 1.The Wall Street Journal article described in Exercise 15 also indicated the market share for leading brands of carbonated beverages worldwide. The following bar chart displays the valuesa) Is this an appropriate display for these data? Explain.b) Which company had the
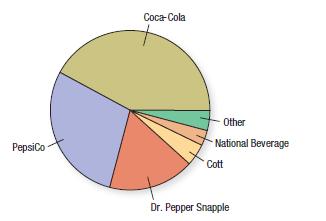
U.S. market share. An article in The Wall Street Journal(March 18, 2011) reported the 2010 U.S. market share of leading sellers of carbonated drinks, as summarized in the following pie chart:a) Is this an appropriate display for these data? Explain.b) Which company had the largest share of the
Tables in the news, part 2.Find a contingency table of categorical data from a business publication (e.g., The Economist, The Globe and Mail, The Wall Street Journal, etc.).a) Is the table clearly labelled?b) Does it display percentages or counts?c) Does the accompanying article identify the Five
Tables in the news, part 1.Find a frequency table of categorical data from a business publication (e.g., The Economist, The Globe and Mail, The Wall Street Journal, etc.).a) Is the table clearly labelled?b) Does it display percentages or counts?c) Does the accompanying article identify the Five
Graphs in the news, part 2.Find a pie chart of categorical data from a business publication (e.g., The Economist, The Globe and Mail, The Wall Street Journal, etc.).a) Is the graph clearly labelled?b) Does it violate the area principle?c) Does the accompanying article identify the Five W’s of the
Graphs in the news, part 1.Find a bar graph of categorical data from a business publication (e.g., The Economist, The Globe and Mail, The Wall Street Journal, etc.).a) Is the graph clearly labelled?b) Does it violate the area principle?c) Does the accompanying article identify the Five W’s of the
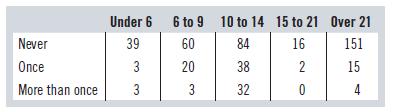
For the table in Exercise 8,a) Find the column percentages.b) Looking at the column percentages in (a), does the distribution of how many times someone has seen the movie look the same for each age group? Comment brief y.c) Make a stacked bar chart showing the distribution of viewings for each age
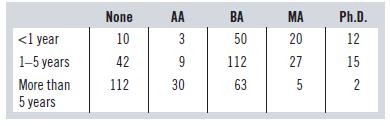
For the table in Exercise 7,a) Find the column percentages.b) Looking at the column percentages in (a), does the tenure distribution (how long the employee has been with the company) for each educational level look the same? Comment brief ly.c) Make a stacked bar chart showing the tenure
In addition to their age levels, the movie audiences in Exercise 2 were asked if they had seen the movie before(Never, Once, More than Once). Here’s a table showing the responses by age group:a) Find the marginal distribution of their previous viewing of the movie. (Hint: Find the row totals.)b)
From Exercise 1, we also have data on how long each person has been with the company (tenure) categorized into three levels: less than one year, between one and five years, and more than five years. A table of the two variables together looks like this:a) Find the marginal distribution of the
For the educational levels described in Exercise 1:a) Write two to four sentences summarizing the distribution.b) What conclusions, if any, could you make about the educational levels of employees at other companies?
As a member of the human resource group of your company, you are asked to summarize the educational levels of the 512 employees in your division. From company records, you find that 164 have no degree (None), 42 have a community college diploma (AA), 225 have a bachelor’s degree (BA), 52 have a
An established Canadian bank wanted to get its employees’ opinions about an internal reorganization it had implemented in order to compete with new financial institutions (sometime called FinTech organizations) that operate entirely online. It wants to choose a representative sample of employees.
During the Canadian census, most Canadians complete a “Short Form” which is the government’s primary source of demographic data. Some Canadians are selected at random to complete a “Long Form” which also provides information on social and economic factors. In the 2011 census, the “Long
A manufacturing company employs 14 project managers, 48 forepersons, and 377 labourers. In an effort to keep informed about any possible sources of employee discontent, management wants to conduct job satisfaction interviews with a simple random sample of employees every month.a) Do you see any
Between quarterly audits, a company likes to check on its accounting procedures to address any problems before they become serious. The accounting staff processes payments for at most 120 orders each day. The next day, the supervisor rechecks 10 of the transactions to make sure they were processed
Improve the following survey questions by rephrasing them. State what was wrong with the original question.a) How small was your Airbnb room?b) Should parents concerned about their child's safety buy this child car seat?c) After last summer's heat wave, do you believe global warming is real?
A market research company wants to survey commercial building managers as to whether they plan to install solar power on the roof of their building in the next five years. The profitability of such installations is higher in provinces with higher prices for purchasing electricity from the electric
Showing 200 - 300
of 8575
1
2
3
4
5
6
7
8
9
10
11
12
13
14
15
Last
Step by Step Answers