New Semester
Started
Get
50% OFF
Study Help!
--h --m --s
Claim Now
Question Answers
Textbooks
Find textbooks, questions and answers
Oops, something went wrong!
Change your search query and then try again
S
Books
FREE
Study Help
Expert Questions
Accounting
General Management
Mathematics
Finance
Organizational Behaviour
Law
Physics
Operating System
Management Leadership
Sociology
Programming
Marketing
Database
Computer Network
Economics
Textbooks Solutions
Accounting
Managerial Accounting
Management Leadership
Cost Accounting
Statistics
Business Law
Corporate Finance
Finance
Economics
Auditing
Tutors
Online Tutors
Find a Tutor
Hire a Tutor
Become a Tutor
AI Tutor
AI Study Planner
NEW
Sell Books
Search
Search
Sign In
Register
study help
business
elementary statistics
Elementary Statistics 4th Edition William Navidi , Barry Monk - Solutions
Which factors are significant at the α = 0.05 level?
For the P-values that are less than 0.05, use the Bonferroni adjustment to adjust them for the fact that several tests have been performed.
For each factor, describe how strong the evidence is that the proportions differ for that factor.
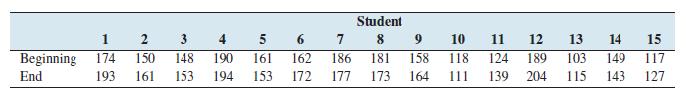
Freshman weights: Do college students tend to gain or lose weight during their freshman year? Following are a sample of weights of 15 college freshmen at the beginning and at the end of their freshman year.Can you conclude that the median weight at the end of the year differs from the median at the
Keep cool: Following are the prices, in dollars, of a sample of 20 air conditioners.Can you conclude that the median price differs from $300? Use the α = 0.01 level of significance. 377 559 430 490 352 343 500 203 223 239 326 503 491 194 330 381 337 433 421 287
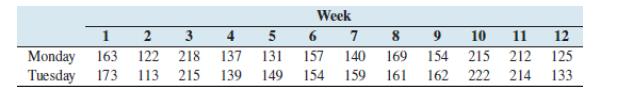
Slow Mondays: The owner of a restaurant believes that she serves the same number of customers on Mondays as on Tuesdays. For 12 weeks she counts the number of customers who come in on Monday and on Tuesday, with the following results.Can you conclude that the median number of customers differs
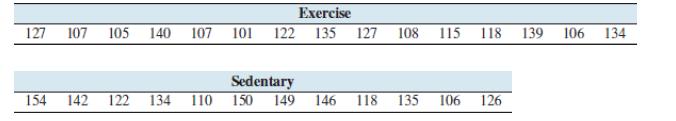
Exercise and blood pressure: Systolic blood pressure, in millimeters of mercury, was measured for a sample of 15 subjects who reported exercising regularly and for a sample of 12 patients who reported having a sedentary lifestyle. The results were as follows.Can you conclude that the median
Scoring runs: Following are the number of runs scored by both teams in a sample of 20 Major League Baseball games played in a recent season.Can you conclude that the median is different from 8? Use the α = 0.05 level of significance. 8 6 11 3 5 1 8 13 16 6 4 10 17 16 22 15 10 8 10 2
Recovery times: The number of days spent in the hospital was determined for 12 patients who underwent coronary bypass surgery.Can you conclude that the median is less than 5 days? Use the α = 0.01 level of significance. 7 10 4 10 6 8 588346
Boys and girls: Following are weights, in pounds, for samples of 16 newborn boys and 14 newborn girls.Can you conclude that the median weight differs between boys and girls?Use the α = 0.01 level of significance. 8.3 7.8 8.2 8.0 8.8 8.4 Boys 8.5 7.9 7.5 7.0 6.6 6.4 5.9 6.7 7.4 7.6 Girls 7.7 8.8
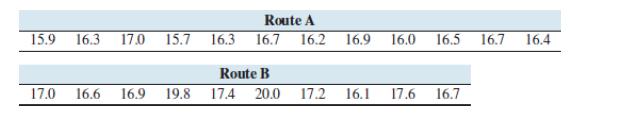
Morning commute: A woman who has moved into a new house is trying to determine which of two routes to work has the shorter driving time. Times in minutes for 12 trips on route A and 10 trips on route B are presented below.Can you conclude that the median time differs between the two routes? Use the
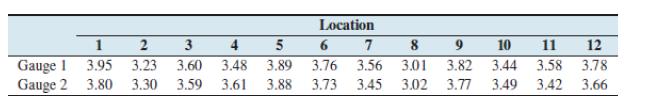
Tire tread: Two gauges that measure tire tread depth were compared. Twelve different locations on a tire were measured once by each gauge. The results, in millimeters, were as follows.Can you conclude that the median measurement differs between the gauges?Use the α = 0.05 level of significance.
How much is in that can? A machine that fills beverage cans is supposed to put 12 ounces of beverage in each can. Following are the amounts measured in a sample of 14 cans.Can you conclude that the median amount differs from 12 ounces? Use the α= 0.01 level of significance. 12.00 11.97 11.93 12.02
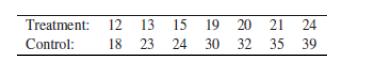
Rank-sum test and t-test: The following data, taken from Exercise 12 in Section 11.1, are recovery times for seven patients who received a new postsurgical treatment and seven others (the controls) who received the standard treatment. Assume the populations are symmetric, so that their means and
Can you conclude at the α = 0.05 level that the median number of species is greater for a retention time of 12 days than for a retention time of 3 days?Compute the appropriate test statistic, find the P-value, and state a conclusion.
Can you conclude at the α = 0.05 level that the median number of species is greater for a retention time of 30 days than for a retention time of 3 days?Compute the appropriate test statistic, find the P-value, and state a conclusion.
Based on the results of the tests performed in Exercises 1–3, which of the following is the best conclusion?i. We can conclude that the median number of species increases as the solids retention time increases from 3 to 12 and from 12 to 30 days.ii. We cannot conclude that the median number of
How many degrees of freedom are there for SSTr and for SSE?
Compute the sums of squares SSTr and SSE and the mean squares MSTr and MSE.
Compute the value of the test statistic F.
Can you conclude that there are differences in mean GPA among the majors? Use the α = 0.05 level of significance.
Can you reject the null hypothesis of no interactions? Explain.
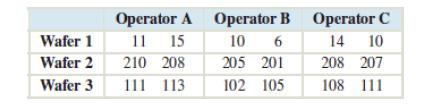
Can the main effect of operator on the number of parts produced be interpreted? If so, interpret the main effect, using the α = 0.05 level of significance. If not, explain why not.
Can the main effect of machine on the number of parts produced be interpreted? If so, interpret the main effect, using the α = 0.05 level of significance. If not, explain why not.
Can you reject the null hypothesis of no interactions? Explain.
Can the main effect of gender on weight loss be interpreted? If so, interpret the main effect, using the α = 0.01 level of significance. If not, explain why not.
Can the main effect of diet on weight loss be interpreted? If so, interpret the main effect, using the α = 0.01 level of significance. If not, explain why not.
Soil quality: Using the data in Exercise 1, can you conclude that the pH differs with the amount of gypsum added? Use the α = 0.05 level of significance.
Electrical conductor: The scientists referred to in Exercise 1 also considered the effect of gypsum on the electrical conductivity (in decisiemens per meter) of soil. Two types of soil were treated with three different amounts of gypsum. The results are as follows.a. Can you reject the hypothesis
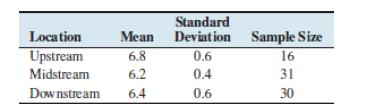
Chemicals in the water: Earth scientists measured several chemical properties in water samples taken from wells at three locations.Following are sample means, standard deviations, and sample sizes for pH measurements.a. What are the sample sizes n1, n2, n3?b. What are the sample standard deviations
Chemicals in the water: Using the data in Exercise 4, perform the Tukey–Kramer test to determine which pairs of means, if any, differ.Use the α = 0.05 level of significance.
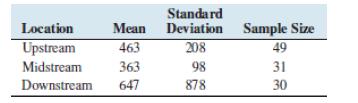
Electrical conductor: The scientists referred to in Exercise 3 measured electrical conductivity (in microsiemens per centimeter) in several water samples. Following are sample means, standard deviations, and sample sizes.Can a one-way ANOVA be used to determine whether conductivity varies with
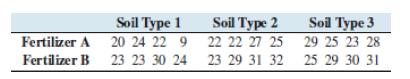
Orange trees: An agricultural scientist wants to determine how the type of fertilizer and the type of soil affect the yield of oranges in an orange grove. He has two types of fertilizer and three types of soil. For each of the six combinations of fertilizer and soil, the scientist plants four
Orange trees: Construct and interpret an interaction plot for the data in Exercise 8.
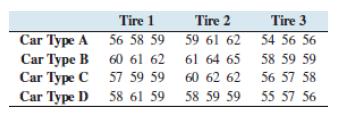
Car tires: Three brands of tires were tested on each of four makes of car. Three cars of each make were used. The number of miles traveled, in thousands, is given as follows for each car.a. Can you reject the hypothesis of no interactions? Explain.b. Can the main effect of car type on number of
Car tires: Construct and interpret an interaction plot for the data in Exercise 12.
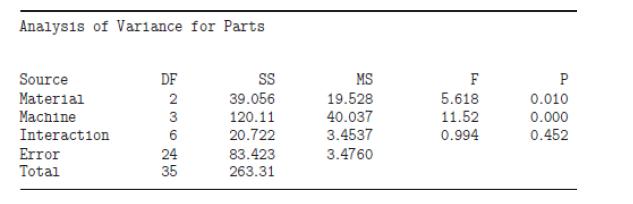
Quality control: Four machines are used with three different materials to fabricate a certain part. Each combination of machine and material is run for three days, and the number of satisfactory parts made each day is counted. A two-way ANOVA is performed to determine whether the mean number of
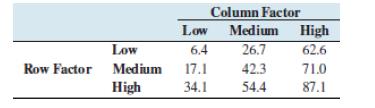
Interactions: The following table presents the cell means for a twoway ANOVA. Construct and interpret an interaction plot. Low Column Factor Medium High Low 6.4 26.7 62.6 Row Factor Medium 17.1 42.3 71.0 High 34.1 54.4 87.1
Lines and majors: Each student draws a line by eye on a sheet of paper and tries to make the length as close to 3 inches as possible. Each student’s line is measured. Record each student’s major, and for each major, list the true lengths of the lines drawn by students with that major. Then
Lines and semesters: Same as Activity 1, but determine whether the mean length of the lines varies with the number of semesters or quarters the student has completed.
Can it be determined from the ANOVA table whether there are differences in the measured weights among the operators? If so, provide the value of the test statistic and the P-value. If not, explain why not.
Construct an ANOVA table.It turned out that the measurements made by operator B were taken shortly after the balance had been powered up, while the others were taken after the balance had been powered up for some time. A new policy was then instituted to leave the balance powered up continuously.
Compare the ANOVA table in Exercise 3 with the ANOVA table in Exercise 1.Would you recommend leaving the balance powered up continuously? Explain your reasoning.It turned out that the measurements made by operator B were taken shortly after the balance had been powered up, while the others were
Find the area under the standard normal curvea. To the left of z = 1.77b. To the right of z = 0.41c. Between z = − 2.12 and z = 1.37
Find the z-score that hasa. An area of 0.33 to its leftb. An area of 0.79 to its right
Find the z-scores that bound the middle 80% of the area under the normal curve.
Find z0.15.
Suppose that salaries of recent graduates from a certain college are normally distributed with mean μ = $42,650 and standard deviation σ =$3800. What two salaries bound the middle 50%?
A normal population has mean μ = 242 and standard deviation σ = 31.a. What proportion of the population is greater than 233?b. What is the probability that a randomly chosen value will be less than 249?
Suppose that in a bowling league, the scores among all bowlers are normally distributed with mean μ = 182 points and standard deviation σ= 14 points. A trophy is given to each player whose score is at or above the 97th percentile. What is the minimum score needed for a bowler to receive a trophy?
A population has mean μ = 193 and standard deviation σ = 42.Compute and for samples of size n = 64.
A sample of size n = 55 is drawn from a population with proportion p =0.34. Let be the sample proportion. a. Find and op b. Find P(p>0.21).
Is it reasonable to treat the following sample as coming from an approximately normal population? Explain. 5.5 8.7 9.3 10.1 15.2 3.5 11.9 7.6 13.7 8.7 14.3 5.8
Defective rods: A grinding machine is used to manufacture steel rods, of which 5% are defective. When a customer orders 1000 rods, a package of 1060 rods is shipped, with a guarantee that at least 1000 of the rods are good. What is the probability that a package of 1060 rods contains 1000 or more
Explain why P(a < X
Converging to normality: Each student rolls two dice five times. Each time, record both the sum and the product of the numbers on the dice.Compute the mean and standard deviation of the five sums and of the five products. Construct histograms of the means of the sums and the means of the products.
Standard error of the mean: Each student rolls a single die 10 times, records the results, and computes the mean of the 10 values obtained.Construct a histogram of all the individual die rolls and another one of the sample means. Compute the standard deviation of the individual die rolls and the
Compute the sample mean and the sample standard deviation s.
Estimate the population mean μ with x and the population standard deviation σ with s. In other words, assume that the data are a sample from a normal population with mean μ = x and standard deviation σ = s.Under this assumption, what proportion of cans will fail at a pressure of 90 or less?
A second shipment of cans is received. Ten randomly sampled cans are tested with the following results.Explain why the second sample of cans is stronger than the first sample. Can 1 2 Pressure at failure 96 97 99 3w 3. 4 5 6 7 8 9 10 100 100 100 101 103 103 120
Compute the sample mean and the sample standard deviation s for the second sample.
A podcaster invites listeners to call the show to express their opinions about a political issue. How reliable is this survey? Explain.
Qualitative or quantitative? Is the number of points scored in a football game qualitative or quantitative?
Nominal or ordinal? Is the color of a phone nominal or ordinal?
Discrete or continuous? Is the area of a college campus discrete or continuous?
Which type of variable is it? A theater concession stand sells soft drink and popcorn combos that come in sizes small, medium, large, and jumbo. True or false:a. Size is a qualitative variable.b. Size is an ordinal variable.c. Size is a continuous variable.
Website ratings: A popular website is interested in conducting a survey of 400 visitors to the site in such a way that 200 of them will be under age 30, 150 will be aged 30–55, and 50 will be over 55.
Favorite performer: Viewers of a television show are asked to vote for their favorite performer by sending a text message to the show.
School days: A researcher selects 4 of 12 high schools in a certain region and surveys all of the administrative staff members in each school about a potential change in the ordering of supplies. Which type of sample does this represent?
Political polling: A pollster obtains a list of registered voters and uses a computer random number generator to choose 100 of them to ask which candidate they prefer in an upcoming election.
Fluoride and tooth decay: Researchers examine the association between the fluoridation of water and the prevention of tooth decay by comparing the prevalence of tooth decay in countries that have fluoridated water with the prevalence in countries that do not.a. Is this a randomized experiment or an
Better gas mileage: A rental company in a large city put a new type of tire with a special tread on a random sample of 50 cars, and the regular type of tire on another random sample of 50 cars. After a month, the gas mileage of each car was measured.a. Is this a randomized experiment or an
Phones and driving: Almost all states in the United States prohibit texting while driving, and several states prohibit all phone use while driving. To determine the extent to which using a phone increases the risk of a traffic accident, a researcher examines accident reports to obtain data about
Turn in your homework: The English department at a local college is considering using electronic-based assignment submission in its English composition classes. To study its effects, each section of the class is divided into two groups at random. In one group, assignments are submitted by turning
Which TV station do you watch? The TV columnist for a local newspaper invites readers to log on to a website to vote for their favorite TV newscaster.
Longevity: A life insurance company wants to study the life expectancy of people born in 1950. The company’s actuaries examine death certificates of people born in that year to determine how long they lived.
Political opinion: A congressman sent out questionnaires to 10,000 constituents to ask their opinions on a new health-care proposal. A total of 200 questionnaires were returned, and 70% of those responding supported the proposal.
Explain why each of the following questions is leading. Provide a more appropriate wording.a. Should Americans save more money or continue their wasteful spending?b. Do you support more funding for reputable organizations like the Red Cross?
Biased survey questions: Construct survey questions that exhibit the following types of bias: self-interest bias, social acceptability bias, and leading question bias. Then construct versions of each question in which the bias is reduced or eliminated.
Biased sampling: This activity requires a bag of 50 objects of two sizes, and a small scale. Assorted miniature candy bars can be used for the larger objects, while M&Ms or Skittles can be used for the smaller ones. The number of objects of each size is known; say there are 20 large ones and 30
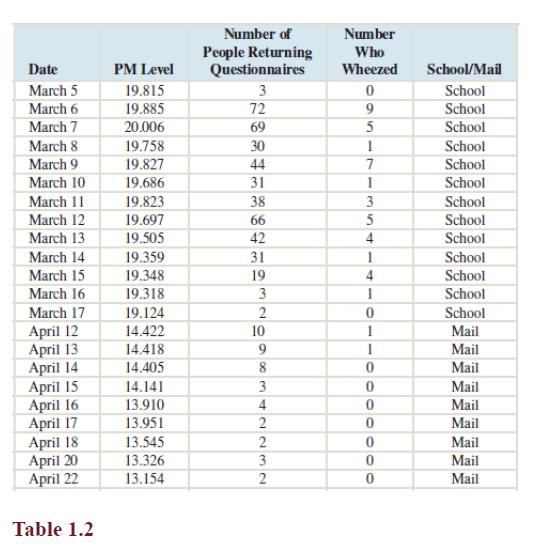
How many people had high exposure to PM?Air pollution is a serious problem in many places. One form of air pollution that is suspected to cause respiratory illness is particulate matter (PM), which consists of tiny particles in the air. Particulate matter can come from many sources, most commonly
How many of the high-exposure people had wheeze symptoms?Air pollution is a serious problem in many places. One form of air pollution that is suspected to cause respiratory illness is particulate matter (PM), which consists of tiny particles in the air. Particulate matter can come from many
What percentage of the high-exposure people had wheeze symptoms?Air pollution is a serious problem in many places. One form of air pollution that is suspected to cause respiratory illness is particulate matter (PM), which consists of tiny particles in the air. Particulate matter can come from many
How many people had low exposure to PM?Air pollution is a serious problem in many places. One form of air pollution that is suspected to cause respiratory illness is particulate matter (PM), which consists of tiny particles in the air. Particulate matter can come from many sources, most commonly
How many of the low-exposure people had wheeze symptoms?Air pollution is a serious problem in many places. One form of air pollution that is suspected to cause respiratory illness is particulate matter (PM), which consists of tiny particles in the air. Particulate matter can come from many sources,
What percentage of the low-exposure people had wheeze symptoms?Air pollution is a serious problem in many places. One form of air pollution that is suspected to cause respiratory illness is particulate matter (PM), which consists of tiny particles in the air. Particulate matter can come from many
Is there a large difference between the percentage of high-exposure people with wheeze symptoms and the percentage of low-exposure people with wheeze symptoms?Air pollution is a serious problem in many places. One form of air pollution that is suspected to cause respiratory illness is particulate
Explain why the percentage of high-exposure people with wheeze symptoms is the same as the percentage of school-return people with wheeze symptoms.Air pollution is a serious problem in many places. One form of air pollution that is suspected to cause respiratory illness is particulate matter (PM),
Explain why the percentage of low-exposure people with wheeze symptoms is the same as the percentage of mail-return people with wheeze symptoms.
As the weather gets warmer, PM goes down because wood stoves are used less. Explain how this causes the mode of response (school or mail) to be related to PM.Air pollution is a serious problem in many places. One form of air pollution that is suspected to cause respiratory illness is particulate
It is generally the case in epidemiologic studies that people who have symptoms are often eager to participate, while those who are unaffected are less interested. Explain how this may cause the mode of response (school or mail) to be related to the outcome.Air pollution is a serious problem in
Rather than send out questionnaires, the investigators could have telephoned a random sample of people over a period of days. Explain how this might have reduced the confounding.Air pollution is a serious problem in many places. One form of air pollution that is suspected to cause respiratory
Construct a relative frequency distribution for the data in Exercise 1.
Construct a frequency bar graph for the data in Exercise 1.
Construct a pie chart for the data in Exercise 1.
Construct a frequency polygon for the data in Exercise 7.
Construct a relative frequency ogive for the data in Exercise 7.
Following are the prices (in dollars) for a sample of espresso makers.Construct a back-to-back stem-and-leaf plot for these data and the data in Exercise 11. 99 50 31 65 50 99 70 40 25 56 30 77
Construct a dotplot for the data in Exercise 11.
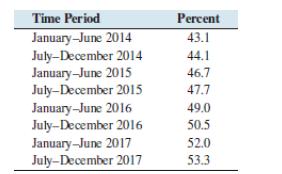
The following table presents the percentage of Americans who use a cell phone exclusively, with no landline phone, for the years 2014–2017.Construct a time-series plot for these data. Time Period Percent January-June 2014 43.1 July-December 2014 44.1 January-June 2015 46.7 July-December 2015 47.7
Showing 4900 - 5000
of 7930
First
43
44
45
46
47
48
49
50
51
52
53
54
55
56
57
Last
Step by Step Answers