New Semester
Started
Get
50% OFF
Study Help!
--h --m --s
Claim Now
Question Answers
Textbooks
Find textbooks, questions and answers
Oops, something went wrong!
Change your search query and then try again
S
Books
FREE
Study Help
Expert Questions
Accounting
General Management
Mathematics
Finance
Organizational Behaviour
Law
Physics
Operating System
Management Leadership
Sociology
Programming
Marketing
Database
Computer Network
Economics
Textbooks Solutions
Accounting
Managerial Accounting
Management Leadership
Cost Accounting
Statistics
Business Law
Corporate Finance
Finance
Economics
Auditing
Tutors
Online Tutors
Find a Tutor
Hire a Tutor
Become a Tutor
AI Tutor
AI Study Planner
NEW
Sell Books
Search
Search
Sign In
Register
study help
business
elementary statistics
Elementary Statistics 4th Edition William Navidi , Barry Monk - Solutions
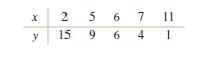
Compute the correlation coefficient for the following data set. x 256 7 11 y 15 9 6 4 1
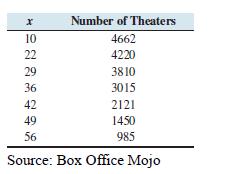
The number of theaters showing the movie Avengers: Endgame x days after its opening is presented in the following table. Number of Theaters 10 4662 22 4220 29 3810 36 3015 42 2121 49 1450 56 985 Source: Box Office Mojo
Use the data in Exercise 2 to compute the correlation between the number of days after the opening of the movie and the number of theaters showing the movie. Is the association positive or negative? Weak or strong?
A scatterplot has a correlation of r = − 1.Describe the pattern of the points.
In a survey of U.S. cities, it is discovered that there is a positive correlation between the number of paved streets in the city and the number of registered cars.Does this mean that paving more streets in the city will result in an increase in the number of registered cars? Explain.
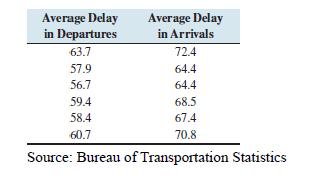
The following table presents the average delay in minutes for departures and arrivals of domestic flights at O’Hare Airport in Chicago for selected years.Compute the least-squares regression line for predicting the delay in arrival time from the delay in departure time. Average Delay in
Use the least-squares regression line computed in Exercise 6 to predict the average delay in arrival time in a year when the average delay in departure time is 58.5 minutes.
Use the least-squares regression line computed in Exercise 6 to compute the residual for the year when the average delay in departure time was 58.4 minutes and the average delay in arrival time was 67.4 minutes.
Refer to Exercise 6.If the average delay in departure times differs by 2 minutes from one year to the next, by how much would you predict the average delay in arrival times to change?
A scatterplot has a least-squares regression line with a slope of 0.What is the correlation coefficient?
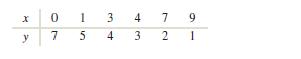
Compute the least-squares regression line for the following data set. x 0 1 y 7 3 4 7 9 5 4 3 2 1
Two lines are drawn on a scatterplot. The sum of squared residuals for line A is 558.2, and the sum of squared residuals for line B is 723.1. Which of the following is true about the sum of squared residuals for the least-squares regression line?i. It will be greater than 723.1.ii. It will be
A sample of students was studied to determine the relationship between sleeping habits and classroom performance. The least-squares regression line for predicting the score on a standardized exam from hours of sleep was computed to be , where x is the number of hours of sleep and ŷ is the
In a scatterplot, the point (—2, 7) is influential. If this point is removed from the scatterplot, which of the following describes the effect on the least-squares regression line?i. It will shift its position by a substantial amount.ii. It will shift its position slightly.iii. It will not shift
The correlation coefficient for a data set is r = − 0.6. How much of the variation in the outcome variable is explained by the least-squares regression line?
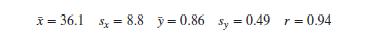
Predicting height: The heights (y) and lengths of forearms (x) were measured in inches for a sample of men. The following summary statistics were obtained:a. Compute the least-squares regression line for predicting height from forearm length.b. Joe’s forearm is 1 inch longer than Sam’s. How
How much wood is in that tree? For a sample of 12 trees, the volume of lumber(y) (in cubic meters) and the diameter (x) (in centimeters) at a fixed height above ground level was measured. The following summary statistics were obtained:a. Compute the least-squares regression line for predicting
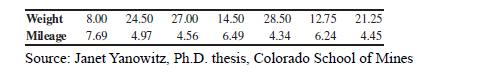
How’s your mileage? Weight (in tons) and fuel economy (in mpg) were measured for a sample of seven diesel trucks. The results are presented in the following table.a. Compute the least-squares regression line for predicting mileage from weight.b. Construct a residual plot. Verify that a linear
How’s your mileage? Using the data in Exercise 3:a. Compute the correlation coefficient between weight and mileage.b. Compute the coefficient of determination.c. How much of the variation in mileage is explained by the least-squares regression line?
Energy efficiency: A sample of 10 households was monitored for one year. The household income (in $1000s) and the amount of energy consumed (in 1010 joules) were determined. The results follow.a. Compute the least-squares regression line for predicting energy consumption from income.b. Construct a
Energy efficiency: Using the data in Exercise 5:a. Compute the correlation coefficient between income and energy consumption.b. Compute the coefficient of determination.c. How much of the variation in energy consumption is explained by the leastsquares regression line?
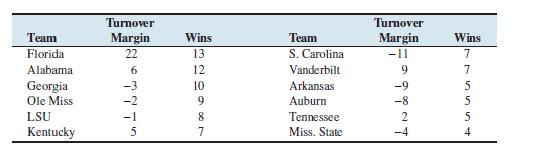
Pigskin: In football, a turnover occurs when a team loses possession of the ball due to a fumble or an interception. Turnovers are bad when they happen to your team, but good when they happen to your opponent. The turnover margin for a team is the difference (Turnovers by opponent – Turnovers by
Pigskin: Using the data in Exercise 7:a. Compute the correlation coefficient between turnover margin and wins.b. Compute the coefficient of determination.c. How much of the variation in wins for this SEC college football season is explained by the least-squares regression line?
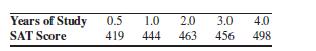
SAT scores: The following table presents the number of years of study in English and language arts and the average SAT writing score for students who took the SAT exam.a. Compute the least-squares regression line for predicting mean SAT score from years of study.b. Construct a residual plot. Verify
SAT scores: Using the data in Exercise 9:a. Compute the correlation coefficient between years of study and SAT score.b. Compute the coefficient of determination.c. How much of the variation in SAT score is explained by the least-squares regression line?
Baby weights: The average gestational age (time from conception to birth) of a newborn infant is about 40 weeks. The following table presents the gestational age (in weeks) and corresponding mean birth weight (in pounds) for female infants born in Canada.a. Compute the least-squares regression line
Commute times: Every morning, Tania leaves for work a few minutes after 7:00 A.M. For eight days, she keeps track of the time she leaves (the number of minutes after 7:00) and the number of minutes it takes her to get to work. Following are the results.a. Construct a scatterplot of the length of
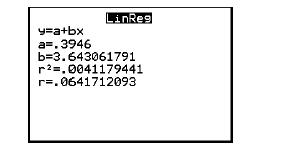
Interpret technology: The following display from the TI-84 Plus calculator presents the results from computing a least-squares regression line.a. Write the equation of the least-squares regression line.b. Predict the value of y when the x-value is 10.c. What is the correlation between x and y?d. Is
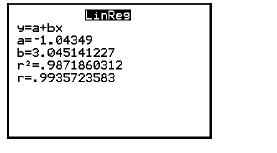
Interpret technology: The following display from the TI-84 Plus calculator presents the results from computing a least-squares regression line.a. Write the equation of the least-squares regression line.b. Predict the value of y when the x-value is 50.c. What is the correlation between x and y?d. Is
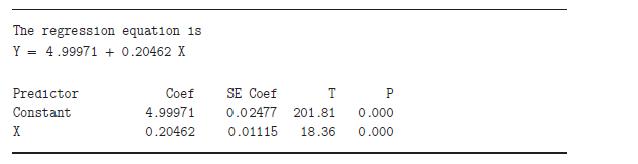
Interpret technology: The following output from MINITAB presents the results from computing a least-squares regression line.a. Write the equation of the least-squares regression line.b. Predict the value of y when the x-value is 25. The regression equation is Y = 4.99971 +0.20462 X Predictor
Describe an example in which two variables are strongly correlated, but changes in one do not cause changes in the other.
Two variables x and y have a positive association if large values of x are associated with large values of y. Write an equivalent definition that describes what small values of x are associated with. Then write a definition for negatively associated random variables that describes what small values
Explain why the predicted value is always equal to when r = 0.
If the slope of the least-squares regression line is negative, can the correlation coefficient be positive? Explain why or why not.
Describe conditions under which the slope of the least-squares line will be equal to the correlation coefficient.
Describe circumstances under which the sum of the squared residuals will equal zero. What conclusions can be drawn about the least-squares regression line in this case?
Explain why extrapolation may lead to unreliable results.
Explain how it is possible for a point to be an outlier without being an influential point.
Consider the case where there are only two ordered pairs in the data set. What must be true about the residuals?
Causation, or just correlation? Think of some quantities that have been increasing over time (e.g., population) and some that have been decreasing (e.g., the value of a used car). Any two quantities that have been moving in the same direction will be positively correlated, and any two that have
Heights and forearms: For each student, measure both height and forearm length. Compute the correlation between them. Now compute the correlation separately for men and for women. Are the separate correlations higher or lower than the correlation for the whole data set? Why? Draw a scatterplot of
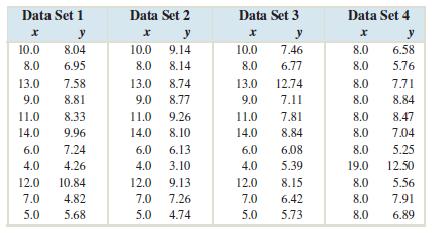
Anscombe’s quartet: Statistician Francis Anscombe developed four data sets that demonstrate the importance of graphing data in addition to computing the correlation and least-squares line. Following are the data sets. Verify that the correlations and least-squares lines are the same for each, to
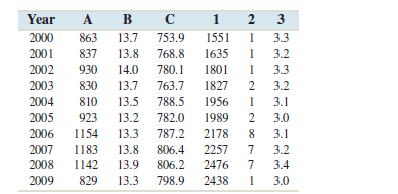
Correlation is definitely not causation: Following are six data sets, collected during each of the years 2000—2009. Each of the first three is highly correlated with one of the second three. Can you guess which is correlated with which?A. German passenger cars sold in the United States (in
Construct a scatterplot of unemployment (y) versus inflation (x). Do you detect any strong nonlinearity?
Compute the least-squares line for predicting unemployment from inflation.
Predict the unemployment in a year when inflation is 3.0%.
Compute the correlation coefficient between inflation and unemployment.
What proportion of the variance in unemployment is explained by inflation?
Compute the least-squares line for predicting next year’s unemployment from this year’s inflation.
Predict next year’s unemployment if this year’s inflation is 3.0%.
Compute the correlation coefficient between this year’s inflation and next year’s unemployment.
What proportion of the variance in next year’s unemployment is explained by this year’s inflation?If we are going to use data from this year to predict unemployment next year, why not use this year’s unemployment to predict next year’s unemployment? A model like this, in which previous
Compute the least-squares line for predicting next year’s unemployment from this year’s unemployment.
Predict next year’s unemployment if this year’s unemployment is 4.0%.
Compute the correlation coefficient between this year’s unemployment and next year’s unemployment.
What proportion of the variance in next year’s unemployment is explained by this year’s unemployment?
Which of the three models do you think provides the best prediction of unemployment, the one using inflation in the same year, the one using inflation in the previous year, or the one using unemployment in the previous year? Explain.
The U.S. economy was in recession during part of 1991, most of 2001, and from December 2007 through June 2009. Compute the residuals for the least-squares line found in Exercise
During times of recession, does the least-squares line predict the following year’s unemployment well? Does it tend to overpredict or underpredict?
Fill in the blank: The probability that a fair coin lands heads is 0.5.Therefore, we can be sure that if we toss a coin repeatedly, the proportion of times it lands heads will _________.i. approach 0.5 ii. be equal to 0.5 iii. be greater than 0.5 iv. be less than 0.5
A pollster will draw a simple random sample of voters from a large city to ask whether they support the construction of a new light rail line.Assume that there are one million voters in the city, and that 560,000 of them support this proposition. One voter is sampled at random.a. Identify the
State each of the following rules:a. General Addition Ruleb. Addition Rule for Mutually Exclusive Eventsc. Rule of Complementsd. General Multiplication Rulee. Multiplication Rule for Independent Events
The following table presents the results of a survey in which 400 college students were asked whether they listen to music while studying.a. Find the probability that a randomly selected student does not listen to music while studying.b. Find the probability that a randomly selected student listens
Which of the following pairs of events are mutually exclusive?i. A: A randomly chosen student is 18 years old. B: The same student is 20 years old.ii. A: A randomly chosen student owns a red car. B: The same student owns a blue car.
In a group of 100 teenagers, 61 received their driver’s license on their first attempt on the driver’s certification exam and 18 received their driver’s license on their second attempt. What is the probability that a randomly selected teenager received their driver’s license on their first
A certain neighborhood has 100 households. Forty-eight households have a dog as a pet. Of these, 32 also have a cat. Given that a household has a dog, what is the probability that it also has a cat?
The owner of a bookstore has determined that 80% of people who enter the store will buy a book. Of those who buy a book, 60% will pay with a credit card. Find the probability that a randomly selected person entering the store will buy a book and pay for it using a credit card.
A jar contains 4 red marbles, 3 blue marbles, and 5 green marbles. Two marbles are drawn from the jar one at a time without replacement. What is the probability that the second marble is red, given that the first was blue?
A student is chosen at random. Which of the following pairs of events are independent?i. A: The student was born on a Monday. B: The student’s mother was born on a Monday.ii. A: The student is above average in height. B: The student’s mother is above average in height.
Individual plays on a slot machine are independent. The probability of winning on any play is 0.38. What is the probability of winning 3 plays in a row?
Refer to Exercise 11.Suppose that the slot machine is played 5 times in a row. What is the probability of winning at least once?
The Roman alphabet (the one used to write English) consists of five vowels (a,e, i, o, u), along with 21 consonants (we are considering y to be a consonant). Gregory needs to make up a computer password containing seven characters. He wants the first six characters to alternate—consonant, vowel,
A caterer offers 24 different types of dessert. In how many ways can 5 of them be chosen for a banquet if the order doesn’t matter?
In a standard game of pool, there are 15 balls labeled 1 through 15.a. In how many ways can the 15 balls be ordered?b. In how many ways can 3 of the 15 balls be chosen and ordered?
Colored dice: A six-sided die has one face painted red, two faces painted white, and three faces painted blue. Each face is equally likely to turn up when the die is rolled.a. Construct a sample space for the experiment of rolling this die.b. Find the probability that a blue face turns up.
How are your grades? There were 30 students in last semester’s statistics class. Of these, 6 received a grade of A, and 12 received a grade of B. What is the probability that a randomly chosen student received a grade of A or B?
Statistics, anyone? Let S be the event that a randomly selected college student has taken a statistics course, and let C be the event that the same student has taken a chemistry course. Suppose P(S) = 0.4, P(C) = 0.3, and P(S and C) = 0.2.a. Find the probability that a student has taken statistics
Blood types: Human blood may contain either or both of two antigens, A and B. Blood that contains only the A antigen is called type A, blood that contains only the B antigen is called type B, blood that contains both antigens is called type AB, and blood that contains neither antigen is called type
Start a business: Suppose that start-up companies in the area of biotechnology have probability 0.2 of becoming profitable, and that those in the area of information technology have probability 0.15 of becoming profitable. A venture capitalist invests in one firm of each type. Assume the companies
Stop that car: A drag racer has two parachutes, a main and a backup, that are designed to bring the vehicle to a stop at the end of a run.Suppose that the main chute deploys with probability 0.99, and that if the main fails to deploy, the backup deploys with probability 0.98.a. What is the
Defective parts: A process manufactures microcircuits that are used in computers. Twelve percent of the circuits are defective. Assume that three circuits are installed in a computer. Denote a defective circuit by“D” and a good circuit by “G.”a. List all eight items in the sample space.b.
Music to my ears: Jeri is listening to the songs on a new CD in random order. She will listen to two different songs and will buy the CD if she likes both of them. Assume there are 10 songs on the CD and that she would like five of them.a. What is the probability that she likes the first song?b.
Female business majors: At a certain university, the probability that a randomly chosen student is female is 0.55, the probability that the student is a business major is 0.20, and the probability that the student is female and a business major is 0.15.a. What is the probability that the student is
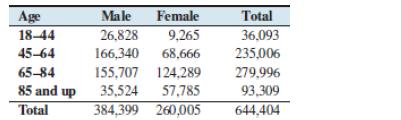
Heart attack: The following table presents the number of hospitalizations for myocardial infarction (heart attack) for men and women in various age groups.a. What is the probability that a randomly chosen patient is a woman?b. What is the probability that a randomly chosen patient is aged
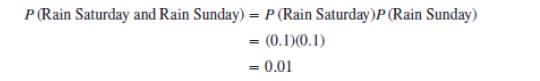
Rainy weekend: Sally is planning to go away for the weekend this coming Saturday and Sunday. At the place she will be going, the probability of rain on any given day is 0.10. Sally says that the probability that it rains on both days is 0.01. She reasons as follows:a. What assumption is being made
Required courses: A college student must take courses in English, history, mathematics, biology, and physical education. She decides to choose three of these courses to take in her freshman year. In how many ways can this choice be made?
Required courses: Refer to Exercise 12.Assume the student chooses three courses at random. What is the probability that she chooses English, mathematics, and biology?
Bookshelf: Luis has six books: a novel, a biography, a dictionary, a self-help book, a statistics textbook, and a comic book.a. Luis’s bookshelf has room for only three of the books. In how many ways can Luis choose and order three books?b. In how many ways may the books be chosen and ordered if
Bookshelf: Refer to Exercise 14.Luis chooses three books at random.a. What is the probability that the books on his shelf are statistics textbook, dictionary, and comic book, in that order?b. What is the probability that the statistics textbook, dictionary, and comic book are the three books
Explain how you could use the law of large numbers to show that a coin is unfair by tossing it many times.
When it comes to betting, the chance of winning or losing may be expressed as odds. If there are n equally likely outcomes and m of them result in a win, then the odds of winning are m:(n − m), read “m to n −m.” For example, suppose that a player rolls a die and wins if the number of dots
If the odds of an event occurring are 5:8, what is the probability that the event will occur?
Explain why the General Addition Rule P(A or B) = P(A) + P(B) −P(A and B) may be used even when A and B are mutually exclusive events.
Sometimes events are in the form “at least” a given number. For example, if a coin is tossed five times, an event could be getting at least two heads. What would be the complement of the event of getting at least two heads?
In practice, one must decide whether to treat two events as independent based on an understanding of the process that creates them. For example, in a manufacturing process that produces electronic circuit boards for calculators, assume that the probability that a board is defective is 0.01. You
Describe circumstances under which you would use a permutation.
Describe circumstances under which you would use a combination.
Law of large numbers: Each student tosses a coin three times.Compute the proportion of heads among all the students in the class.Repeat a few times, and compute the cumulative proportion of heads each time. Observe how the proportion approaches 1/2, in accordance with the law of large numbers.
Stop after one head: Each student tosses a coin until a head appears, then stops. Count the total number of tosses. What proportion of tosses were heads? Repeat a few times, and compute the cumulative proportion of heads each time. Does the proportion approach 1/2?
Monty Hall Problem: This is based on the old television program Let’s Make a Deal, hosted by Monty Hall. There are three doors. Behind one of them is a grand prize, and nothing is behind the other two. You select a door. The host then opens one of the doors you didn’t select that has nothing
Showing 5200 - 5300
of 7930
First
46
47
48
49
50
51
52
53
54
55
56
57
58
59
60
Last
Step by Step Answers