New Semester
Started
Get
50% OFF
Study Help!
--h --m --s
Claim Now
Question Answers
Textbooks
Find textbooks, questions and answers
Oops, something went wrong!
Change your search query and then try again
S
Books
FREE
Study Help
Expert Questions
Accounting
General Management
Mathematics
Finance
Organizational Behaviour
Law
Physics
Operating System
Management Leadership
Sociology
Programming
Marketing
Database
Computer Network
Economics
Textbooks Solutions
Accounting
Managerial Accounting
Management Leadership
Cost Accounting
Statistics
Business Law
Corporate Finance
Finance
Economics
Auditing
Tutors
Online Tutors
Find a Tutor
Hire a Tutor
Become a Tutor
AI Tutor
AI Study Planner
NEW
Sell Books
Search
Search
Sign In
Register
study help
business
elementary statistics
Elementary Statistics 4th Edition William Navidi , Barry Monk - Solutions
Leaking tanks: Leakage from underground fuel tanks has been a source of water pollution. In a random sample of 107 gasoline stations, 18 were found to have at least one leaking underground tank.a. Find a point estimate for the proportion of gasoline stations with at least one leaking underground
Waist size: According to the National Health Statistics Reports, a sample of 783 men aged 20–29 years had a mean waist size of 36.9 inches with a standard deviation of 8.8 inches.a. Construct a 95% confidence interval for the mean waist size.b. The results of another study suggest that the mean
Don’t construct a confidence interval: A meteorology student examines precipitation records for a certain city and discovers that of the last 365 days, it rained on 46 of them. Explain why these data cannot be used to construct a confidence interval for the proportion of days in this city that
Explain the difference between confidence and probability.In Exercises 4 and 5, express the following survey results in terms of confidence intervals for p:
According to a survey of 1000 American adults, 55% of Americans do not have a will specifying the handling of their estate. The survey’s margin of error was plus or minus 3%.Source: FindLaw.com
In a survey of 5050 U.S. adults, 29% would consider traveling abroad for medical care because of medical costs. The survey’s margin of error was plus or minus 2%.
Calculating a sample size: Each student tosses a coin 10 times and calculates the proportion of heads observed. Use that value of to estimate the sample size needed (call it n1) so that a 90% confidence interval for p will have a margin of error of 0.05. Make additional tosses Page 430 to bring the
Construct confidence intervals: Ask each student how far they traveled to get to school that day. Choose five students at random, and make a dotplot of their results to check for skewness and outliers.Regardless of the results, use these five results to construct a confidence interval for the mean
Construct a 95% confidence interval for the mean level of each pollutant for the Year 1.
Is it reasonable to conclude that the mean levels in Year 1 were lower than the baseline levels for some or all of the pollutants? Which ones, if any?The investigators were concerned that the reduction in pollution levels might be only temporary. Specifically, they were concerned that people might
Repeat Exercises 1 and 2 for the Year 2 data.
Is it reasonable to conclude that the mean levels in Year 2 were lower than the baseline levels for some or all of the pollutants? Which ones, if any?
Fill in the blank: A test of the hypotheses H0: μ = 65 versus H1: μ ≠ 65 was performed. The P-value was 0.035. Fill in the blank: If μ = 65, then the probability of observing a test statistic as extreme as or more extreme than the one actually observed is _________.
A hypothesis test results in a P-value of 0.008. Which is the best conclusion?i. H0 is definitely false.ii. H0 is definitely true.iii. H0 is plausible.iv. H0 might be true, but it’s very unlikely.v. H0 might be false, but it’s very unlikely.
True or false: If P = 0.03, thena. The result is statistically significant at the α = 0.05 level.b. The result is statistically significant at the α = 0.01 level.c. The null hypothesis is rejected at the α = 0.05 level.d. The null hypothesis is rejected at the α = 0.01 level.
A null hypothesis is rejected at the α = 0.05 level. True or false:a. The P-value is greater than 0.05.b. The P-value is less than or equal to 0.05.c. The result is statistically significant at the α = 0.05 level.d. The result is statistically significant at the α = 0.10 level.
A sample of size 8 is drawn from a normal population with mean μ, and the population standard deviation is unknown.a. Is it appropriate to perform a z-test? Explain.b. Is it appropriate to perform a t-test? Explain.
A test will be made of H0: μ = 4 versus H1: μ > 4, using a sample of size 25.The population standard deviation is unknown. Find the critical value of the test statistic if the significance level is α = 0.05.
In a random sample of 500 people who took their driver’s test, 445 passed.Let p be the population proportion who pass. A test will be made of H0: p =0.85 versus H1: p > 0.85.a. Compute the value of the test statistic.b. Do you reject H0 at the α = 0.05 level?c. State a conclusion.
For testing H0: μ = 3 versus H1: μ < 3, a P-value of 0.024 is obtained.a. If the significance level is α = 0.05, would you conclude that μ < 3?Explain.b. If the significance level is α = 0.01, would you conclude that μ < 3?Explain.
The result of a hypothesis test is reported as follows: “We reject H0 at the α= 0.05 level.” What additional information should be included?
In a test of H0: μ = 5 versus H1: μ > 5, the value of the test statistic is t =2.96. There are 17 degrees of freedom. Do you reject H0 at the α = 0.05 level?
True or false: We can perform a test for a standard deviation only when the population is almost exactly normal.
A random sample of size 20 from a normal population has sample standard deviation s = 10.Test H0: σ = 15 versus H1: σ < 15.Use the α = 0.05 level.
A test of H0: μ = 50 versus H1: μ > 50 will be made at a significance level ofα = 0.05. The population standard deviation is σ = 10 and the sample size is n = 60.Find the power of the test against the alternative μ1 = 55.
What’s the conclusion? A hypothesis test is performed, and P = 0.02.Which of the following is the best conclusion?i. H0 is rejected at the 0.05 level.ii. H0 is rejected at the 0.01 level.iii. H1 is rejected at the 0.05 level.iv. H1 is rejected at the 0.01 level.
Scoring runs: In 2018, the mean number of runs scored by both teams in a Major League Baseball game was 8.87. Following are the numbers of runs scored in a sample of 24 games in 2019.a. Construct a boxplot of the data. Is it appropriate to perform a hypothesis test?b. If appropriate, perform a
Facebook: A popular blog reports that 60% of college students log in to Facebook on a daily basis. The Dean of Students at a certain university thinks that the proportion may be different at her university. She polls a simple random sample of 200 students, and 134 of them report that they log in to
Playing the market: The Russell 2000 is a group of 2000 small-company stocks. On a recent day, a random sample of 35 of these stocks had a mean price of $26.89, with a standard deviation of $23.41. A stock market analyst predicted that the mean price of all 2000 stocks would be $25.00. Can you
Power: A test of H0: μ = 100 versus H1: μ > 100 will be made at a significance level of α = 0.01. The population standard deviation is σ = 50, and the sample size is n = 75.Find the power of the test against the alternative μ1 = 110.
More power: Refer to Exercise 5.If the test is made at the α = 0.05 level with the same sample size, would the power be greater than or less than in Exercise 5? Explain.
Household size: For the past several years, the mean number of people in a household has been declining. A social scientist believes that in a certain large city, the mean number of people per household is less than 2.5. To investigate this, she takes a simple random sample of 150 households in the
Job satisfaction: The General Social Survey sampled 762 employed people and asked them how satisfied they were with their jobs. Of the 762 people sampled, 386 said that they were completely satisfied or very satisfied with their jobs. Can you conclude that more than 45% of employed people in the
Sugar content: The sugar content in milligrams of a syrup used to pack canned fruit is measured for 8 batches of syrup. The measurements are normally distributed, and the sample standard deviation is s = 3.Can you conclude that the population standard deviation is greater than 2? Use the α= 0.01
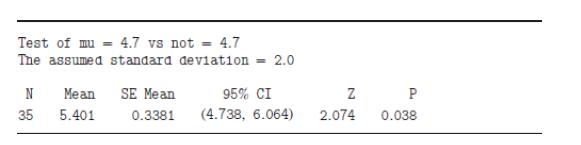
Interpret computer output: The following output from MINITAB presents the results of a hypothesis test.a. What are the null and alternate hypotheses?b. What is the value of the test statistic?c. What is the P-value?d. Do you reject H0 at the α = 0.05 level?e. Do you reject H0 at the α = 0.01
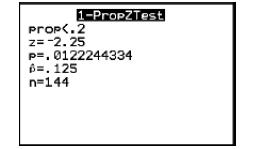
Interpret calculator display: The following TI-84 Plus display presents the results of a hypothesis test.a. Is this a test for a mean, a proportion, or a standard deviation?b. What are the null and alternate hypotheses?c. What is the value of the test statistic?d. What is the P-value?e. Do you
How many TV sets? A survey organization sampled 60 households in a community and found that the sample mean number of TV sets per household was 3.1. The population standard deviation is σ = 1.5. Can you conclude that the mean number of TV sets per household is greater than 3?a. State the null and
Crackers: Boxes of crackers are filled by a machine. The weights of a random sample of 25 boxes of crackers have standard deviation s = 5 grams.Assume the weights are normally distributed. Can you conclude that the population standard deviation is less than 10 grams? Use the α = 0.05 level of
How much rent? A housing official in a certain city claims that the mean monthly rent for apartments in the city is more than $1000. To verify this claim, a simple random sample of 40 renters in the city was taken, and the sample mean rent paid was $1100 with a sample standard deviation of $300.Can
What’s the news? The Pew Research Center reported that 23% of 18- to 29-year-olds watch a cable news channel regularly. The director of media relations at a large university wants to know whether the population proportion of cable news viewers among students at her university is greater than the
A result is significant at the 0.01 level. Explain why it must also be significant at the 0.05 level.
What does the P-value represent?
Why is it important to report the P-value or the test statistic when presenting the results of a hypothesis test?
Why don’t we need to know the population standard deviation when performing a test about a population proportion?
In what ways are hypothesis tests for a population mean different from hypothesis tests for a proportion? In what ways are they similar?
A test will be made of H0: μ = 12 versus H1: μ > 12.Explain why the power will be greater when the true value of μ is 20 than when the true value of μ is 15.
Multiple testing problem: Each student tosses a coin 50 times, then performs a test of the hypothesis H0: p = 0.5 versus H1: p ≠ 0.5. If some students reject H0 at the α = 0.05 level, can we conclude their coins were unfair? Or is there a better explanation?Construct a histogram of the P-values.
Choosing H0 and H1: In a manufacturing process, each item is tested as it is manufactured to determine whether it has sufficient strength for the use to which it will be put. There are two choices: The item will be used, or the process will be shut down for recalibration at some expense. Should H0
One or two tails: Discuss some situations in which a one-tailed alternate hypothesis is appropriate and some in which a two-tailed alternate is appropriate.
If there have been no temperature trends over the years, then it will be equally likely for the record high or the record low to be more recent. If there has been a warming trend, it might be more likely for the record high to be more recent. Let p be the probability that the record high occurred
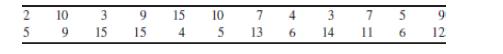
The following table presents the records for every day in June. The data show that it is common for records to be set on two or more consecutive days in the same year. This is due to hot spells and cold spells in the weather.For example, five consecutive record highs, from June 2 through June 6,
We will perform another test to determine whether record highs are more likely to have occurred recently. If a record high is equally likely to occur in any year of observation, the mean year in which a record is observed would occur at the midpoint of the observation period, which is (1871 +
For some records, marked with a *, the record temperature occurred more than once. In these cases, only the most recent year is listed. Explain how this might cause the mean to be greater than the midpoint of 1944.5, even if records are equally likely to occur in any year.
Using the data in Table 9.4, drop the dates in which the record high occurred more than once, and test the hypothesis in Exercise 3 again. Does your conclusion change?
Perform a hypothesis test on the record lows, after dropping dates on which the record low occurred more than once, in which the alternate hypothesis is that the mean year is less than 1944.5. What do you conclude?
Using the analyses you have performed, write a summary of your findings.Describe how strong you believe the evidence to be that record highs have tended to occur more recently than record lows.
Of the mean, median, and mode, which must be a value that actually appears in the data set?
The prices (in dollars) for a sample of personal computers are: 550, 700, 420, 580, 550, 450, 690, 390, 350.Calculate the mean, median, and mode for this sample.
If a computer with a price of $2000 were added to the list in Exercise 2, which would be affected more, the mean or the median?
In general, a histogram is skewed to the left if the _________ is noticeably less than the _________.
A sample of 100 students was asked how many hours per week they spent studying. The following frequency table shows the results:a. Approximate the mean time this sample of students spent studying.b. Approximate the standard deviation of the time this sample of students spent studying. Number of
A sample has a variance of 16.What is the standard deviation?
Each of the following histograms represents a data set with mean 20.One has a standard deviation of 3.96, and the other has a standard deviation of 2.28. Which is which? Fill in the blanks: Histogram I has a standard deviation of _________ and histogram II has a standard deviation of _________. I
Assume that the histogram of starting salaries is approximately bell-shaped.Approximately what percentage of the salaries will be between $34,680 and$40,280?
Assume it is not known whether the histogram of starting salaries is bellshaped.Fill in the blank: At least _________ percent of the salaries will be between $34,680 and $40,280.
John’s starting salary is $38,180. What is the z-score of his salary?
Find the coefficient of variation of the salaries.
True or false: If a student’s exam grade is on the 55th percentile, then approximately 45% of the scores are below his or her grade.
The five-number summary for a sample is 7, 18, 35, 62, 85.What is the IQR?
The prices (in dollars) for a sample of coffee makers are:a. Find the first and third quartiles.b. Find the upper and lower outlier boundaries.c. Are there any outliers? If so, list them. 19 22 29 68 35 37 28 22 41 39 28
Construct a boxplot for the data in Exercise 14.
Support your local artist: Following are the annual amounts of federal support (in millions of dollars) for National Endowment for the Arts programs for the years 2010–2019.a. Find the mean annual amount of federal aid from 2010–2019.b. Find the median annual amount of federal aid from
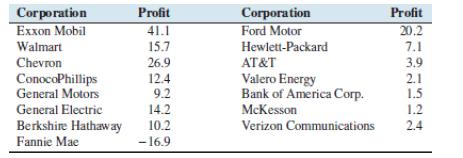
Corporate profits: The following table presents the profit, in a recent year, in billions of dollars, for each of the 15 largest U.S. corporations in terms of revenue.a. Find the mean profit.b. Find the median profit.c. Are these data skewed to the right, skewed to the left, or approximately
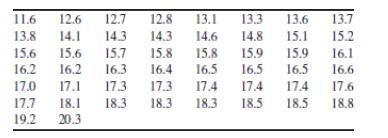
Computer chips: A computer chip is a wafer made of silicon that contains complex electronic circuitry made up of microscopic components. The wafers are coated with a very thin coating of silicon dioxide. It is important that the coating be of uniform thickness over the wafer. To check this,
More computer chips: Using the data in Exercise 3:a. Find the sample variance of the thicknesses for each process.b. Find the sample standard deviation of the thicknesses for each process.c. Which process appears to be better in producing a uniform thickness?Explain.
Stock prices: Following are the closing prices of Microsoft stock for each trading day in May and June of a recent year.a. Find the mean and median price in May.b. Find the mean and median price in June.c. Does there appear to be a substantial difference in price between May and June? Or are the
More stock prices: Using the data in Exercise 5:a. Find the population standard deviation of the prices in May.b. Find the population standard deviation of the prices in June.c. Financial analysts use the word volatility to refer to the variation in stock prices. Was the volatility for the price of
Measure that ball: Each of 16 students measured the circumference of a tennis ball by two different methods:A: Estimate the circumference by eye.B: Measure the circumference by rolling the ball along a ruler.The results (in centimeters) are given below, in increasing order for each method:a.
Time in surgery: Records at a hospital show that a certain surgical procedure takes an average of 162.8 minutes with a standard deviation of 4.9 minutes. If the data are approximately bell-shaped, between what two values will about 95% of the data fall?
Rivets: A machine makes rivets that are used in the manufacture of airplanes. To be acceptable, the length of a rivet must be between 0.9 centimeter and 1.1 centimeters. The mean length of a rivet is 1.0 centimeter, with a standard deviation of 0.05 centimeter. What is the maximum possible
How long can you talk? A manufacturer of phone batteries determines that the average length of talk time for one of its batteries is 470 minutes.Suppose that the standard deviation is known to be 32 minutes and that the data are approximately bell-shaped. Estimate the percentage of batteries that
Paying rent: The monthly rents for apartments in a certain town have a mean of $800 with a standard deviation of $150. What can you determine about these data by using Chebyshev’s Inequality with K = 3?
Advertising costs: The amounts spent (in billions) on media advertising in the United States for a sample of categories are presented in the following table.a. Find the mean amount spent on advertising.b. Find the median amount spent on advertising.c. Find the sample variance of the advertising
Weights of soap: As part of a quality control study aimed at improving a production line, the weights (in ounces) of 50 bars of soap are measured.The results are shown below, sorted from smallest to largest.a. Find the first and third quartiles of these data.b. Find the median of these data.c. Find
More corporate profits: Using the data in Exercise 2:a. Find the first and third quartiles of the profit.b. Find the median profit.c. Find the upper and lower outlier boundaries.d. Are there any outliers? If so, list them.e. Construct a boxplot for these data.
The U.S. Department of Labor annually publishes an Occupational Outlook Handbook, which reports the job outlook, working conditions, and earnings for thousands of different occupations. The handbook reports both the mean and median annual earnings. For most occupations, which is larger, the mean or
Explain why the Empirical Rule is more useful than Chebyshev’s Inequality for bell-shaped distributions. Explain why Chebyshev’s Inequality is more useful for distributions that are not bell-shaped.
Percentiles are values that divide a data set into hundredths. The values that divide a data set into tenths are called deciles, denoted D1 , D2 , ... , D9.Describe the relationship between percentiles and deciles.
Estimating the population mean: Two exams were given to a class. The scores on the first exam ranged from 30 to 90, and the scores on the second exam ranged from 70 to 75.You are asked to guess the mean score for each exam. Which of your guesses do you think is more likely to be closer to the true
Sample mean and population mean: Following are two populations, both of which have mean μ = 50.Each student should draw a sample of size 3 from each population and compute the sample mean. For which population does the sample mean tend to be closer to the population mean? Compute the standard
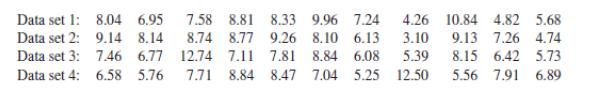
Anscombe’s quartet: Statistician Francis Anscombe developed four data sets that demonstrate the importance of graphing data in addition to computing summary statistics such as the mean and variance. Following are the data sets. Verify that the means and variance are the same for each, to two
Construct comparative boxplots for the thicknesses of new wafers and recycled wafers.Electronic devices contain electric circuits etched into wafers made of silicon.These silicon wafers are sealed with an ultrathin layer of silicon dioxide, in a process known as oxidation. This can be done with
Identify all outliers.Electronic devices contain electric circuits etched into wafers made of silicon.These silicon wafers are sealed with an ultrathin layer of silicon dioxide, in a process known as oxidation. This can be done with either new or recycled wafers.In a study described in the book
Should any of the outliers be deleted? If so, delete them and redraw the boxplots.Electronic devices contain electric circuits etched into wafers made of silicon.These silicon wafers are sealed with an ultrathin layer of silicon dioxide, in a process known as oxidation. This can be done with either
Identify any outliers in the redrawn boxplots. Should any of these be deleted? Explain.Electronic devices contain electric circuits etched into wafers made of silicon.These silicon wafers are sealed with an ultrathin layer of silicon dioxide, in a process known as oxidation. This can be done with
Are the distributions of thicknesses skewed, or approximately symmetric?Electronic devices contain electric circuits etched into wafers made of silicon.These silicon wafers are sealed with an ultrathin layer of silicon dioxide, in a process known as oxidation. This can be done with either new or
Delete outliers as appropriate, and compute the mean thickness for new and for recycled wafers.Electronic devices contain electric circuits etched into wafers made of silicon.These silicon wafers are sealed with an ultrathin layer of silicon dioxide, in a process known as oxidation. This can be
Delete outliers as appropriate, and compute the median thickness for new and for recycled wafers.Electronic devices contain electric circuits etched into wafers made of silicon.These silicon wafers are sealed with an ultrathin layer of silicon dioxide, in a process known as oxidation. This can be
Delete outliers as appropriate, and compute the standard deviation of the thicknesses for new and for recycled wafers.Electronic devices contain electric circuits etched into wafers made of silicon.These silicon wafers are sealed with an ultrathin layer of silicon dioxide, in a process known as
Suppose that it is desired to use the type of wafer whose distribution has less spread. Write a brief paragraph that explains which type of wafer to use and why. Which measure is more useful for spread in this case, the standard deviation or the interquartile range? Explain.Electronic devices
Showing 5100 - 5200
of 7930
First
45
46
47
48
49
50
51
52
53
54
55
56
57
58
59
Last
Step by Step Answers