New Semester
Started
Get
50% OFF
Study Help!
--h --m --s
Claim Now
Question Answers
Textbooks
Find textbooks, questions and answers
Oops, something went wrong!
Change your search query and then try again
S
Books
FREE
Study Help
Expert Questions
Accounting
General Management
Mathematics
Finance
Organizational Behaviour
Law
Physics
Operating System
Management Leadership
Sociology
Programming
Marketing
Database
Computer Network
Economics
Textbooks Solutions
Accounting
Managerial Accounting
Management Leadership
Cost Accounting
Statistics
Business Law
Corporate Finance
Finance
Economics
Auditing
Tutors
Online Tutors
Find a Tutor
Hire a Tutor
Become a Tutor
AI Tutor
AI Study Planner
NEW
Sell Books
Search
Search
Sign In
Register
study help
business
elementary statistics
Elementary Statistics 3rd Edition William Navidi, Barry Monk - Solutions
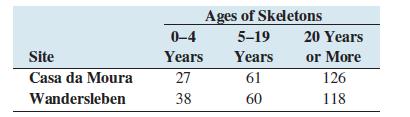
Compute the value of the chi-square statistic.Exercises 10–15 refer to the following data:Anthropologists can estimate the birthrate of an ancient society by studying the age distribution of skeletons found in ancient cemeteries. An article in the journal Current Anthropology presented the
How many degrees of freedom are there?Exercises 10–15 refer to the following data:Anthropologists can estimate the birthrate of an ancient society by studying the age distribution of skeletons found in ancient cemeteries. An article in the journal Current Anthropology presented the following
Find the critical value for the ???? = 0.01 level of significance.Exercises 10–15 refer to the following data:Anthropologists can estimate the birthrate of an ancient society by studying the age distribution of skeletons found in ancient cemeteries. An article in the journal Current Anthropology
State a conclusion.Exercises 10–15 refer to the following data:Anthropologists can estimate the birthrate of an ancient society by studying the age distribution of skeletons found in ancient cemeteries. An article in the journal Current Anthropology presented the following numbers of skeletons of
Provide an example, real or imagined, of a hypothesis test for the difference between two means.
Describe under what circumstances a hypothesis test for the difference between two proportions would be performed.Provide an example.
Five tests are performed, and the P-values are 0.02, 0.11, 0.23, 0.38, and 0.45. Use the Bonferroni adjustment to adjust the P-value of 0.02.
Six tests are performed, and the smallest P-value is 0.03. Which is the best conclusion?i. Reject H0 because P < 0.05.ii. Do not reject H0 because the Bonferroni adjustment yields P = 6(0.03) = 0.18, which is greater than 0.05.iii. Do not reject H0, but collect new data and repeat the test.
The multiple testing problem states that as more hypothesis tests are performed, small P-values become ___________________ meaningful.In Exercises 3 and 4, fill in each blank with the appropriate word or phrase.
The Bonferroni adjustment is made by multiplying the P-value by the number of___________________ .In Exercises 3 and 4, fill in each blank with the appropriate word or phrase.
The Bonferroni-adjusted P-value is always greater than the uncorrected P-value.In Exercises 5 and 6, determine whether the statement is true or false. If the statement is false, rewrite it as a true statement.
When testing several hypotheses, it is reasonable to reject every hypothesis for which P < 0.05.In Exercises 5 and 6, determine whether the statement is true or false. If the statement is false, rewrite it as a true statement.
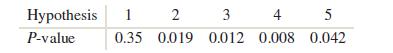
Five null hypotheses were tested, and the P-values were:a. Which hypotheses, if any, can be rejected at the α = 0.05 level?b. Which hypotheses, if any, can be rejected at the α = 0.01 level? Hypothesis 1 2 P-value 3 4 5 0.35 0.019 0.012 0.008 0.042
Six null hypotheses were tested, and the P-values were:a. Which hypotheses, if any, can be rejected at the α = 0.05 level?b. Which hypotheses, if any, can be rejected at the α = 0.01 level? Hypothesis 1 P-value 2 3 4 5 6 0.003 0.012 0.002 0.001 0.024 0.032
A sociologist surveys a sample of college students to determine whether there are differences in the attitudes and behaviors of male and female students. The survey contains 20 questions. For one question, which asks how much time students spend studying each week, the difference between males and
Six different settings are tried on a machine to determine whether any of them will reduce the proportion of defective parts. For each setting, an appropriate null hypothesis is tested to determine whether the proportion of defective parts has been reduced. The six P-values are 0.34, 0.27, 0.002,
Refer to Exercise 9.For the result that was statistically significant, the P-value was 0.01. What P-value would be needed to conclude at the α = 0.05 level that the time spent studying differs between males and females after applying the Bonferroni correction?Exercise 9A sociologist surveys a
Refer to Exercise 10.The quality engineer suspects that the setting with a P-value of 0.03 may actually reduce the proportion of defective parts. What P-value would be needed to make this conclusion at the α = 0.05 level after applying the Bonferroni correction?Exercise 10Six different settings
Five hundred null hypotheses are tested at the α = 0.05 level, and 40 of them are rejected. Assume the tests are independent,a. Assuming that all 500 null hypotheses are true, what is the probability that a given hypothesis is rejected?b. Let X be the number of hypotheses that are rejected, so
A simple random sample of 75 people are given a new drug that is designed to relieve pain. A second sample of 50 people are given a standard drug. The question of interest is whether the proportion of people experiencing relief is greater among those taking the new drug. To address this question,
Two machines are used to fill cans. The machines are supposed to fill each can with 12 ounces of liquid. The amounts actually filled follow a normal distribution. A simple random sample of 10 cans is filled by each machine. The question of interest is whether the variability in the fill volume
A fleet of 100 taxis is divided into two groups of 50 cars each to determine whether premium gasoline reduces maintenance costs. Premium unleaded fuel is used in group A, while regular unleaded fuel is used in group B. The total maintenance cost for each vehicle during a one-year period is
A simple random sample of 75 people are given a new drug that is designed to relieve pain. After taking this drug for a month, they switch to a standard drug. The question of interest is whether the proportion of people who experienced relief is greater when taking the new drug. To address this
In a test of H0: p1 = p2 versus H1: p1 ≠ p2, the value of the test statistic is z = −1.21. What do you conclude about the difference p1 − p2 at the ???? = 0.05 level of significance?
A sample of size 15 is drawn from a normal population. The sample standard deviation is s1 = 5.2. A sample of size 10 is drawn from another normal population. The sample standard deviation is s2 = 9.3. Can you conclude that the variances of these two populations are different? Use the α = 0.05
For a test of H0: μ1 = μ2 versus H1: μ1 ≠ μ2, the sample sizes were n1 = 15 and n2 = 25.How many degrees of freedom are there for the test statistic? Use the simple method.
In a set of 12 matched pairs, the mean difference was d̄ = 18 and the standard deviation of the differences was sd = 4.Find the value of the test statistic for testing H0: μd = 15 versus H1: μd > 15.Can you reject H0 at the α = 0.05 level?
Two suppliers of machine parts delivered large shipments. A simple random sample of 150 parts was chosen from each shipment.For supplier A, 12 of the 150 parts were defective. For supplier B, 28 of the 150 parts were defective. The question of interest is whether the proportion of defective parts
Refer to Exercise 9.Compute the value of the test statistic.Exercise 9Two suppliers of machine parts delivered large shipments. A simple random sample of 150 parts was chosen from each shipment.For supplier A, 12 of the 150 parts were defective. For supplier B, 28 of the 150 parts were defective.
Refer to Exercise 9.Can you reject H0 at the α = 0.01 level? State a conclusion.Exercise 9Two suppliers of machine parts delivered large shipments. A simple random sample of 150 parts was chosen from each shipment.For supplier A, 12 of the 150 parts were defective. For supplier B, 28 of the 150
A simple random sample of 17 business majors from a certain university had a mean GPA of 2.81 with a standard deviation of 0.27. A simple random sample of 23 psychology majors was selected from the same university, and their mean GPA was 2.97 with a standard deviation of 0.23. Boxplots show that it
Refer to Exercise 12.Compute the value of the test statistic.Exercise 12A simple random sample of 17 business majors from a certain university had a mean GPA of 2.81 with a standard deviation of 0.27. A simple random sample of 23 psychology majors was selected from the same university, and their
Refer to Exercise 12.Can you reject H0 at the α = 0.05 level? State a conclusion.Exercise 12A simple random sample of 17 business majors from a certain university had a mean GPA of 2.81 with a standard deviation of 0.27. A simple random sample of 23 psychology majors was selected from the same
Five null hypotheses were tested, and the P-values were 0.24, 0.17, 0.03, 0.002, and 0.02. How many of the hypotheses are rejected at the α = 0.05 level if the Bonferroni adjustment is made?
The General Social Survey reported that in a sample of 68 men aged 18–25, the mean number of hours of television watched per day was 2.76 with a standard deviation of 2.21. In a sample of 72 women aged 18–25, the mean number of hours of television watched per day was 2.88 with a standard
A sample of five third graders took a reading test. They then participated in a reading improvement program, and took the test again to determine whether their reading ability had improved. Following are the test scores for each of the students both before and after the program. Can you conclude
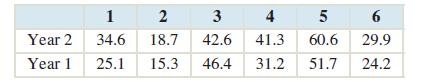
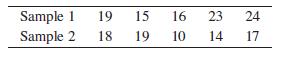
Following are the annual amounts of rainfall, in inches, in six randomly chosen cities for two consecutive years. Can you conclude that the mean rainfall was greater in year 2 than in year 1?a. Let μd denote the population mean difference Year 2−Year 1.State the appropriate null and alternate
If the sample size is small, the differences between the items in the matched pairs must show no evidence of strong and must contain no ______________ .In Exercises 3 and 4, fill in each blank with the appropriate word or phrase.
With matched pairs, the test for the difference between population means is the same as the test for a single population _________________ .In Exercises 3 and 4, fill in each blank with the appropriate word or phrase.
Paired data are data for which each value in one sample can be matched with a corresponding value in another sample.In Exercises 5 and 6, determine whether the statement is true or false. If the statement is false, rewrite it as a true statement.
To compute the test statistic for a test with matched pairs, we must compute the standard deviations of the samples.In Exercises 5 and 6, determine whether the statement is true or false. If the statement is false, rewrite it as a true statement.
Following is a sample of five matched pairs.Let μ1 and μ2 represent the population means and let μd = μ1 − μ2. A test will be made of the hypotheses H0: μd = 0 versus H1: μd > 0.a. Compute the differences.b. Compute the test statistic.c. Can you reject H0 at the α = 0.05 level of
Following is a sample of 10 matched pairs.Let μ1 and μ2 represent the population means and let μd = μ1 − μ2. A test will be made of the hypotheses H0: μd = 0 versus H1: μd ≠ 0.a. Compute the differences.b. Compute the test statistic.c. Can you reject H0 at the α = 0.05 level of
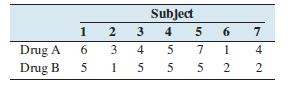
A crossover trial is a type of experiment used to compare two drugs. Subjects take one drug for a period of time, then switch to the other. The responses of the subjects are then compared using matched-pair methods. In an experiment to compare two pain relievers, seven subjects took one pain
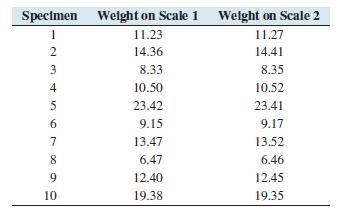
In an experiment to determine whether there is a systematic difference between the weights obtained with two different scales, 10 rock specimens were weighed, in grams, on each scale. The following data were obtained:Can you conclude that the mean weight differs between the scales?a. State the null
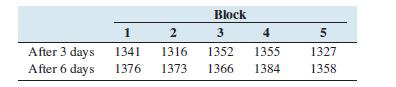
The compressive strength, in kilopascals, was measured for concrete blocks from five different batches of concrete, both three and six days after pouring. The data are as follows:Can you conclude that the mean strength after three days differs from the mean strength after six days?a. State the null
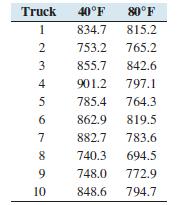
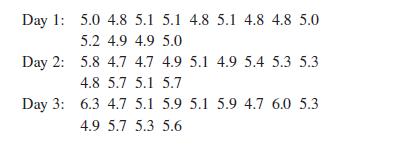
In an experiment to determine the effect of ambient temperature on the emissions of oxides of nitrogen (NOx) of diesel trucks, 10 trucks were run at temperatures of 40°F and 80°F. The emissions, in parts per billion, are presented in the following table.Can you conclude that the mean emissions
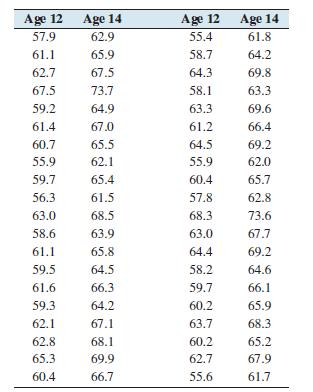
It is generally known that boys grow at an unusually fast rate between the ages of about 12 and 14.Following are heights, in inches, of 40 boys measured at age 12 and again at age 14.Can you conclude that the mean increase in height is greater than 5 inches?a. State the null and alternate
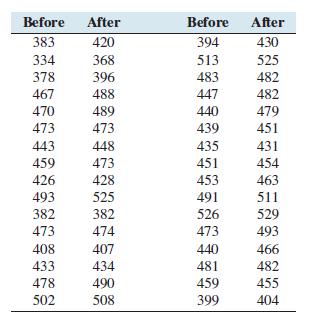
A sample of 32 students took a class designed to improve their SAT math scores. Following are their scores before and after the class.Can you conclude that the mean increase in score is less than 15 points?a. State the null and alternate hypotheses.b. Compute the test statistic.c. State a
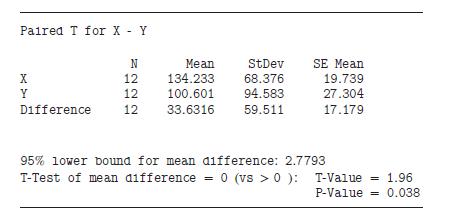
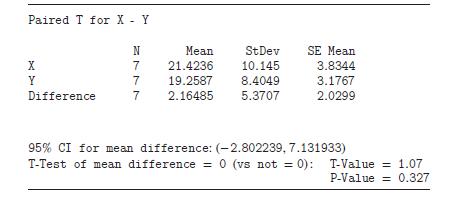
The following MINITAB output presents the results of a hypothesis test for a mean difference.a. Is this a left-tailed test, a right-tailed test, or a two-tailed test?b. Can H0 be rejected at the 0.05 level? Explain.c. Can H0 be rejected at the 0.01 level? Explain. Paired T for X - Y N Mean StDev SE
The following MINITAB output presents the results of a hypothesis test for a mean difference.a. Is this a left-tailed test, a right-tailed test, or a two-tailed test?b. Can H0 be rejected at the 0.05 level? Explain.c. Can H0 be rejected at the 0.01 level? Explain. Paired T for X - Y X Y Difference
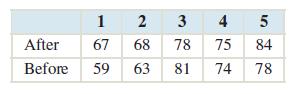
Refer to Exercise 12.Assume you did not know that the two samples were paired, so you used the methods of Section 11.1 to perform the test.a. What is the P-value?b. Explain why the P-value is greater when the methods of Section 11.1 are used.Exercise 12In an experiment to determine the effect of
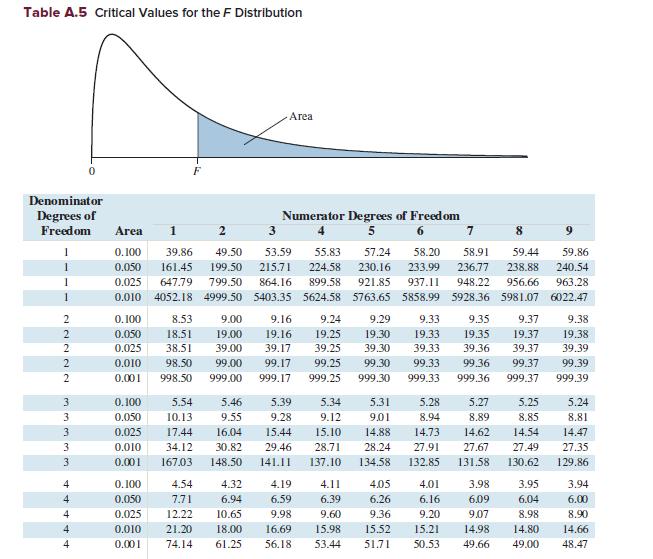
Find f0.05 for F8,18.
Find f0.01 for F12,8.
For testing H0 : σ1 = σ2 versus H1: σ1 < σ2, we observe s1 = 0.9, s2 = 1.5, n1 = 16, and n2 = 11.Test at the significance level α = 0.01.a. Find the critical value.b. Do you reject H0?
For testing H0 : σ1 = σ2 versus H1: σ1 ≠ σ2, we observe s1 = 9.3, s2 = 2.1, n1 = 6, and n2 = 13.Test at the significance level α = 0.05.a. Find the critical value.b. Do you reject H0?
To use an F-test, both populations must have a _______________ distribution.In Exercises 5 and 6, fill in each blank with the appropriate word or phrase.
The F statistic is the quotient of the sample ____________ .In Exercises 5 and 6, fill in each blank with the appropriate word or phrase.
The test statistic F is never greater than 1.In Exercises 7 and 8, determine whether the statement is true or false. If the statement is false, rewrite it as a true statement.
The F-test for two standard deviations is very sensitive to the normality assumption.In Exercises 7 and 8, determine whether the statement is true or false. If the statement is false, rewrite it as a true statement.
Find the critical value f0.05 for F7,20.
Find the critical value f0.01 for F2,5.
An F-test with 12 degrees of freedom in the numerator and 6 degrees of freedom in the denominator produced a test statistic whose value was 3.42. The null and alternate hypotheses were H0: σ1 = σ2 versus H1: σ1 < σ2.a. Do you reject H0 at the α = 0.05 level?b. Do you reject H0 at the α = 0.01
An F-test with 5 degrees of freedom in the numerator and 7 degrees of freedom in the denominator produced a test statistic whose value was 5.31. The null and alternate hypotheses were H0: σ1 = σ2 versus H1: σ1 > σ2.a. Do you reject H0 at the α = 0.05 level?b. Do you reject H0 at the α = 0.01
A broth used to manufacture a pharmaceutical product has its sugar content, in milligrams per milliliter, measured several times on each of three successive days.a. Can you conclude that the variability of the process is greater on the second day than on the first day? Use the α = 0.05 level of
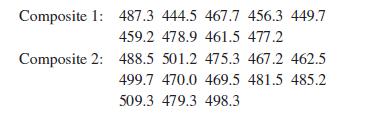
The breaking strength of hockey stick shafts made of two different graphite-kevlar composites yields the following results (in newtons).Can you conclude that the standard deviation of the breaking strength differs between the two composites? Use the α = 0.05 level of significance. Composite 1:
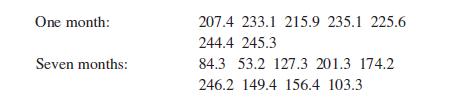
A computer system administrator notices that computers running a particular operating system seem to freeze up more often as the installation of the operating system ages. She measures the time (in minutes) before freeze-up for 7 computers one month after installation, and for 9 computers seven
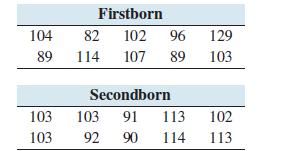
In a study of birth order and intelligence, IQ tests were given to 18- and 19-year-old men to estimate the size of the difference, if any, between the mean IQs of firstborn sons and secondborn sons.The following data for 10 firstborn sons and 10 secondborn sons are consistent with the means and
It is desired to find the value f0.99 for an F10,5 distribution. Use Table A.5 and the F5,10 distribution to find this value. Table A.5 Critical Values for the F Distribution Area Denominator Degrees of Numerator Degrees of Freedom Freedom Area 1 2 3 5 6 7 8 9 0.100 39.86 0.050 161.45 199.50 49.50
In a clinical trial to compare the effectiveness of two pain relievers, a sample of 100 patients was given drug 1 and an independent sample of 200 patients was given drug 2.Of the patients on drug 1, 76 experienced substantial relief, while of the patients on drug 2, 128 experienced substantial
A sample of 200 voters over the age of 60 were asked whether they thought Social Security benefits should be increased for people over the age of 65.A total of 95 of them answered yes. A sample of 150 voters aged 18–25 were asked the same question and 63 of them answered yes. A pollster wants to
To use the method of this section to test a hypothesis about the difference between two proportions, each population must be at least _______________ times as large as the sample drawn from it.In Exercises 3 and 4, fill in each blank with the appropriate word or phrase.
To use the method of this section to test a hypothesis about the difference between two proportions, each sample must contain at least _________________ individuals in each category.In Exercises 3 and 4, fill in each blank with the appropriate word or phrase.
The individuals in each sample are divided into three or more categories.In Exercises 5 and 6, determine whether the statement is true or false. If the statement is false, rewrite it as a true statement.
To compute the test statistic, it is necessary to compute the pooled proportion.In Exercises 5 and 6, determine whether the statement is true or false. If the statement is false, rewrite it as a true statement.
In a test for the difference between two proportions, the sample sizes were n1 = 120 and n2 = 85, and the numbers of events were x1 = 55 and x2 = 45.A test is made of the hypotheses H0: p1 = p2 versus H1: p1 ≠ p2.a. Compute the value of the test statistic.b. Can you reject H0 at the α = 0.05
In a test for the difference between two proportions, the sample sizes were n1 = 68 and n2 = 76, and the numbers of events were x1 = 41 and x2 = 25.A test is made of the hypotheses H0: p1 = p2 versus H1: p1 > p2.a. Compute the value of the test statistic.b. Can you reject H0 at the α = 0.05 level
The National Health and Nutrition Examination Survey (NHANES) weighed a sample of 546 boys aged 6–11 and found that 87 of them were overweight. They weighed a sample of 508 girls aged 6–11 and found that 74 of them were overweight. Can you conclude that the proportion of boys who are overweight
In a random sample of 340 cars driven at low altitudes, 46 of them exceeded a standard of 10 grams of particulate pollution per gallon of fuel consumed. In an independent random sample of 85 cars driven at high altitudes, 21 of them exceeded the standard. Can you conclude that the proportion of
Medical researchers performed a comparison of two drugs, clopidogrel and ticagrelor, which are designed to reduce the risk of heart attack or stroke in coronary patients. A total of 6676 patients were given clopidogrel, and 6732 were given ticagrelor. Of the clopidogrel patients, 668 suffered a
An article in the Archives of Internal Medicine reported that in a sample of 244 men, 73 had elevated total cholesterol levels (more than 200 milligrams per deciliter). In a sample of 232 women, 44 had elevated cholesterol levels. Can you conclude that the proportion of people with elevated
Angioplasty is a medical procedure in which an obstructed blood vessel is widened. In some cases, a wire mesh tube, called a stent, is placed in the vessel to help it remain open. A study was conducted to compare the effectiveness of a bare metal stent with one that has been coated with a drug
In August and September 2005, Hurricanes Katrina and Rita caused extraordinary flooding in New Orleans, Louisiana. Many homes were severely damaged or destroyed, and of those that survived, many required extensive cleaning. It was thought that cleaning flood-damaged homes might present a health
In a certain year, there was measurable snowfall on 80 out of 365 days in Denver, and 63 out of 365 days in Chicago. A meteorologist proposes to perform a test of the hypothesis that the proportions of days with snow are equal in the two cities. Explain why this cannot be done using the method
A new reading program is being tested. Parents are asked whether they would like to enroll their children, and 50 children are enrolled in the program. There are 45 children whose parents do not choose to enroll their children. At the end of the school year, the children are tested. Of the 50
The following TI-84 Plus calculator display presents the results of a hypothesis test for the difference between two proportions. The sample sizes are n1 = 165 and n2 = 152.a. Is this a left-tailed test, a right-tailed test, or a two-tailed test?b. What is the P-value?c. Can you reject H0 at the α
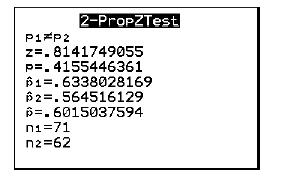
The following TI-84 Plus calculator display presents the results of a hypothesis test for the difference between two proportions. The sample sizes are n1 = 71 and n2 = 62.a. Is this a left-tailed test, a right-tailed test, or a two-tailed test?b. What is the P-value?c. Can you reject H0 at the α =
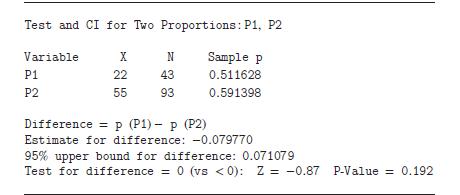
The following computer output(from MINITAB) presents the results of a hypothesis test on the difference between two proportions.a. Is this a left-tailed test, a right-tailed test, or a two-tailed test?b. What is the P-value?c. Can H0 be rejected at the 0.05 level? Explain. Test and CI for Two
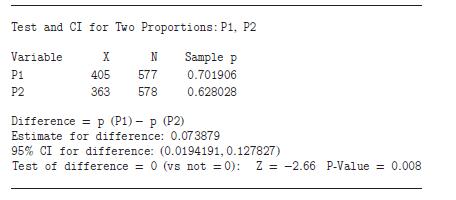
The following computer output(from MINITAB) presents the results of a hypothesis test on the difference between two proportions.a. Is this a left-tailed test, a right-tailed test, or a two-tailed test?b. What is the P-value?c. Can H0 be rejected at the 0.05 level? Explain. Test and CI for Two
A computer manufacturer has a choice of two machines, a less expensive one and a more expensive one, to manufacture a particular computer chip. Out of 500 chips manufactured on the less expensive machine, 70 were defective.Out of 400 chips manufactured on the more expensive machine, only 20 were
A class of 30 computer science students were taught introductory computer programming class with an innovative teaching method that used a graphical interface and drag-and-drop methods of creating computer programs. At the end of the class, 23 of these students said that they felt confident in
In a test of the effect of dampness on electrical connections, 80 electrical connections were tested under damp conditions and 130 were tested under dry conditions. Twenty of the damp connections failed and only 8 of the dry ones failed. If possible, construct a 90% confidence interval for the
3. To construct a confidence interval for p1 − p2, we must have two ______________ samples.In Exercises 3 and 4, fill in each blank with the appropriate word or phrase.
When constructing a confidence interval for p1 − p2, we assume that items in each sample are divided into ________________ categories and that there are at least ________________ items in each category.In Exercises 3 and 4, fill in each blank with the appropriate word or phrase.
The point estimate for p1 − p2 is p̂1 − p̂2, where p̂1 = x1∕n1 and p̂2 = x2∕n2.In Exercises 5 and 6, determine whether the statement is true or false. If the statement is false, rewrite it as a true statement.
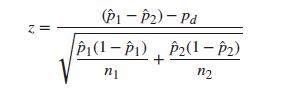
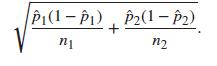
The margin of error for p̂1 − p̂2 isIn Exercises 5 and 6, determine whether the statement is true or false. If the statement is false, rewrite it as a true statement. P1(1-1), 2(1-2) + 112
Level 95%: x1 = 42, n1 = 80, x2 = 18, n2 = 60 In Exercises 7–12, construct the confidence interval for the difference p1 − p2 for the given level and values of x1, n1, x2, and n2.
Level 90%: x1 = 14, n1 = 25, x2 = 12, n2 = 40 In Exercises 7–12, construct the confidence interval for the difference p1 − p2 for the given level and values of x1, n1, x2, and n2.
Level 99%: x1 = 57, n1 = 147, x2 = 86, n2 = 118 In Exercises 7–12, construct the confidence interval for the difference p1 − p2 for the given level and values of x1, n1, x2, and n2.
Level 95%: x1 = 63, n1 = 106, x2 = 70, n2 = 126 In Exercises 7–12, construct the confidence interval for the difference p1 − p2 for the given level and values of x1, n1, x2, and n2.
Showing 5600 - 5700
of 7930
First
50
51
52
53
54
55
56
57
58
59
60
61
62
63
64
Last
Step by Step Answers