New Semester
Started
Get
50% OFF
Study Help!
--h --m --s
Claim Now
Question Answers
Textbooks
Find textbooks, questions and answers
Oops, something went wrong!
Change your search query and then try again
S
Books
FREE
Study Help
Expert Questions
Accounting
General Management
Mathematics
Finance
Organizational Behaviour
Law
Physics
Operating System
Management Leadership
Sociology
Programming
Marketing
Database
Computer Network
Economics
Textbooks Solutions
Accounting
Managerial Accounting
Management Leadership
Cost Accounting
Statistics
Business Law
Corporate Finance
Finance
Economics
Auditing
Tutors
Online Tutors
Find a Tutor
Hire a Tutor
Become a Tutor
AI Tutor
AI Study Planner
NEW
Sell Books
Search
Search
Sign In
Register
study help
business
elementary statistics
Elementary Statistics 3rd Edition William Navidi, Barry Monk - Solutions
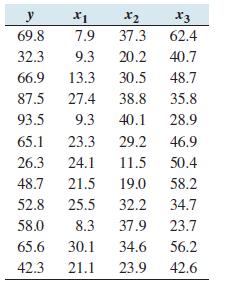
Construct the multiple regression equation ̂y = b0 + b1x1 + b2x2 + b3x3.Exercises 11–15 refer to the following data set: x1 *2 x3 69.8 7.9 37.3 62.4 32.3 9.3 20.2 40.7 66.9 13.3 30.5 48.7 87.5 27.4 38.8 35.8 93.5 9.3 40.1 28.9 65.1 23.3 29.2 46.9 50.4 58.2 26.3 24.1 11.5 48.7 21.5 19.0 52.8 25.5
Predict the value of y when x1 = 20, x2 = 20, and x3 = 30.Exercises 11–15 refer to the following data set: x1 *2 x3 69.8 7.9 37.3 62.4 32.3 9.3 20.2 40.7 66.9 13.3 30.5 48.7 87.5 27.4 38.8 35.8 93.5 9.3 40.1 28.9 65.1 23.3 29.2 46.9 50.4 58.2 26.3 24.1 11.5 48.7 21.5 19.0 52.8 25.5 32.2 34.7 58.0
What percentage of the variation in y is explained by the model?Exercises 11–15 refer to the following data set: x1 *2 x3 69.8 7.9 37.3 62.4 32.3 9.3 20.2 40.7 66.9 13.3 30.5 48.7 87.5 27.4 38.8 35.8 93.5 9.3 40.1 28.9 65.1 23.3 29.2 46.9 50.4 58.2 26.3 24.1 11.5 48.7 21.5 19.0 52.8 25.5 32.2
Is this model useful for prediction? Why or why not? Use the α = 0.05 level.Exercises 11–15 refer to the following data set: x1 *2 x3 69.8 7.9 37.3 62.4 32.3 9.3 20.2 40.7 66.9 13.3 30.5 48.7 87.5 27.4 38.8 35.8 93.5 9.3 40.1 28.9 65.1 23.3 29.2 46.9 50.4 58.2 26.3 24.1 11.5 48.7 21.5 19.0 52.8
Test H0: β1 = 0 versus H1: β1 ≠ 0 at the α = 0.05 level. Repeat for β2 and β3.Exercises 11–15 refer to the following data set: x1 *2 x3 69.8 7.9 37.3 62.4 32.3 9.3 20.2 40.7 66.9 13.3 30.5 48.7 87.5 27.4 38.8 35.8 93.5 9.3 40.1 28.9 65.1 23.3 29.2 46.9 50.4 58.2 26.3 24.1 11.5 48.7 21.5
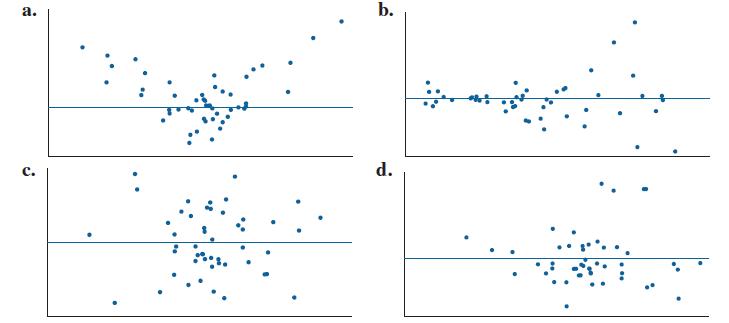
For each of the following residual plots, determine whether the assumptions of the linear model are satisfied. If they are not, specify which assumptions are violated. b. C. d.
A certain data set contains 27 points. The least-squares regression line is computed, with the following results: Construct a 95% confidence interval for β1. b = 5.78, s = 1.35, and (x - x) = 3.4. Se
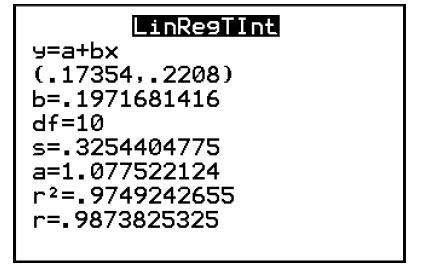
Following is a TI-84 Plus display showing a 95% confidence interval for β1.a. What is the slope of the least-squares regression line?b. How many degrees of freedom are there?c. How many points are in the data set?d. What is the 95% confidence interval for β1? LinRegTInt y=a+bx (.17354.2208)
For a given data set containing 18 points, the assumptions of the linear model are satisfied. The following values are computed: b1 = 5.58 and sb = 4.42. Perform a test of the hypothesis H0 : β1 = 0 versus H1: β1 ≠ 0.Use the α = 0.05 level of significance. Can you conclude that the explanatory
For a given data set containing 26 points, the assumptions of the linear model are satisfied. The following values are computed: b1 = 46.8 and sb = 15.2. Perform a test of the hypothesis H0 : β1 = 0 versus H1: β1 > 0.Use the α = 0.01 level of significance. Can you conclude that the explanatory
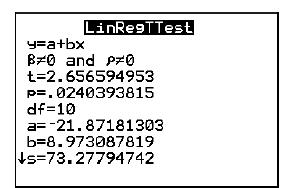
The following TI-84 Plus display presents the results of a test of the null hypothesis H0 : β1 = 0.a. What is the alternate hypothesis?b. What is the value of the test statistic?c. How many degrees of freedom are there?d. What is the P-value?e. Can you conclude that the explanatory variable is
If there are 20 pairs (x, y) in a data set, then the number of degrees of freedom for the critical value is _______________ .In Exercises 7 and 8, fill in each blank with the appropriate word or phrase.
Under the assumptions of the linear model, the values of μy|x follow a _______________ .In Exercises 7 and 8, fill in each blank with the appropriate word or phrase.
Under the assumptions of the linear model, the residual plot will exhibit a linear pattern.In Exercises 9 and 10, determine whether the statement is true or false. If the statement is false, rewrite it as a true statement.
Under the assumptions of the linear model, the vertical spread in a residual plot will be about the same across the plot.In Exercises 9 and 10, determine whether the statement is true or false. If the statement is false, rewrite it as a true statement.
The summary statistics for a certain set of points are: n = 30, se = 3.975, ∑(x − x̄)2 = 15.425, and b1 = 1.212. Assume the conditions of the linear model hold. A 95% confidence interval for β1 will be constructed.a. How many degrees of freedom are there for the critical value?b. What is the
The summary statistics for a certain set of points are: n = 20, se = 4.65, ∑(x − x̄)2 = 118.26, and b1 = 1.62. Assume the conditions of the linear model hold. A 99% confidence interval for β1 will be constructed.a. How many degrees of freedom are there for the critical value?b. What is the
Use the summary statistics in Exercise 11 to test the null hypothesis H0: β1 = 0 versus H1: β1 ≠ 0.Use the α = 0.01 level of significance.
Use the summary statistics in Exercise 12 to test the null hypothesis H0: β1 = 0 versus H1: β1 > 0.Use the α = 0.05 level of significance.
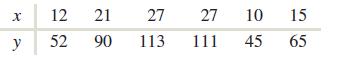
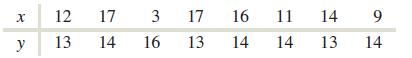
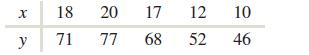
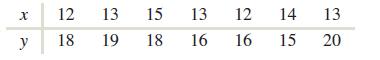
In Exercises 15–18, use the given set of points toa. Compute b1.b. Compute the residual standard deviation se.c. Compute the sum of squares for x, ∑(x − x̄)2.d. Compute the standard error of b1, sb.e. Find the critical value for a 95% confidence interval for β1.f. Compute the margin of
In Exercises 15–18, use the given set of points toa. Compute b1.b. Compute the residual standard deviation se.c. Compute the sum of squares for x, ∑(x − x̄)2.d. Compute the standard error of b1, sb.e. Find the critical value for a 95% confidence interval for β1.f. Compute the margin of
In Exercises 15–18, use the given set of points toa. Compute b1.b. Compute the residual standard deviation se.c. Compute the sum of squares for x, ∑(x − x̄)2.d. Compute the standard error of b1, sb.e. Find the critical value for a 95% confidence interval for β1.f. Compute the margin of
In Exercises 15–18, use the given set of points toa. Compute b1.b. Compute the residual standard deviation se.c. Compute the sum of squares for x, ∑(x − x̄)2.d. Compute the standard error of b1, sb.e. Find the critical value for a 95% confidence interval for β1.f. Compute the margin of
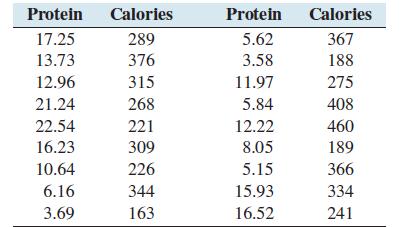
The following table presents the number of grams of protein and the number of calories per 100 grams for each of 18 fast-food products.a. Compute the least-squares regression line for predicting calories (y) from protein (x).b. Construct a 95% confidence interval for the slope.c. Test H0: β1 = 0
In 1906, the statistician Karl Pearson measured the heights of 1078 pairs of fathers and sons. The following table presents a sample of 16 pairs, with height measured in inches, simulated from the distribution specified by Pearson.a. Compute the least-squares regression line for predicting son’s
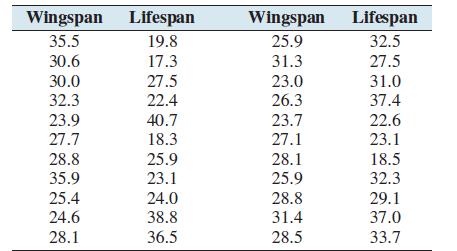
Do larger butterflies live longer? The wingspan (in millimeters) and the lifespan in the adult state (in days) were measured for 22 species of butterfly. Following are the results.a. Compute the least-squares regression line for predicting lifespan (y) from wingspan (x).b. Construct a 99%
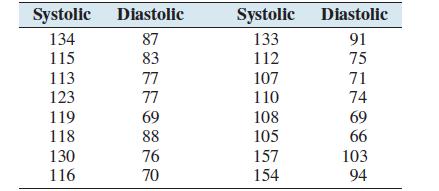
A blood pressure measurement consists of two numbers: the systolic pressure, which is the maximum pressure taken when the heart is contracting, and the diastolic pressure, which is the minimum pressure taken at the beginning of the heartbeat. Blood pressures were measured, in millimeters, for a
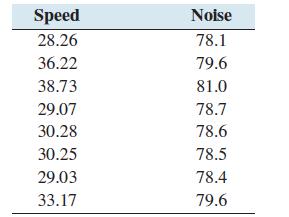
How much noisier are streets where cars travel faster? The following table presents noise levels in decibels and average speed in kilometers per hour for a sample of roads.a. Compute the least-squares regression line for predicting noise level (y) from speed (x).b. Construct a 95% confidence
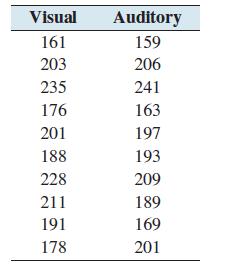
In a study of reaction times, the time to respond to a visual stimulus (x) and the time to respond to an auditory stimulus (y) were recorded for each of 10 subjects. Times were measured in thousandths of a second. The results are presented in the following table.a. Compute the least-squares
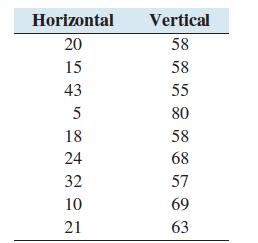
Concrete expands both horizontally and vertically over time. Measurements of horizontal and vertical expansion (in units of parts per hundred thousand) were made at several locations on a bridge in Quebec City in Canada. The results are presented in the following table.a. Compute the least-squares
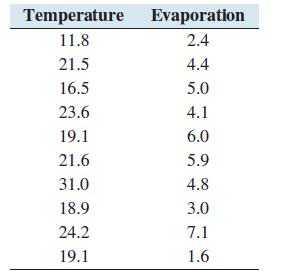
In a study to determine the relationship between ambient outdoor temperature and the rate of evaporation of water from soil, measurements of average daytime temperature in °C and evaporation in millimeters per day were taken for 10 days. The results are shown in the following table.a. Compute the
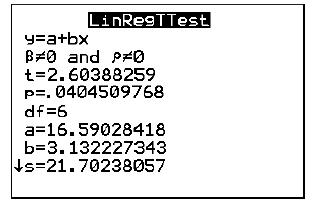
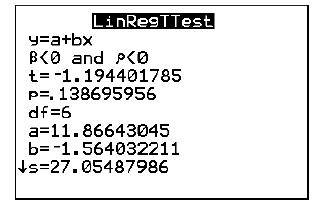
The following TI-84 Plus display presents the results of a test of the null hypothesis H0: β1 = 0.a. What is the alternate hypothesis?b. What is the value of the test statistic?c. How many degrees of freedom are there?d. What is the P-value?e. Can you conclude that the explanatory variable is
The following TI-84 Plus display presents the results of a test of the null hypothesis H0: β1 = 0.a. What is the alternate hypothesis?b. What is the value of the test statistic?c. How many degrees of freedom are there?d. What is the P-value?e. Can you conclude that the explanatory variable is
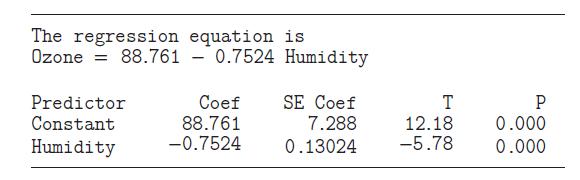
Ozone is a major component of air pollution in many cities. Atmospheric ozone levels are influenced by many factors, including weather. In one study, the mean percent relative humidity (x) and the ozone levels (y) were measured for 120 days in a western city. Ozone levels were measured in parts per
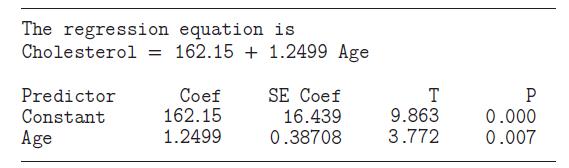
Serum cholesterol levels (y) and age in years (x) were recorded for several men in a medical center. Cholesterol levels were measured in milligrams per deciliter. The following MINITAB output describes the fit of a linear model to these data. Assume that the assumptions of the linear model are
In Example 13.5, we constructed a 95% confidence interval for the slope β1 in the model to predict the number of calories from the number of grams of fat. The 95% confidence interval is 4.8182 μy|20 be the mean number of calories for food products containing 20 grams of fat. Construct a 95%
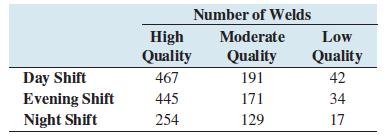
Compute the expected frequencies under the null hypothesis of homogeneity.Exercises 7–9 refer to the following data:At an assembly plant for light trucks, routine monitoring of the quality of welds yielded the following data. Number of Welds High Moderate Quality Quality Low Quality Day Shift 467
Compute the value of the chi-square statistic.Exercises 7–9 refer to the following data:At an assembly plant for light trucks, routine monitoring of the quality of welds yielded the following data. Number of Welds High Moderate Quality Quality Low Quality Day Shift 467 191 42 Evening Shift 445
Can you conclude that the quality varies among shifts? Use the α = 0.01 level of significance.Exercises 7–9 refer to the following data:At an assembly plant for light trucks, routine monitoring of the quality of welds yielded the following data. Number of Welds High Moderate Quality Quality Low
Explain what the expected frequencies represent in a goodness-of-fit test.
If the row variable and column variable are interchanged, how are the expected frequencies affected? Is the value of the chi-square statistic affected? Is the number of degrees of freedom affected?
Find the α = 0.05 critical value for the chi-square distribution with 18 degrees of freedom.
Find the α = 0.10 critical value for the chi-square distribution with 4 degrees of freedom.
Find the area to the right of 29.141 under the chi-square distribution with 14 degrees of freedom.
Find the area to the right of 46.979 under the chi-square distribution with 30 degrees of freedom.
A researcher wants to determine whether children are more likely to be born on certain days of the week. She will sample 350 births and record the day of the week for each. The null hypothesis is that a birth is equally likely to occur on any day of the week. Compute the expected frequencies.
A researcher wants to test the hypothesis that births are more likely to occur on weekdays. The null hypothesis is that 17% of births occur on each of the days Monday through Friday, 10% occur on Saturday, and 5% occur on Sunday. If 350 births are sampled, find the expected frequencies.
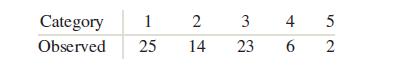
Following are observed frequencies for five categories:a. Compute the expected frequencies for testing H0 : p1 = 0.3, p2 = 0.25, p3 = 0.2, p4 = 0.15, p5 = 0.1.b. One of the observed frequencies is less than 3 4 5 52 14 23 6 2 Category 1 Observed 25 2
Is the chi-square test appropriate?c. Compute the value of X2.d. How many degrees of freedom are there?e. Find the level α = 0.05 critical value.f. Do you reject H0 at the 0.05 level?g. Find the level α = 0.01 critical value.h. Do you reject H0 at the 0.01 level?
For the data in Exercise 7:a. Compute the expected frequencies for testing H0 : p1 = 0.4, p2 = 0.3, p3 = 0.1, p4 = 0.15, p5 = 0.05.b. Is it appropriate to perform a chi-square test for the hypothesis in part (a)?Explain.
For the goodness-of-fit test to be valid, each of the _______________ frequencies must be at least 5.In Exercises 9 and 10, fill in each blank with the appropriate word or phrase.
In a goodness-of-fit test, we reject H0 if the _______________ frequencies are much different from the expected frequencies.In Exercises 9 and 10, fill in each blank with the appropriate word or phrase.
The chi-square distribution is symmetric.In Exercises 11 and 12, determine whether the statement is true or false. If the statement is false, rewrite it as a true statement.
The alternate hypothesis for a goodness-of-fit test says that some of the probabilities differ from those specified by the null hypothesis.In Exercises 11 and 12, determine whether the statement is true or false. If the statement is false, rewrite it as a true statement.
Find the α = 0.05 critical value for the chi-square statistic with 14 degrees of freedom.
Find the α = 0.01 critical value for the chi-square statistic with 5 degrees of freedom.
Find the area to the right of 24.725 under the chi-square distribution with 11 degrees of freedom.
Find the area to the right of 40.256 under the chi-square distribution with 30 degrees of freedom.
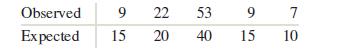
For the following observed and expected frequencies:a. Compute the value of X2.b. How many degrees of freedom are there?c. Test the hypothesis that the distribution of the observed frequencies is as given by the expected frequencies. Use the α = 0.05 level of significance. Observed Expected 9 15
For the following observed and expected frequencies:a. Compute the value of X2.b. How many degrees of freedom are there?c. Test the hypothesis that the distribution of the observed frequencies is as given by the expected frequencies. Use the α = 0.01 level of significance. Observed 43 42 31 19 34
Following are observed frequencies. The null hypothesis is H0: p1 = 0.5, p2 = 0.3, p3 = 0.15, p4 = 0.05.a. Compute the expected frequencies.b. Compute the value of X2.c. How many degrees of freedom are there?d. Test the hypothesis that the distribution of the observed frequencies is as given by the
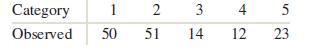
Following are observed frequencies. The null hypothesis is H0: p1 = 0.4, p2 = 0.25, p3 = 0.05, p4 = 0.1, p5 = 0.2.a. Compute the expected frequencies.b. Compute the value of X2.c. How many degrees of freedom are there?d. Test the hypothesis that the distribution of the observed frequencies is as
Mega Millions is a multistate lottery in which players try to guess the numbers that will turn up in a drawing of numbered balls. One of the balls drawn is the Mega Ball. Matching the number drawn on the Mega Ball increases ones winnings. During a recent three-year period, the Mega Ball was drawn
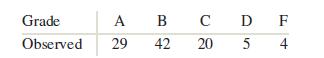
A statistics teacher claims that, on the average, 20% of her students get a grade of A, 35% get a B, 25%get a C, 10% get a D, and 10% get an F. The grades of a random sample of 100 students were recorded. The following table presents the results.a. How many of the students in the sample got an A?
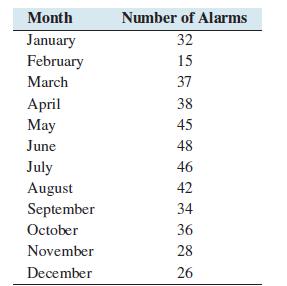
The numbers of false fire alarms were counted each month at a number of sites. The results are given in the following table.Test the hypothesis that false alarms are equally likely to occur in any month. Use the α = 0.01 level of significance. Month Number of Alarms January 32 February 15 March 37
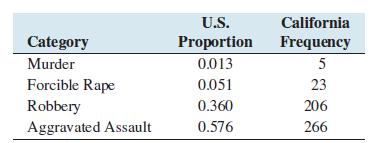
The FBI computed the proportion of violent crimes in the United States falling into each of four categories.A simple random sample of 500 violent crimes committed in California were categorized in the same way. The following table presents the results.Can you conclude that the proportions of crimes
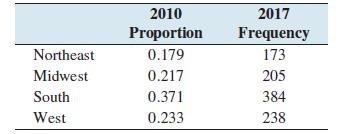
The U.S. Census Bureau computed the proportion of U.S. residents who lived in each of four geographic regions in 2010. Then a simple random sample was drawn of 1000 people living in the United States in 2017. The following table presents the results:Can you conclude that the proportions of people
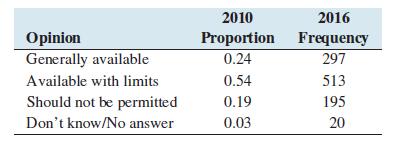
A Gallup poll taken in May 2016 asked 1025 adult Americans to state their opinion on the availability of abortions. The following table presents the results, along with the proportions of people who held these views in 2010.Can you conclude that the proportions of people giving the various
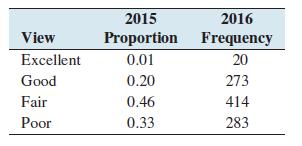
A Heartland Monitor poll taken in December 2016 obtained responses from 990 adult Americans to the question “How would you rate the current state of the economy?Is it excellent, good, fair, or poor?” The following table presents the results, along with the proportions of people who gave these
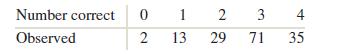
A statistics instructor gave a four-question true–false quiz to his class of 150 students. The results were as follows.The instructor thinks that the students may have answered the questions by guessing, so that the probability that any given answer is correct is 0.5. Under this null hypothesis,
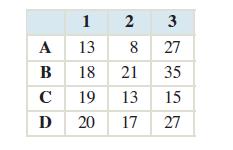
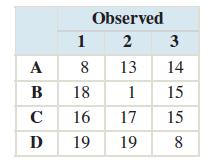
The following contingency table presents observed frequencies. Compute the expected frequencies. 1 2 3 A 13 8 27 B 18 21 35 19 13 15 D 20 17 27
The following contingency table presents observed frequencies.a. Compute the expected frequencies.b. One of the observed frequencies is less than 5.Is it appropriate to perform a test of independence? Explain.c. Compute the value of the test statistic.d. How many degrees of freedom are there?e. Do
To calculate the expected frequencies, we must know the row totals, the column totals, and the ________________ total.In Exercises 3–5, fill in each blank with the appropriate word or phrase.
We reject H0 if the value of the test statistic is _______________ the critical value.In Exercises 3–5, fill in each blank with the appropriate word or phrase.
In the test for _________________ the null hypothesis is that the distribution of the column variable is the same in each row.In Exercises 3–5, fill in each blank with the appropriate word or phrase.
A contingency table containing observed values has three rows and four columns. The number of degrees of freedom for the chi-square statistic is 7.In Exercises 6–8, determine whether the statement is true or false. If the statement is false, rewrite it as a true statement.
In a test of homogeneity, the alternate hypothesis says that the distributions in the rows are the same.In Exercises 6–8, determine whether the statement is true or false. If the statement is false, rewrite it as a true statement.
The procedure for testing homogeneity is the same as the procedure for testing independence.In Exercises 6–8, determine whether the statement is true or false. If the statement is false, rewrite it as a true statement.
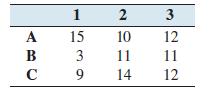
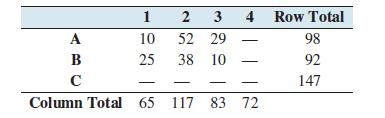
For the given table of observed frequencies:a. Compute the row totals, the column totals, and the grand total.b. Construct the corresponding table of expected frequencies.c. Compute the value of the chi-square statistic.d. How many degrees of freedom are there?e. If appropriate, perform a test of
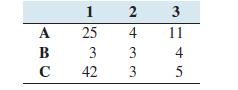
For the given table of observed frequencies:a. Compute the row totals, the column totals, and the grand total.b. Construct the corresponding table of expected frequencies.c. Compute the value of the chi-square statistic.d. How many degrees of freedom are there?e. If appropriate, perform a test of
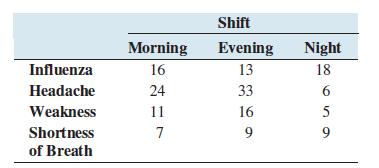
A recent study examined the effects of carbon monoxide exposure on a group of construction workers.The following table presents the numbers of workers who reported various symptoms, along with the shift (morning, evening, or night) that they worked..a. Compute the expected frequencies under the
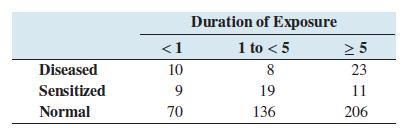
Beryllium is an extremely lightweight metal that is used in many industries, such as aerospace and electronics. Long-term exposure to beryllium can cause people to become sensitized. Once an individual is sensitized, continued exposure can result in chronic beryllium disease, which involves
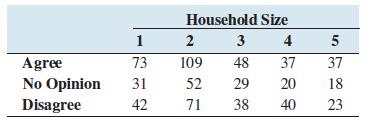
The General Social Survey conducted a poll of 668 adults in which the subjects were asked whether they agree that the government should prohibit smoking in public places.In addition, each was asked how many people lived in his or her household. The results are summarized in the following
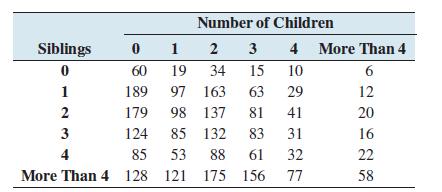
The General Social Survey asked a sample of 2780 adults how many children they had, and also how many siblings (brothers and sisters) they had. The results are summarized in the following contingency table.a. Compute the expected frequencies.b. Compute the value of the test statistic.c. How many
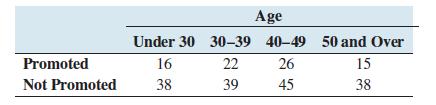
The following table presents the numbers of employees, by age group, who were promoted, or not promoted, in a sample drawn from a certain industry during the past year.Can you conclude that the people in some age groups are more likely to be promoted than those in other age groups? Use the α =
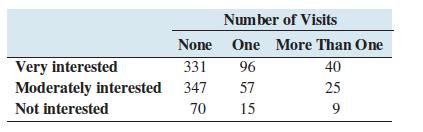
Do people who are interested in environmental issues visit museums more often than people who are not? The General Social Survey asked 990 people how interested they were in environmental issues, and how often they had visited a science museum in the past year. The following table presents the
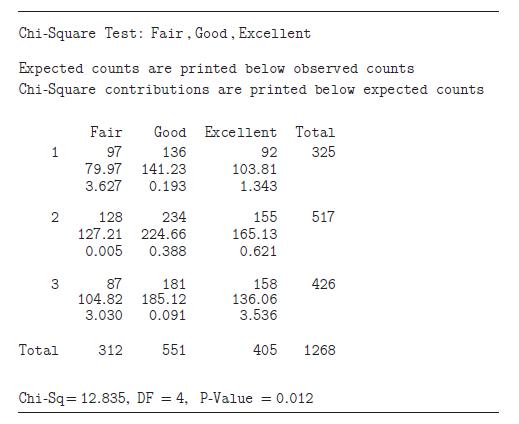
A firm that is planning to market a new cleaning product surveyed 1268 users of the leading competitor’s product. Each person rated the product as fair, good, or excellent. In addition, each person stated whether they use the product rarely (1), occasionally (2), or frequently (3).The firm is
In the following contingency table, the row and column totals are presented, but the data for one row and one column have been omitted. Thus, there are data for only r − 1 rows and c − 1 columns. Show that you can calculate the missing values.Conclude that if (r − 1)(c − 1) entries in the
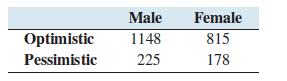
The General Social Survey asked 1373 men and 993 women in the United States whether they agreed that they were generally optimistic about the future. The results are presented in the following table.a. Compute the value of the X2 statistic for testing the hypothesis that the opinion on optimism is
A contingency table containing observed values has four rows and five columns. The value of the chi-square statistic for testing independence is 22.87. Is H0 rejected at the α = 0.05 level?
A goodness-of-fit test is performed to test the null hypothesis that each of the six faces on a die has probability 1∕6 of coming up. The null hypothesis is rejected. True or false: We can conclude that the probability that a 6 comes up is not equal to 1∕6.
A test of homogeneity is performed and the null hypothesis is rejected. True or false: We can conclude that the distributions are not the same in every row.
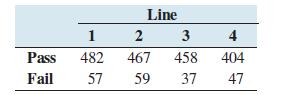
State the appropriate null and alternate hypotheses for determining whether to conclude that the failure rates differ among the four lines.Exercises 4–9 refer to the following data:Electric motors are assembled on four different production lines. Random samples of motors are taken from each line
Compute the expected frequencies.Exercises 4–9 refer to the following data:Electric motors are assembled on four different production lines. Random samples of motors are taken from each line and inspected. The numbers that pass and that fail the inspection are counted for each line, with the
Compute the value of the chi-square statistic.Exercises 4–9 refer to the following data:Electric motors are assembled on four different production lines. Random samples of motors are taken from each line and inspected. The numbers that pass and that fail the inspection are counted for each line,
How many degrees of freedom are there?Exercises 4–9 refer to the following data:Electric motors are assembled on four different production lines. Random samples of motors are taken from each line and inspected. The numbers that pass and that fail the inspection are counted for each line, with the
Find the critical value for the ???? = 0.05 level of significance.Exercises 4–9 refer to the following data:Electric motors are assembled on four different production lines. Random samples of motors are taken from each line and inspected. The numbers that pass and that fail the inspection are
State a conclusion.Exercises 4–9 refer to the following data:Electric motors are assembled on four different production lines. Random samples of motors are taken from each line and inspected. The numbers that pass and that fail the inspection are counted for each line, with the following results:
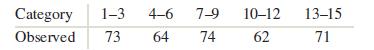
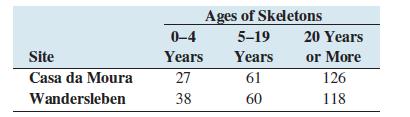
State the appropriate null and alternate hypotheses for determining whether to conclude that the age distributions differ between the two sites.Exercises 10–15 refer to the following data:Anthropologists can estimate the birthrate of an ancient society by studying the age distribution of
Compute the expected frequencies.Exercises 10–15 refer to the following data:Anthropologists can estimate the birthrate of an ancient society by studying the age distribution of skeletons found in ancient cemeteries. An article in the journal Current Anthropology presented the following numbers
Showing 5500 - 5600
of 7930
First
49
50
51
52
53
54
55
56
57
58
59
60
61
62
63
Last
Step by Step Answers