New Semester
Started
Get
50% OFF
Study Help!
--h --m --s
Claim Now
Question Answers
Textbooks
Find textbooks, questions and answers
Oops, something went wrong!
Change your search query and then try again
S
Books
FREE
Study Help
Expert Questions
Accounting
General Management
Mathematics
Finance
Organizational Behaviour
Law
Physics
Operating System
Management Leadership
Sociology
Programming
Marketing
Database
Computer Network
Economics
Textbooks Solutions
Accounting
Managerial Accounting
Management Leadership
Cost Accounting
Statistics
Business Law
Corporate Finance
Finance
Economics
Auditing
Tutors
Online Tutors
Find a Tutor
Hire a Tutor
Become a Tutor
AI Tutor
AI Study Planner
NEW
Sell Books
Search
Search
Sign In
Register
study help
business
elementary statistics
Elementary Statistics 4th Edition William Navidi , Barry Monk - Solutions
Phones: The following relative frequency distribution presents the U.S.market share, in percent, of various phone companies in a recent year.a. Construct a relative frequency bar graph.b. Construct a pie chart.c. True or false: There are more than twice as many Apple users than Samsung users.
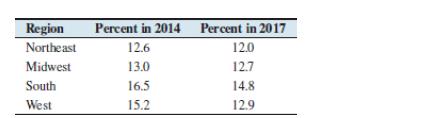
Poverty rates: The following table presents the percentage of people who lived in poverty in the various regions of the United States in the years 2014 and 2017.a. Construct a side-by-side bar graph for these data.b. True or false: The poverty rate was lower in 2017 than in 2014 in each region.c.
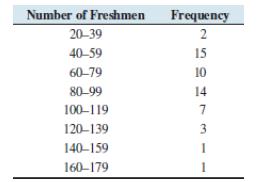
House freshmen: Newly elected members of the U.S. House of Representatives are referred to as “freshmen.” The following frequency distribution presents the number of freshmen elected in each election from 1912 to 2016.a. How many classes are there?b. What is the class width?c. What are the
More royalty: Construct a stem-and-leaf plot for the data in Exercise 8.
Dotplot: Construct a dotplot for the data in Exercise 10.
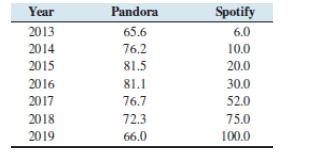
Pandora vs. Spotify: Following are the numbers of subscribers (in millions)to the music streaming services Pandora and Spotify for the years 2013 through 2019:a. Construct a time-series plot for the number of Pandora subscribers.b. Construct a time-series plot for the number of Spotify
Cancer rates: Cancer has long been the second most common cause of death (behind heart disease) in the United States. Cancer risk increases with age, so that older people are much more likely to be diagnosed with cancer than younger people. The following time-series plots present the number of
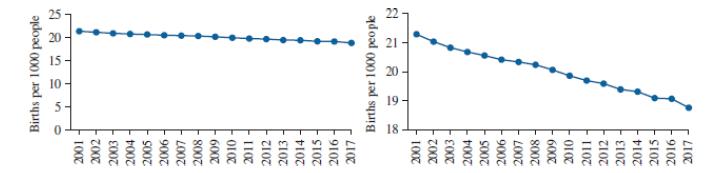
Falling birth rate: The following time-series plots both present estimates for the number of births per 1000 people worldwide for the years 2001–2017. (Source: The World Bank)Which of the following statements is more accurate? Explain your reasoning.(i) The birth rate decreased somewhat between
Shapes of histograms: Each student tosses five dice and adds the numbers.Then each student tosses two dice and multiplies the numbers. Construct histograms for the results of each experiment. What are their shapes?
Different graphs: Collect data on variables for each student. Potential variables include height, number of siblings, number of pets, and number of classes currently taken. For each variable, construct a dotplot, a stem-andleaf plot, and a histogram. Discuss the advantages and disadvantages of each
Misleading graphs: Look through the internet, newspapers, or magazines for misleading graphs. Explain how they are misleading. Then find some that present accurate comparisons, and explain why you believe they are accurate.
Construct a frequency distribution for the hybrid cars with a class width of 2.
Explain why a class width of 2 is too narrow for these data.
Construct a relative frequency distribution for the hybrid cars with a class width of 3, where the first class has a lower limit of 18.
Construct a frequency distribution for the non-hybrid cars with an appropriate class width.
Using this class width, construct a relative frequency distribution for the non-hybrid cars.
Compare the histogram for the hybrid cars with the histogram for the nonhybrid cars. For which cars do the mileages vary more?
Refer to Exercise 3.Find the critical value for a 95% confidence interval for the difference p1 − p2.
Refer to Exercise 3.Compute the margin of error for a 95% confidence interval for the difference p1 − p2.
Refer to Exercise 3.Construct a 95% confidence interval for the difference p1 − p2.
Refer to Exercise 7.Find the critical value for a 99% confidence interval for μd.
Refer to Exercise 7.Compute the margin of error for a 99% confidence interval for the difference μd.
Refer to Exercise 7.Construct a 99% confidence interval for the difference μd.
Refer to Exercise 11.Find the critical value for a 90% confidence interval for the difference μ1 − μ2.
Refer to Exercise 11.Compute the margin of error for a 90% confidence interval for the difference μ1 − μ2.
Refer to Exercise 11.Construct a 90% confidence interval for the difference μ1 − μ2.
Don’t construct a confidence interval: An investor is trying to decide in which of two stocks to invest. He examines records for the past 365 days and finds that the price of stock A increased on 197 of them and the price of stock B increased on 158 of them. Explain why these data should not be
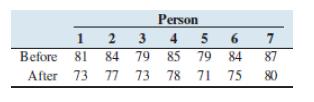
Exercise and heart rate: A simple random sample of seven people embarked on a program of regular aerobic exercise. Their heart rates, in beats per minute, were measured before and after, with the following results:Construct a 95% confidence interval for the mean reduction in heart rate. Person 1 2
College tuition: Independent random samples of private college and university tuition and fees for a recent academic year from California and New York yielded the following data, in dollars.Construct a 95% confidence interval for the difference between the mean amounts of tuition in the two states.
Recovery time from surgery: A new postsurgical treatment is being compared with a standard treatment. Seven subjects receive the new treatment, while seven others (the controls) receive the standard treatment. The recovery times, in days, are given below.Construct a 98% confidence interval for the
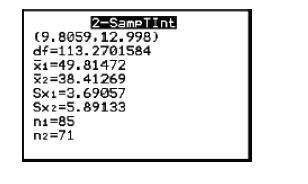
Interpret calculator display: The following TI-84 Plus calculator display presents a 95% confidence interval for the difference between two means. The sample sizes are n1 = 85 and n2 = 71.a. Find the point estimate of μ1 − μ2.b. How many degrees of freedom did the calculator use?c. Fill in the
Interpret computer output: The following MINITAB output display presents a 95% confidence interval for the difference between two means.a. Find the point estimate of μ1 − μ2.b. How many degrees of freedom did MINITAB use?c. Fill in the blanks: We are _________ confident that the difference
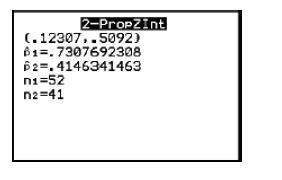
Interpret calculator display: The following TI-84 Plus calculator display presents a 95% confidence interval for the difference between two proportions.a. Find the point estimate of p1 − p2.b. Fill in the blanks: We are 95% confident that the difference between the proportions is between
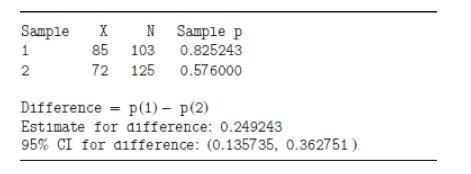
Interpret computer output: The following MINITAB output presents a confidence interval for the difference between two proportions.a. Find the point estimate of p1 − p2.b. Fill in the blanks: We are _________ confident that the difference between the proportions is between _________ and _________.
Confidence level: Each student tosses both a penny and a nickel 50 times each and constructs a 90%, a 95%, and a 99% confidence interval for the difference in the proportion of heads. How many of the 90%confidence intervals would you expect to contain the true value of 0?How many do? Repeat for the
Paired versus independent samples: For each student, measure the distance from the knee to the ankle and the distance from the elbow to the wrist. Construct a 95% confidence interval for the difference in two ways: first using paired differences, and second treating the samples as independent.
Based on the confidence intervals in Exercise 1, for which health characteristics does it appear that the assignment to groups is not balanced?
Based on the confidence intervals in Exercise 1, does it appear that the imbalance is large enough to be of concern? Explain.
Compute the point estimates b0 and b1.
Construct a 95% confidence interval for β1.
Test the hypotheses H0: β1 = 0 versus H1: β1 ≠ 0.Use the α = 0.01 level of significance.
Construct a 95% confidence interval for the mean response when x = 20.
Construct a 95% prediction interval for an individual response when x = 20.
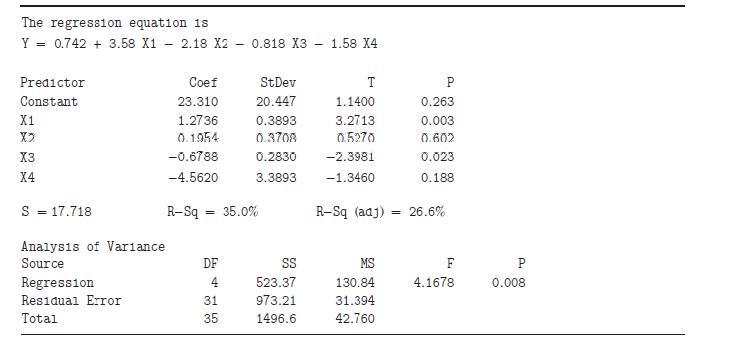
Construct the multiple regression equation = b + bx + bx2 +bzxz.
Predict the value of y when x1 = 20, x2 = 20, and x3 = 30.
What percentage of the variation in y is explained by the model?
Is this model useful for prediction? Why or why not? Use the α = 0.05 level.
Test H0: β1 = 0 versus H1: β1 ≠ 0 at the α = 0.05 level. Repeat for β2 and β3.
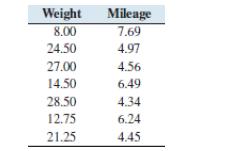
How’s your mileage? Weight (in tons) and fuel economy (in mpg) were measured for a sample of seven diesel trucks. The results are presented in the following table.a. Compute the least-squares regression line for predicting mileage (y)from weight (x).b. Construct a 95% confidence interval for the
How much wood is in that tree? Use the data in Exercise 3 for the following.a. Compute a point estimate for the mean volume for trees with a diameter of 44 centimeters.b. Construct a 95% confidence interval for the mean volume of trees with a diameter of 44 centimeters.c. Predict the volume for a
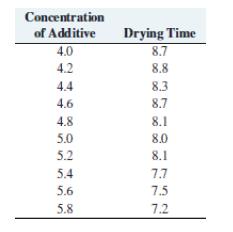
Watching paint dry: In tests designed to measure the effect of the concentration (in percent) of a certain additive on the drying time (in hours)of paint, the following data were obtained.a. Compute the least-squares regression line for predicting drying time (y)from concentration (x).b. Construct
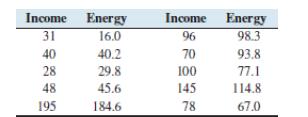
Energy use: A sample of 10 households was monitored for one year. The household income (in $1000s) and the amount of energy consumed (in 1010 joules) were determined. The results follow.a. Compute the least-squares line for predicting energy consumption (y)from income (x).b. Compute a 95%
Energy use: Use the data in Exercise 7 for the following.a. Compute a point estimate for the mean energy use for families with an income of $50,000.b. Construct a 95% confidence interval for the mean energy use for families with an income of $50,000.c. Predict the energy use for a particular family
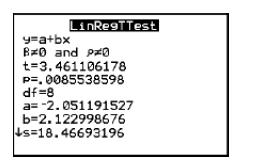
Interpret calculator display: The following TI-84 Plus display presents the results of a test of the null hypothesis H0: β1 = 0.a. What is the alternate hypothesis?b. What is the value of the test statistic?c. How many degrees of freedom are there?d. What is the P-value?e. Can you conclude that
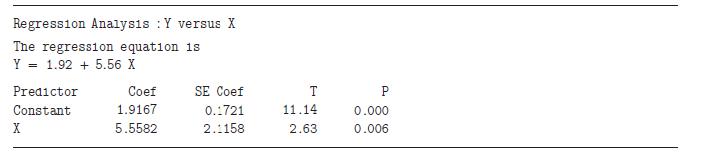
Interpret computer output: The following MINITAB output presents the results of a test of the null hypothesis H0: β1 = 0.a. What are the slope and intercept of the least-squares regression line?b. Can you conclude that x is useful for predicting y? Use the α = 0.05 level of significance.
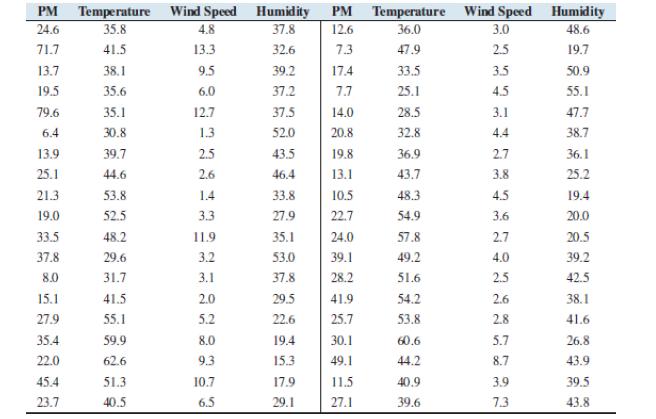
Air pollution: Following are measurements of particulate matter (PM)concentration (in micrograms per cubic meter), temperature, in degrees Fahrenheit, wind speed in miles per hour, and humidity in percent for 38 days in Denver, Colorado.a. Let y represent PM, x1 represent temperature, x2 represent
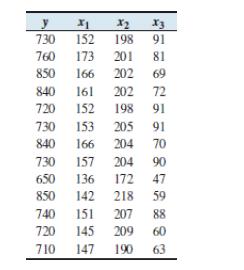
Icy lakes: Following are data on maximum ice thickness in millimeters (y), average number of days per year of ice cover (x1), average number of days the bottom temperature is lower than 8°C(x2), and the average snow depth in millimeters (x3) for 13 lakes in Minnesota.a. Construct the multiple
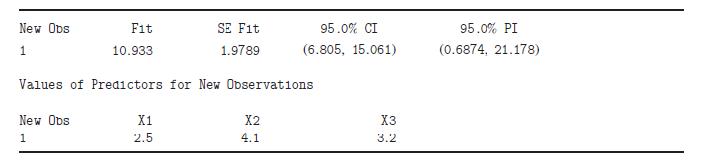
Confidence and prediction intervals: The following MINITAB output presents a confidence interval for a mean response and a prediction interval for an individual response.a. Predict the value of y when x1 = 2.5, x2 = 4.1, and x3 = 3.2.b. We are 95% confident that an individual whose values are x1 =
Drop that variable: The following MINITAB output presents a multiple regression equationIt is desired to drop one of the explanatory variables. Which of the following is the most appropriate action?i. Drop x1, then see whether R2 increases.ii. Drop x2, then see whether adjusted R2 increases.iii.
The quantity measures the spread in the x-values. Explain why usingx-values that are more spread out will result in a narrower confidence interval for β1. x-x)
Height and arm span: Your arm span is the distance between the middle fingertips on each hand when your arms are stretched out as far as you can reach. It is commonly thought that a person’s arm span is approximately equal to his or her height. Investigate this by measuring each student’s arm
Uncorrelated dice: Each student has two dice, one of which is thought of as x and the other as y. Each student rolls his or her dice 20 times, computes the correlation between x and y, and tests the hypothesis H0: ρ = 0 versus H1: ρ ≠ 0.How many students reject H0 at the α = 0.05 level? Does
Use the least-squares regression line computed in Exercise 3 to predict the power when the wind speed is 5.0 mph. (Note that the value of the explanatory variable is 53 = 125.)
Use the least-squares regression line computed in Exercise 3 to compute a 95% confidence interval for the mean power on days when the wind speed is 5.0 mph.
Use the least-squares regression line computed in Exercise 3 to compute a 95% prediction interval for the power on a given day when the wind speed is 5.0 mph.
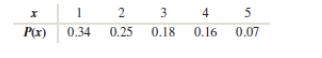
Refer to Exercise 2.a. Find the variance of the random variable X.b. Find the standard deviation of the random variable X.
Refer to Problem 5.Find the probability that a randomly selected family has:a. 1 or 2 petsb. More than 2 petsc. No more than 3 petsd. At least 1 pet
Refer to Exercise 5.Find the mean number of pets.
Refer to Exercise 5.Find the standard deviation of the number of pets.
At a phone battery plant, 5% of phone batteries produced are defective. A quality control engineer randomly collects a sample of 50 batteries from a large shipment from this plant and inspects them for defects. Find the probability thata. None of the batteries are defective.b. At least one of the
Refer to Exercise 9.Find the mean and standard deviation for the number of defective batteries in the sample of size 50.
The number of text messages received on a certain person’s phone follows a Poisson distribution with the rate of 10 messages per hour. What is the mean number of messages received in an 8-hour period?
Refer to Exercise 13.What are the variance and standard deviation of the number of messages received in an 8-hour period?
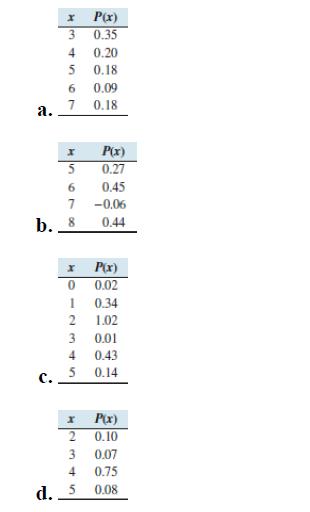
Which are distributions? Which of the following tables represent probability distributions? I P(x) 3 0.35 4 0.20 5 0.18 6 0.09 a. 7 0.18 I P(x) 5 0.27 6 0.45 7 -0.06 b. 8 0.44 P(x) 0 0.02 1 0.34 2 1.02 3 0.01 C. 4 0.43 5 0.14 I P(x) 2 0.10 3 0.07 4 0.75 d. 5 0.08
AP tests: Advanced Placement (AP) tests are graded on a scale of 1 (low)through 5 (high). The College Board reported that the distribution of scores on the AP Statistics Exam in a recent year was as follows:A score of 3 or higher is generally required for college credit. What is the probability
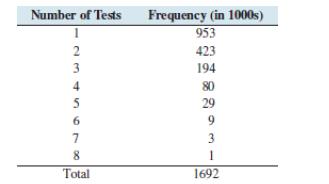
AP tests again: During a recent academic year, approximately 1.7 million students took one or more AP tests. Following is the frequency distribution of the number of AP tests taken by students who took one or more AP tests.Let X represent the number of exams taken by a student who took one or
Lottery tickets: Several million lottery tickets are sold, and 60% of the tickets are held by women. Five winning tickets will be drawn at random.a. What is the probability that three or fewer of the winners will be women?b. What is the probability that three of the winners will be of one gender
Reading tests: According to the National Center for Education Statistics, 66% of fourth graders could read at a basic level in a recent year. Suppose that eight fourth graders are randomly selected.a. Find the probability that exactly five of them can read at a basic level.b. Find the probability
Rain, rain, go away: Let X be the number of days during the next month that it rains. Does X have a binomial distribution? Why or why not?
Survey sample: In a college with 5000 students, 100 are randomly chosen to complete a survey in which they rate the quality of the cafeteria food. Let X be the number of freshmen who are chosen. Does X have a binomial distribution? Why or why not?
Mean: Refer to Exercise 12.Find the mean number of particles that are withdrawn.
Congenital disease: The connexin-26 mutation is a genetic mutation that results in deafness. The probability that a person carries a gene with this mutation is 0.0151. Use the Poisson approximation to find the probability that exactly 10 people in a sample of 500 carry this mutation.
Unusual events: Divide students into pairs. One member of each pair tosses a coin 20 times. The other member tries to guess the outcome of each toss before it is made. Each pair records the number of correct guesses. What is the distribution of the number of correct guesses out of 20? Did any pair
Benford’s Law: Ask each student to provide the first digit of their address.Does the distribution of these digits follow Benford’s Law, as described in the Case Study for this chapter?
The amount of time that a certain phone will keep a charge is known to be normally distributed with standard deviation σ =16 hours. A sample of 40 phones had a mean time of 141 hours. Let μrepresent the population mean time that a phone will keep a charge.a. What is the point estimate of μ?b.
Refer to Exercise 10.Suppose that a 95% confidence interval is to be constructed for the mean time.a. What is the critical value?b. What is the margin of error?c. Construct the 95% confidence interval.
Refer to Exercise 10.What sample size is necessary so that a 95%confidence interval will have a margin of error of 1 hour?
Refer to Exercise 13.How large a sample is needed so that a 99%confidence interval will have margin of error of 0.08, using the sample proportion for p?
Refer to Exercise 13.How large a sample is needed so that a 99%confidence interval will have margin of error of 0.08, assuming no estimate of is available?
Build more parking? A survey is to be conducted in which a random sample of residents in a certain city will be asked whether they favor or oppose the building of a new parking structure downtown. How many residents should be polled to be sure that a 90% confidence interval for the proportion who
Drill lifetime: A sample of 50 drills had a mean lifetime of 12.68 holes drilled when drilling a low-carbon steel. Assume the population standard deviation is 6.83.a. Construct a 95% confidence interval for the mean lifetime of this type of drill.b. The manufacturer of the drills claims that the
Cost of environmental restoration: In a survey of 189 Scottish voters, 61 said they would be willing to pay additional taxes in order to restore the Affric forest.a. Assuming that the 189 voters who responded constitute a random sample, construct a 99% confidence interval for the proportion of
More repairs: A sample of six records for repairs of a component showed the following costs:93 97 27 79 81 87a. Construct a 90% confidence interval for the mean cost of a repair for this type of component.b. Is there any evidence to suggest that this confidence interval may not be reliable? Explain.
More repairs: Refer to Exercise 4.Would it be appropriate to use these data to construct a confidence interval for σ using the methods of Section 8.4? Explain.
Contaminated water: Polychlorinated biphenyls (PCBs) are a group of synthetic oil-like chemicals that were at one time widely used as insulation in electrical equipment and were discharged into rivers. They were discovered to be a health hazard and were banned in the 1970s.Assume that water samples
Defective electronics: A simple random sample of 200 electronic components was tested, and 17 of them were found to be defective.a. Construct a 99% confidence interval for the proportion of components that are defective.b. Use the results from the sample of 200 to estimate the sample size needed so
Cost of repairs: A sample of eight repair records for a certain fiberoptic component was drawn, and the cost of each repair, in dollars, was recorded, with the following results:30 35 19 23 27 22 26 16a. Construct a dotplot for these data. Are the assumptions for constructing a confidence interval
Super Bowl: A simple random sample of 140 residents in a certain town was polled the week after the Super Bowl, and 75 of them said they had watched the game on television.a. Construct a 95% confidence interval for the proportion of people in the town who watched the Super Bowl on television.b.
Testing math skills: In order to test the effectiveness of a program to improve mathematical skills, a simple random sample of 45 fifth graders was chosen to participate in the program. The students were given an exam at the beginning of the program and again at the end. The sample mean increase in
Sleep time: In a sample of 87 young adults, the average time per day spent in bed asleep was 7.06 hours. Assume the population standard deviation is 1.11 hours.a. Construct a 99% confidence interval for the mean time spent in bed asleep.b. Some health experts recommend that people get 8 hours or
Showing 5000 - 5100
of 7930
First
44
45
46
47
48
49
50
51
52
53
54
55
56
57
58
Last
Step by Step Answers