New Semester
Started
Get
50% OFF
Study Help!
--h --m --s
Claim Now
Question Answers
Textbooks
Find textbooks, questions and answers
Oops, something went wrong!
Change your search query and then try again
S
Books
FREE
Study Help
Expert Questions
Accounting
General Management
Mathematics
Finance
Organizational Behaviour
Law
Physics
Operating System
Management Leadership
Sociology
Programming
Marketing
Database
Computer Network
Economics
Textbooks Solutions
Accounting
Managerial Accounting
Management Leadership
Cost Accounting
Statistics
Business Law
Corporate Finance
Finance
Economics
Auditing
Tutors
Online Tutors
Find a Tutor
Hire a Tutor
Become a Tutor
AI Tutor
AI Study Planner
NEW
Sell Books
Search
Search
Sign In
Register
study help
business
essentials of econometrics
Essential Statistics Regression And Econometrics 1st Edition Gary Smith - Solutions
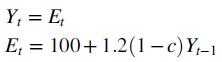
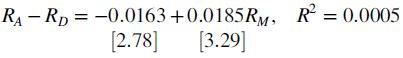
Consider this dynamic income-expenditure model:where Y is national income, E is spending, and c is the tax rate on income (0 Y = E E = 100+ 1.2(1c) Y-1
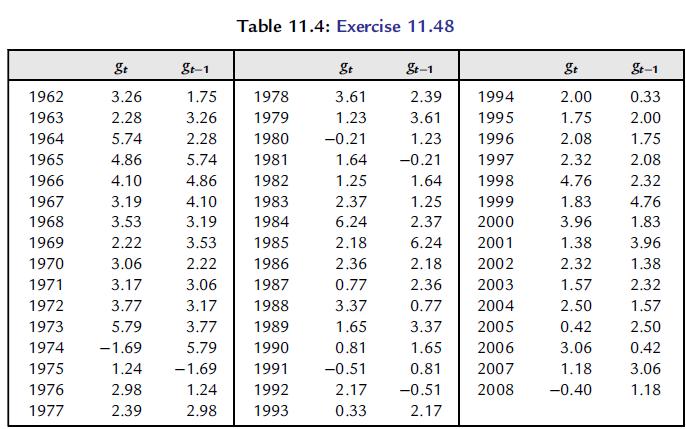
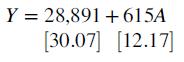
The data in Exercise 9.39 were used to calculate the annual percentage change in real per capita disposable personal income, gt = 100(Yt − Yt−1)/Yt−1 (Table 11.4).a. Use least squares to estimate the relationship between this year’s growth rate and the previous year’s growth rate: gt = α
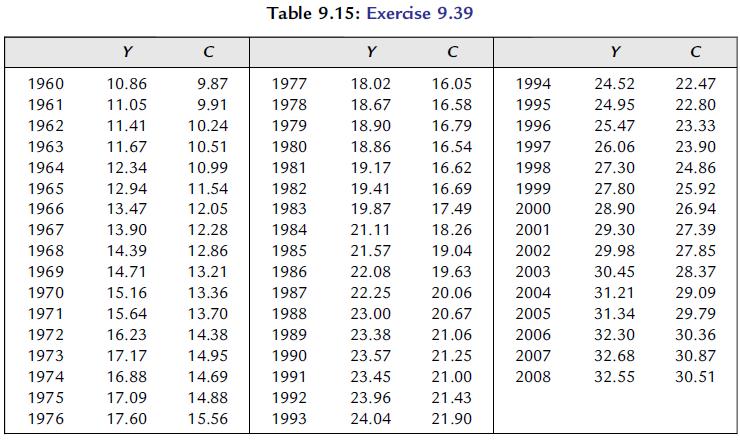
Consider this model of government fiscal policy:where G is government spending, H is taxes, Z is the government deficit, Y is national income, and t is time (t = 0 in the current year). All the variables G, H, Z, and Y are in real terms; G0, Y0, α, β, and θ are constant parameters.a. Interpret
Consider this model in which national income Y depends on the previous period’s income and the current and previous period’s money supply M:where the parameters α, β1, β2, and β3 are positive.a. If the money supply is held constant, show the conditions under which the model is stable.b. If
Which of these data are quantitative and which are qualitative?a. The number of years a professor has been teaching.b. The number of books a professor has written.c. Whether a professor has a Ph.D.d. The number of courses a professor is teaching.
Which of these data are categorical and which are numerical?a. Whether a family owns or rents their home.b. A house’s square footage.c. The number of bedrooms in a house.d. Whether a house has central air conditioning.
Which of these data are categorical and which are numerical?a. Whether a computer is made by Apple or by another company.b. The size of a computer monitor.c. The speed of a computer processor.d. Whether a computer has a firewire port.
Which of these data are quantitative and which are qualitative?a. A country’s unemployment rate.b. A country’s population.c. A country’s gross domestic product (GDP).d. Whether a country belongs to the European Union.
Identify the following data as cross-section, time series, or panel data:a. Unemployment rates in Germany, Japan, and the United States in 2010.b. Unemployment and inflation rates in Germany, Japan, and the United States in 2009.c. Unemployment rates in Germany in 2007, 2008, 2009, and 2010.d.
The Framingham Heart Study began in 1948 with 5,209 adult subjects, who have returned every two years for physical examinations and laboratory tests. The study now includes the children and grandchildren of the original participants. Identify the following data as cross-section, time series, or
(continuation) Identify the following data as cross-section, time series, or panel data:a. Blood pressure of one woman every two years.b. The average HDL cholesterol level of the men in 1948, 1958, and 1968.c. The number of children each woman had in 1958.d. The age at death of the 5,209 subjects.
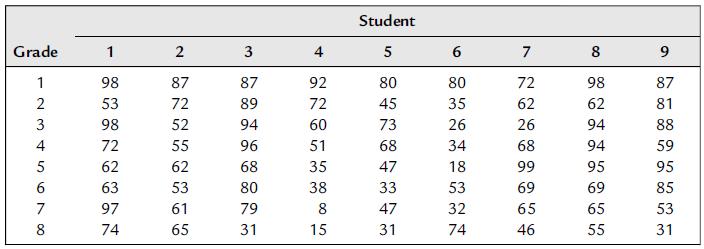
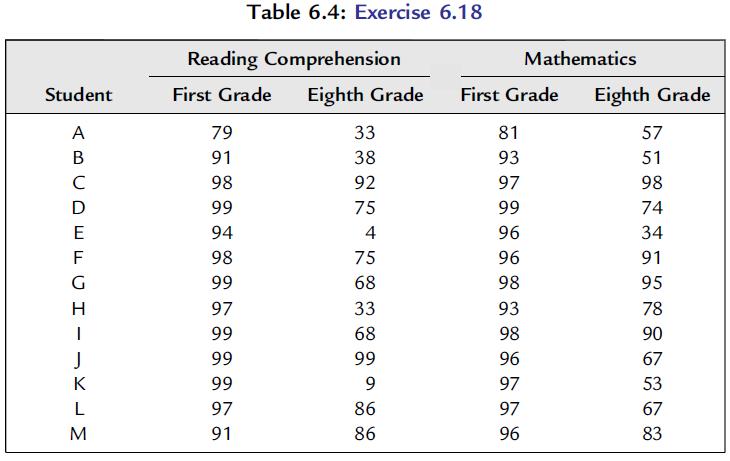
Table 1.12 lists the reading comprehension scores for nine students at a small private school known for its academic excellence. Twenty students were admitted to the kindergarten class, and the nine students in the table stayed at the school through eighth grade. The scores are percentiles relative
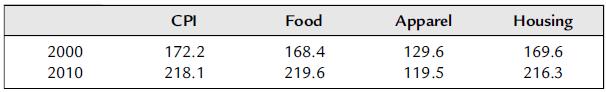
Table 1.13 shows index data on the overall CPI and three items included in the CPI.Explain why you either agree or disagree with these statements:a. Food cost more than housing in 2010.b. Housing cost more than food in 2000 but cost less than food in 2010.c. The cost of food went up more than the
(continuation) Explain why you either agree or disagree with these statements:a. Apparel cost less than food in 2000.b. The cost of apparel went down between 2000 and 2010.c. The cost of food went up more than the overall CPI between 2000 and 2010.
(continuation) Calculate the percentage change in the cost of food, apparel, and housing between 2000 and 2010.
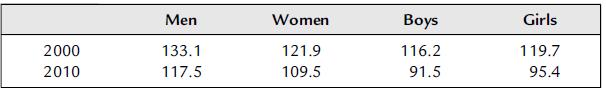
Table 1.14 shows data on four apparel price indexes that are used to compute the CPI.Explain why you either agree or disagree with these statements:a. Men’s apparel cost more than women’s apparel in 2000.b. Men’s apparel cost more than women’s apparel in 2010.c. Men’s apparel cost more in
Explain why you either agree or disagree with these statements:a. Men’s apparel is more expensive than women’s apparel, but boy’s apparel is less expensive than girl’s apparel.b. The cost of boy’s apparel went down between 2000 and 2010.c. The cost of boy’s apparel went down more than
Calculate the percentage change in the cost of each of these four types of apparel between 2000 and 2010.
Why does it make no sense to deflate a country’s population by its price level in order to obtain the “real population”?
It has been proposed that real wealth should be calculated by deflating a person’s wealth by hourly wages rather than prices. Suppose that wealth is $100,000, the price of a hamburger is $2, and the hourly wage is $10. What conceptual difference is there between these two measures of real wealth?
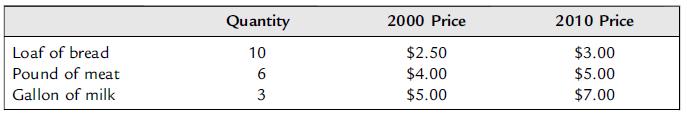
Table 1.15 shows the prices of three items in 2000 and 2010.a. Construct a price index that is equal to 100 in 2000. What is the value of your index in 2010? What is the percentage change in your index between 2000 and 2010?b. Construct a price index that is equal to 100 in 2010. What is the value
Answer the questions in Exercise 1.17, this time assuming that the quantities purchased are 12 loaves of bread, 6 pounds of meat, and 2 gallons of milk.Exercise 1.17Table 1.15 shows the prices of three items in 2000 and 2010.a. Construct a price index that is equal to 100 in 2000. What is the value
The Dow Jones Industrial Average was 240.01 on October 1, 1928 (when the Dow expanded to 30 stocks), and 14,087.55 on October 1, 2007. The CPI was 51.3 in 1928 and 617.7 in 2007. Which had a larger percentage increase over this period, the Dow or the CPI?
On January 11, 2008, the value of the Dow Jones Industrial Average was 12,606.30, and the divisor was 0.123017848. Explain why you either agree or disagree with these statements:a. The average price of the 30 stocks in the Dow was 12,606.30.b. The average price of the 30 stocks in the Dow was
Look up the values of the CPI in December 1969 and December 1989 and the Dow Jones Industrial Average on December 31, 1969, and December 31, 1989.Did consumer prices or stock prices increase more over this 20-year period? Did the real value of stocks increase or decline?
Look up the values of the CPI in December 1989 and in December 2009 and the Dow Jones Industrial Average on December 31, 1989, and on December 31, 2009.Did consumer prices or stock prices increase more over this 20-year period? Did the real value of stocks increase or decline?
Two professors calculated real stock prices (adjusted for changes in the CPI) back to 1857 and concluded that [18] inflation-adjusted stock prices were approximately equal to nominal stock prices in 1864–1865, were greater than nominal prices through 1918, tracked them rather closely …
The authors of the study cited in the preceding exercise go on to consider what would have to happen for nominal stock prices to again equal real stock prices. What is the correct answer?Preceding exerciseTwo professors calculated real stock prices (adjusted for changes in the CPI) back to 1857 and
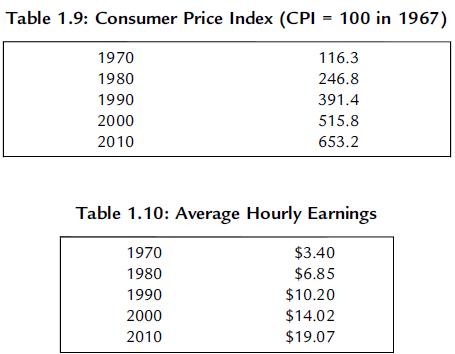
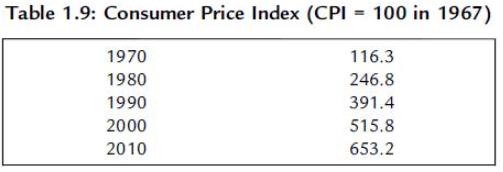
Use the data in Tables 1.9 and 1.10 to determine thea. 1970 wage in 2010 dollars.b. Percentage change in real wages between 1970 and 2010. Table 1.9: Consumer Price Index (CPI = 100 in 1967) 1970 1980 1990 2000 2010 116.3 246.8 391.4 515.8 653.2 Table 1.10: Average Hourly Earnings 1970 $3.40 1980
Use the data in Tables 1.9 and 1.10 to determine thea. 1980 wage in 2000 dollars.b. Percentage change in real wages between 1980 and 2000. Table 1.9: Consumer Price Index (CPI = 100 in 1967) 1970 1980 1990 2000 2010 116.3 246.8 391.4 515.8 653.2 Table 1.10: Average Hourly Earnings 1970 $3.40 1980
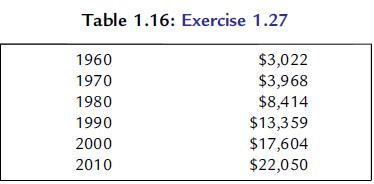
Table 1.16 shows the official U.S. poverty thresholds for families of four people. Use the CPI data in Table 1.9 to calculate the real poverty thresholds in 1960 dollars in each of the years shown. => Table 1.9: Consumer Price Index (CPI = 100 in 1967) 1970 116.3 1980 246.8 1990 391.4 2000 515.8
Babe Ruth was paid $80,000 in 1931. When it was pointed out that this was morethan President Hoover made, he replied, “I had a better year than he did.” Using a base 100 in 1967, the CPI was 45.6 in 1931 and 653.2 in 2010. What was the value of Babe Ruth’s 1931 salary in 2010 dollars? Is this
The first professional football player was W. W. Pudge Heffelfinger, a former All-American at Yale, who was working on a railroad in 1892 when he was paid $500 to play one game for the Allegheny Athletic Association against the Pittsburgh Athletic Club. (Pudge scored the game’s only touchdown, on
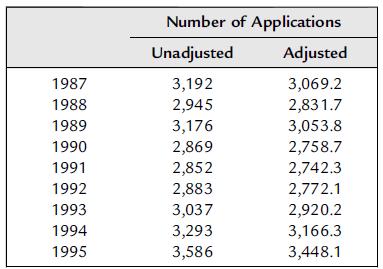
A researcher wants to see if U.S. News & World Report rankings influence the number of applications received by colleges and universities. He obtains the unadjusted data shown in Table 1.17 on applications to one small liberal arts college. To take into account the nationwide growth of college
When a child loses a baby tooth, an old U.S. tradition is for the tooth to be put under the child’s pillow, so that the tooth fairy will leave money for it. A survey by a Northwestern University professor [19] estimated that the tooth fairy paid an average of 12 cents for a tooth in 1900 and 1
The U.S. Social Security Administration estimated that someone 22 years old who earned $40,000 a year in 2008, works steadily for 45 years, and retires at age 67 in 2053, would begin receiving annual benefits of about $90,516 in 2054. This calculation assumes a 3.5 percent annual rate of inflation
The U.S. government reported that a total of 38.6 million pounds of toxic chemicals had been released into the air above New Jersey in 1982. A spokesman for the New Jersey Department of Environmental Protection boasted that “It speaks well of our enforcement,” since this was less chemicals than
The Dow Jones Industrial Average was 838.92 on December 31, 1970, and 11,577.51 on December 31, 2010. The Consumer Price Index was at 39.8 in December 1970 and 219.2 in December 2010 (using a base of 100 in 1982–1984). Did the Dow increase by more or less than consumer prices over this 40-year
During the 1922–1923 German hyperinflation, people reported receiving more money for returning their empty beer bottles than they had originally paid to buy full bottles.Could they have made a living buying beer, emptying the bottles, and returning them?
Between August 1945 and July 1946, the number of Hungarian pengos (the unit of Hungarian currency) in circulation increased by a factor of 12,000,000,000,000,000,000,000,000, while the price level increased by a factor of 4,000,000,000,000,000,000,000,000,000. Did the real value of the money supply
Critically evaluate this economic commentary:When it comes to measuring inflation, the average consumer can do a far better job than the economics experts…. Over the years I have been using a system which is infallible…. The Phindex [short for the Phillips index] merely requires you to divide
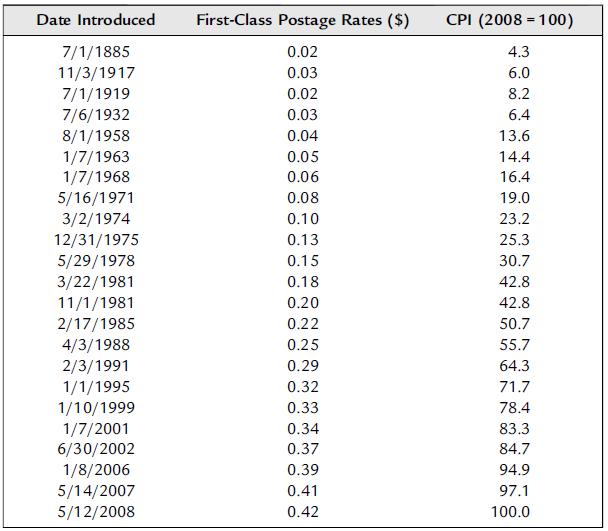
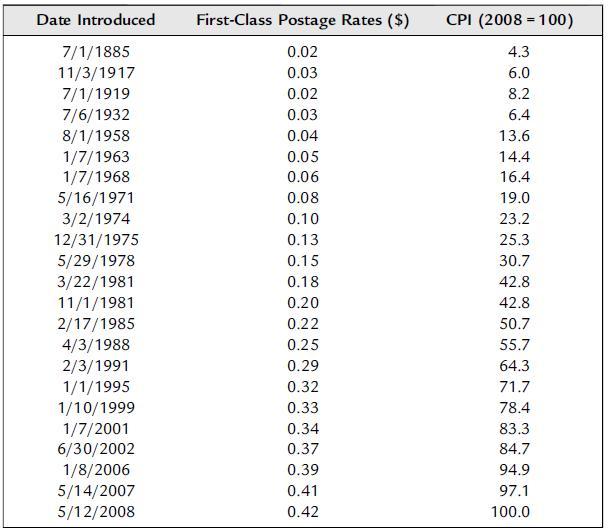
Use the data in Table 1.11 to determine the 1971 cost in 2008 dollars of mailing a first-class letter. Is this value higher or lower than the actual $0.42 cost of mailing a letter in 2008? Date Introduced First-Class Postage Rates ($) CPI (2008-100) 7/1/1885 11/3/1917 0.02 4.3 0.03 6.0 7/1/1919
Use the data in Table 1.11 to determine the 1991 cost in 2008 dollars of mailing a first-class letter. Is this value higher or lower than the actual $0.42 cost of mailing a letter in 2008? Date Introduced First-Class Postage Rates ($) CPI (2008-100) 7/1/1885 11/3/1917 0.02 4.3 0.03 6.0 7/1/1919
Use the data in Table 1.11 to determine the percentage increase in the CPI between 2007 and 2008. Date Introduced First-Class Postage Rates ($) CPI (2008-100) 7/1/1885 11/3/1917 0.02 4.3 0.03 6.0 7/1/1919 0.02 8.2 7/6/1932 0.03 6.4 8/1/1958 0.04 13.6 1/7/1963 0.05 14.4 1/7/1968 0.06 16.4 5/16/1971
Use the data in Table 1.11 to determine the percentage increase in the CPI between 1978 and 1981. (Do not calculate the annual rate of increase, just the overall percentage increase.) Date Introduced First-Class Postage Rates ($) CPI (2008-100) 7/1/1885 11/3/1917 0.02 4.3 0.03 6.0 7/1/1919 0.02 8.2
Table 1.11 shows the CPI with the index set equal to 100 in 2008. Suppose that we redo the CPI so that the index equals 100 in 1958; if so, what is the value of the CPI in 2008? What is the percentage increase in the CPI between 1958 and 2008 if we use the CPI with the index equal to 100 in 2008?
Table 1.11 shows the CPI with the index set equal to 100 in 2008. Suppose that we redo the CPI so that the index equals 100 in 1985; if so, what is the value of the CPI in 2008? What is the percentage increase in the CPI between 1985 and 2008 if we use the CPI with the index equal to 100 in 2008?
Instead of using the total population, we might deflate cigarette sales by the number of people over the age of 18, since a person must be at least 18 years old to buy cigarettes legally. There were 116 million people over the age of 18 in the United States in 1960 and 186 million in 1990. Use the
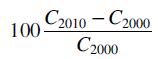
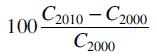
Mr. Bunker lives on beer and pretzels. In 2000, he bought 1,000 six-packs of beer for $2.00 per six-pack and 500 bags of pretzels for $1.00 per bag. In 2010, Bunker’s beer cost $3.00 per six-pack and his pretzels cost $2.00 per bag. One way to calculate Bunker’s rate of inflation iswhere C2010
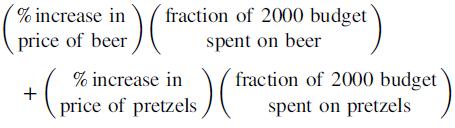
Another way to calculate Bunker’s rate of inflation isWhat is Bunker’s rate of inflation using this approach? % increase in price of beer c) (" fraction of 2000 budget % increase in + price of pretzels spent on beer fraction of 2000 budget Is) (" spent on pretzels
Ms. Vigor lives on carrot juice and tofu. In 2000, she bought 1,000 bottles of carrot juice for $2.00 per bottle and 400 pounds of tofu for $3.00 per pound. In 2010, Vigor’s carrot juice cost $2.50 per bottle and her tofu cost $5.00 per pound. One way to calculate Vigor’s rate of inflation
Because of the large increase in the price of tofu, Ms. Vigor changed her diet to 1,200 bottles of carrot juice and 250 pounds of tofu in 2010. Calculate Vigor’s rate of inflation using C2000 = cost of 1,200 bottles of carrot juice and 250 pounds of tofu in 2000 and C2010 = cost of 1,200 bottles
Explain the error in this interpretation of inflation data:In the 12-month period ending in December of 1980, consumer prices rose by 12.4 percent—after a 13.3 percent increase the year before. Similar measures of inflation over the next three years were 8.9 percent, 3.9 percent, and 3.8
Answer this letter to Ann Landers: I’ve read your column for ages and almost always agree with you. One subject on which we do not see eye-to-eye, however, is senior citizens driving. According to the Memphis Commercial Appeal, recent statistics by the National Highway Traffic Safety
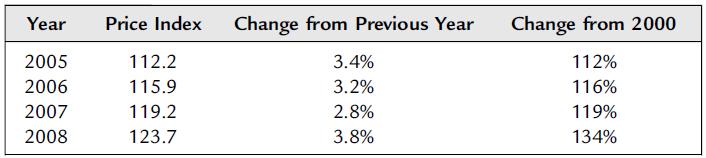
Identify the error in Table 3.10, showing consumer prices and the change in prices based on a price index equal to 100 in 2000.Table 3.10 Year Price Index Change from Previous Year Change from 2000 2005 112.2 3.4% 112% 2006 115.9 3.2% 116% 2007 119.2 2.8% 119% 2008 123.7 3.8% 134%
Redo the preceding exercise, this time using the mathematics scores.Preceding ExerciseUse the reading comprehension data in Exercise 6.18 to test the null hypothesis that the population mean of X is 0.a. What is the two-sided P value?b. Does the average value of X seem substantially different from
Explain why you either agree or disagree with this interpretation of the results from estimating a regression model: “This study concludes that the data are statistically substantial because there are more than 5 degrees of freedom, and statistically significant because the P value is not below
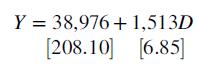
A study of 16,405 adult daughters of women who immigrated to California from other countries measured the economic status of the daughters by the median household income Y for the ZIP code they lived in [12]. A least squares regression used a variable D that equals 1 if the daughter was her
The study described in the preceding exercise also looked at 11,794 first-born daughters at the time they gave birth to their first child. A least squares regression was used to examine the relationship between income Y and the daughter’s age A (in years) at the time she gave birth:The t values
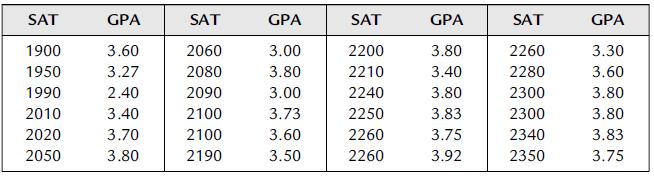
Table 9.7 shows the SAT scores (600–2400) and college GPAs (four-point scale) for 24 second-year college students at a highly selective college. Use a simple regression model to estimate the relationship between these variables. Explain your answers to these questions:a. Which variable did you
The Boston Snow (B.S.) indicator uses the presence or absence of snow in Boston on Christmas Eve to predict the stock market the following year: “the average gain following snow on the ground was about 80 percent greater than for years in which there was no snow” [13]. How would you explain the
Explain the following observation, including the use of the word sadly: “There have always been a considerable number of pathetic people who busy themselves examining the last thousand numbers which have appeared on a roulette wheel, in search of some repeating pattern. Sadly enough, they have
Two psychologists found a strong positive correlation between family tension and the number of hours spent watching television [15]. Give a logical explanation other than television shows increase family tension.
Give a logical statistical explanation for the Cy Young jinx: Of 71 winners of the Cy Young Award [for the best pitcher] since it was instituted in 1956, only three followed with better years and 30 had comparable years. But in 37 cases,…the next season was worse [16].
Sir Francis Galton planted seeds with seven different diameters (in hundredths of an inch) and computed the average diameter of 100 seeds of their offspring [17]:After deciding which is the dependent variable, use least squares to estimate the regression equation Y = α + βX + ε. Is there a
Use the data in Exercise 9.9 to estimate the equation Parent = α1 + β1Offspring + ε1 and to estimate the equation Offspring = α2 + β2Parent + ε2 by ordinary least squares. Let b1 be your estimate of β1 and b2 be your estimate of β2.a. Does b1 = 1/b2?b. If both equations are estimated by
Data were collected for 25 new cars on the cars’ weights (X) and estimated highway miles per gallon (Y). The model Y = α + βX + ε was estimated by least squares in three ways: the data were arranged alphabetically by car name, the data were arranged numerically from the lightest car to the
A California college student wanted to see if there is a relationship between the weather and the color of clothes students wear. He collected data for 13 days in April on these two variables:X: Weather, ranging from 1 (precipitation) to 6 (bright sunny day).Y: Clothing brightness, ranging from 1
Suppose that you meet a 25-year-old man who is 6 feet, 2 inches tall and he tells you that he has two brothers, one 23 years old and the other 27 years old. If you had to guess whether he is the shortest, tallest, or in-between of these three brothers, which would you select? Explain your reasoning.
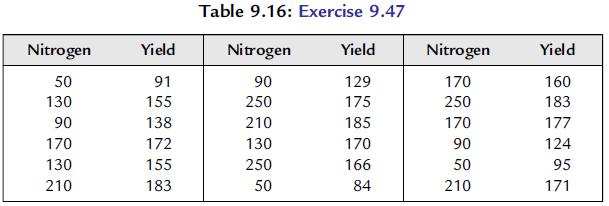
A study used the data in Table 9.8 to investigate the effect of driving speed on traffic fatalities:where Y = deaths per million miles driven and X = average speed, miles per hour.a. The researcher argued that “supporters of lower speed limits would expect β to be close to 1, reflecting a
The model Y = α + βX + ε was estimated using annual data for 1991 through 2000. If X = 100 and Y = 100 in 1991 and X = 200 and Y = 200 in 2000, can the least squares estimate of β be negative? Explain your reasoning.
A statistician recommended a strategy for betting on professional football games based on the logic of regression to the mean [18]. Do you think that he recommended betting for or against teams that had been doing poorly? Explain clearly and concretely how the logic of regression to the mean
Professional baseball players who are batting 0.400 at the halfway point in the season almost always find that their batting average declines during the second half of the season. This slump has been blamed on fatigue, pressure, and too much media attention. Provide a purely statistical
Howard Wainer, a statistician with the Educational Testing Service, recounted the following [19]: My phone rang just before Thanksgiving. On the other end was Leona Thurstone; she is involved in program evaluation and planning for the Akebono School (a private school) in Honolulu. Ms. Thurstone
Studies have found that people who have taken driver training courses tend to have more traffic accidents than people who have not taken such courses. How might you dispute the implication that driver training courses make people worse drivers?
A petition urging students to take Latin classes noted that, “Latin students score 150 points higher on the verbal section of the SAT than their non-Latin peers.” How might a skeptic challenge this argument?
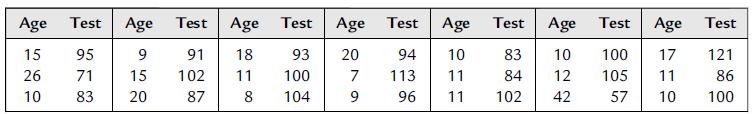
Table 9.10 shows data on the age (in months) at which 21 children said their first word and their score on a later test of mental aptitude [21]. Use a regression equation to see if there is a statistical relationship.a. Which variable did you use as the dependent variable? Explain your reasoning.b.
A researcher wanted to investigate the theory that better baseball players tend to come from warmer climates, where they can play baseball 12 months of the year. He gathered data for 16 MLB teams on the number of players who were from warm climates (the Dominican Republic, Mexico, Puerto Rico, and
A regression [22] of cricket chirps per minute (Y) for one cricket species on temperature in degrees Fahrenheit (X) gave this estimated equation: Y = −0.309 + 0.212X. Which is the dependent and which the independent variable? What is the predicted value of Y when X = 0?When X = 300? Do these
A researcher obtained the combined math and reading SAT scores (X) (scale 400–1600) and GPAs (Y) of 396 college students and reported these regression results:[ ]: t valuesa. There is an error in these results. What is it?b. The researcher said “Therefore I reject the null hypothesis and
A 1957 Sports Illustrated cover had a picture of the Oklahoma football team, which had not lost in 47 games, with the caption “Why Oklahoma Is Unbeatable.” The Saturday after this issue appeared, Oklahoma lost to Notre Dame 7–0, starting the legend of the Sports Illustrated cover jinx—that
A random sample of 30 second-semester college sophomores was asked to report their GPA (on a four-point scale) and the average number of hours per week spent on organized extracurricular activities, such as work, sports teams, clubs, committee meetings, and volunteer activities. These data were
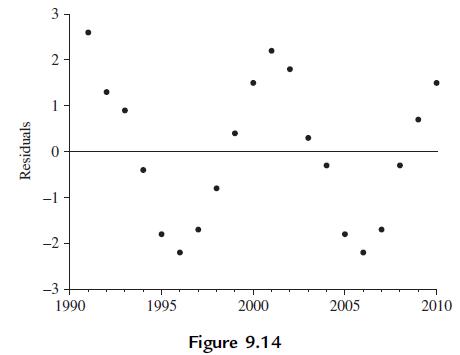
What pattern do you see in Figure 9.14, a plot of the residuals from a least squares regression? Residuals 3 2 1 T -2 -3 1990 1995 2000 2005 2010 Figure 9.14
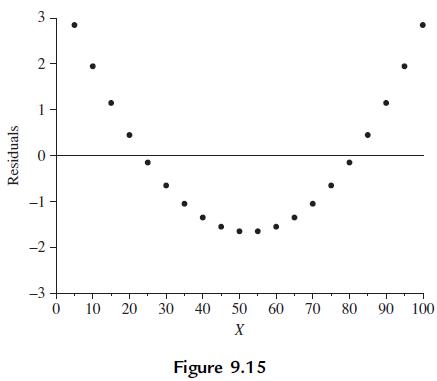
What pattern do you see in Figure 9.15, a plot of the residuals from a least squares regression? What do you think might have caused this pattern? Residuals 2 1 -2- -3- 0 10 20 30 40 50 60 70 80 90 100 X Figure 9.15
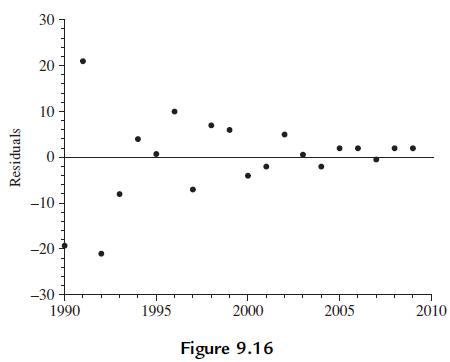
Based on the Figure 9.16 plot of least squares residuals, what assumption about the regression model’s error term seems to be violated? 30 Residuals 20 20 10 10 0 -10 -20 -30 1990 1995 2000 2005 2010 Figure 9.16
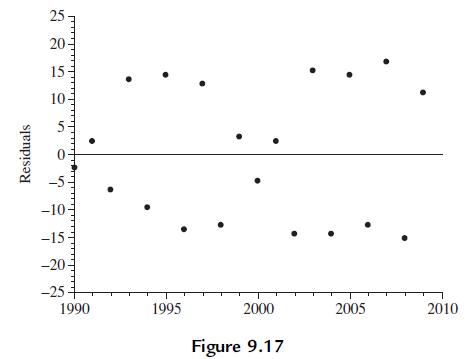
Based on the Figure 9.17 plot of least squares residuals, what assumption about the regression model’s error term seems to be violated? Residuals 25 20 15 10 S 0 -10 -15 -20 -25- 1990 1995 2000 2005 2010 Figure 9.17
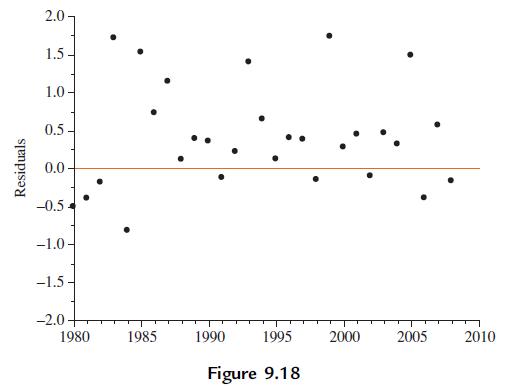
What is puzzling about Figure 9.18, a plot of the residuals from a least squares regression? Residuals 2.0 1.5- 1.0- 0.5- 0.0- 00 -0.5 -1.0- -1.5- -2.0- 1980 1985 1990 1995 2000 2005 2010 Figure 9.18
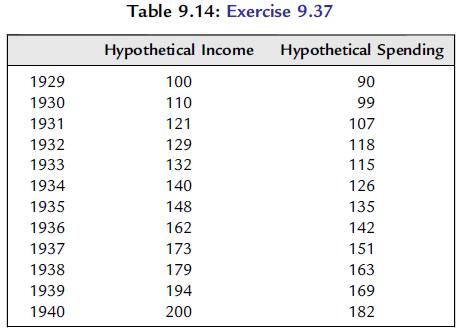
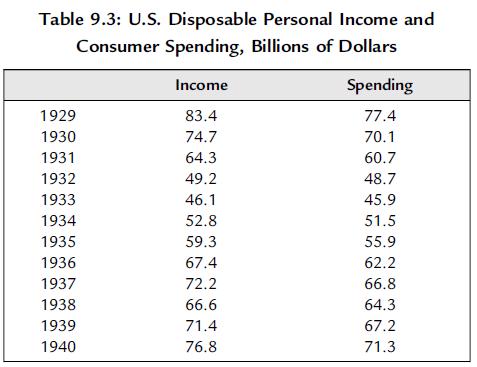
Consider the hypothetical income and spending data in Table 9.14.a. Identify any important differences in the patterns in these data compared to the data in Table 9.3.b. Estimate the simple regression model with spending as the dependent variable and income as the explanatory variable.c. Calculate
Use the data in Exercise 9.37 to answer these questions:a. Estimate the simple regression model with spending as the dependent variable and income as the explanatory variable.b. Estimate the equation Y = α + βX + ε, where Y is income and X is the year. Use your estimates to calculate the
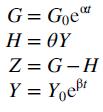
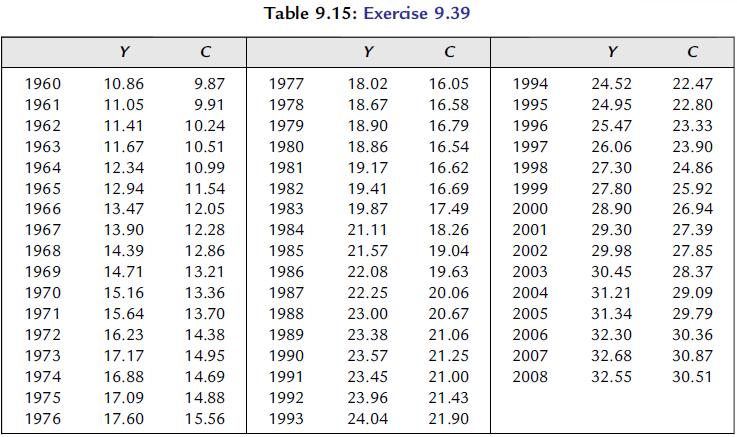
Table 9.15 shows U.S. data for C = real per capita consumption and Y = real per capita disposable personal income.a. Draw a scatter diagram.b. Estimate the consumption function C = α + βY + ε.c. Calculate the residuals e = C − (a + bY) for each year and make a scatter diagram with e on the
Use the data in the Exercise 9.39 to calculate the annual change in income and consumption, for example, in 1961 Y − Y−1 = 11.05 − 10.86 = 0.19.a. Draw a scatter diagram using these annual changes.b. Estimate the consumption function (C −C−1) = α+β(Y −Y−1)+ε.c. Calculate the
Use the data in Exercise 9.39 to calculate the annual percentage change in income and consumption, for example, in 1961a. Draw a scatter diagram using these annual percentage changes.b. Estimate the consumption function (%C) = α+β(%Y)+ε.Exercise 9.37Consider the hypothetical income and spending
Explain why you either agree or disagree with this reasoning: “You can always identify an outlier in a regression model by looking at the residuals because an outlier has a large residual.” Draw a scatterplot to illustrate your argument.
A stock portfolio consisting of the 10 companies identified by Fortune magazine each year as America’s most admired companies was compared to the overall U.S. stock market [24]. A least squares regression was used to analyze the relationship between the risk-adjusted daily percentage return on
Two portfolios were followed: one portfolio consisting of stocks that were deleted from the Dow Jones Industrial Average, the other portfolio consisting of stocks that replaced them [25]. Whenever a Dow substitution was made, the deleted stock was added to the deletion portfolio and the replacement
Answer this question that was given to graduate students in psychology, which described the professor’s experience when he advised the Israeli air force:The instructors in a flight school adopted a policy of consistent positive reinforcement recommended by psychologists. They verbally reinforced
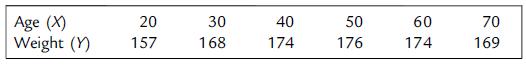
Use these data on the average weight in pounds of U.S. men who are 68 inches tall to estimate the equation Y = α + βX + ε. Plot the residuals and identify a pattern. Age (X) 20 30 40 50 60 70 Weight (Y) 157 168 174 176 174 169
In educational testing, a student’s ability is defined as this student’s average score on a large number of tests that are similar with respect to subject matter and difficulty.A student’s score on a particular test is equally likely to be above or below the student’s ability. Suppose a
The manager of a fleet of identical trucks used monthly data to estimate this model:where Y is gallons of fuel consumed (average value 71,000); X1 is miles traveled (average value 80,000); and X2 is average speed (average value 55 miles per hour).a. In plain English, interpret the 0.20 coefficient
Data collected by a county agricultural agency were used to estimate this model:where Y is corn yield (bushels per acre, average value 90); X1 is fertilizer (pounds per acre, average value 100); and X2 is rainfall (inches, average value 30).a. In plain English, interpret the value 0.10.b. In plain
Showing 600 - 700
of 1157
1
2
3
4
5
6
7
8
9
10
11
12
Step by Step Answers