New Semester
Started
Get
50% OFF
Study Help!
--h --m --s
Claim Now
Question Answers
Textbooks
Find textbooks, questions and answers
Oops, something went wrong!
Change your search query and then try again
S
Books
FREE
Study Help
Expert Questions
Accounting
General Management
Mathematics
Finance
Organizational Behaviour
Law
Physics
Operating System
Management Leadership
Sociology
Programming
Marketing
Database
Computer Network
Economics
Textbooks Solutions
Accounting
Managerial Accounting
Management Leadership
Cost Accounting
Statistics
Business Law
Corporate Finance
Finance
Economics
Auditing
Tutors
Online Tutors
Find a Tutor
Hire a Tutor
Become a Tutor
AI Tutor
AI Study Planner
NEW
Sell Books
Search
Search
Sign In
Register
study help
business
hotel operations management
Operations Management 14th Edition William J Stevenson - Solutions
Make a check sheet and then a Pareto diagram for the following car repair shop data.Ticket No. Work Ticket No. Work Ticket No. Work 1 Tires 11 Brakes 21 Lube & oil 2 Lube & oil 12 Lube & oil 22 Brakes 3 Tires 13 Battery 23 Transmission 4 Battery 14 Lube & oil 24 Brakes 5 Lube & oil 15 Lube & oil 25
An air-conditioning repair department manager has compiled data on the primary reason for 41 service calls for the previous week, as shown in the table. Using the data, make a check sheet for the problem types for each customer type, and then construct a Pareto diagram for each type of customer.Job
Prepare a run chart similar to Figure 9.11 for the occurrences of defective computer monitors based on the following data, which an analyst obtained from the process for making the monitors. Workers are given a 15-minute break at 10:15 a.m. and 3:15 p.m., and a lunch break at noon. What can you
Prepare a run diagram for this emergency call data. Use five-minute intervals (i.e., count the calls received in each five-minute interval. Use intervals of 0 to 4, 5 to 9, etc.). Note: Two or more calls may occur in the same minute; there were three operators on duty this night. What can you
Suppose that a table lamp fails to light when turned on. Prepare a simple cause-and-effect diagram to analyze possible causes. LO.1
Prepare a cause-and-effect diagram to analyze the possible causes of late delivery of parts ordered from a supplier. LO.1
Prepare a cause-and-effect diagram to analyze why a machine has produced a large run of defective parts. LO.1
Prepare a scatter diagram for each of these data sets and then express in words the apparent relationship between the two variables. Put the first variable on the horizontal axis and the second variable on the vertical axis.a.Age 24 30 22 25 33 27 36 58 37 47 54 28 42 55 Absenteeism rate 6 5 7 6 4
Explain the need for quality control. LO.1
Discuss the basic issues of inspection. LO.1
List and briefly explain the elements of the control process. LO.1
Explain how control charts are used to monitor a process and the concepts that underlie their use. LO.1
Use and interpret control charts. LO.1
Perform run tests to check for nonrandomness in process output. LO.1
Assess process capability. LO.1
What steps could a company take to reduce the probability of false inspection reports? LO.1
Although apparently no issues occurred with the parts that were shipped to SpaceX, if there had been failures, how “catastrophic” might the outcomes have been? LO.1
Why are RFID chips being used in hospitals? LO.1
Where else in a hospital would these patient RFID tags be useful? LO.1
List the steps in the control process. LO.1
What are the key concepts that underlie the construction and interpretation of control charts? LO.1
What is the purpose of a control chart? LO.1
Why is order of observation important in process control? LO.1
Briefly explain the purpose of each of the following control charts.a. x-barb. Rangec. p-chartd. c-chart LO.1
What is a run? How are run charts useful in process control? LO.1
If all observations are within control limits, does that guarantee that the process is random? Explain. LO.1
Why is it usually desirable to use both a median run test and an up/down run test on the same data? LO.1
If both run tests are used, and neither reveals nonrandomness, does that prove that the process is random? Explain. LO.1
Define and contrast control limits, specifications, and process variability. LO.1
A customer has recently tightened the specs for a part your company supplies. The specs are now much tighter than the machine being used for the job is capable of. Briefly identify alternatives you might consider to resolve this problem. (See Figure 10.15C.) LO.1
A new order has come into your department. The capability of the process used for this type of work will enable virtually all of the output to be well within the specs. (See Figure 10.15B.)a. What benefits might be derived from this situation?b. What alternatives might be considered by the
What two basic assumptions must be satisfied in order to use a process capability index? LO.1
How important is it for managers to maintain and promote ethical behavior in dealing with quality issues? Does your answer depend on the product or service involved? LO.1
What trade-offs are involved in each of these decisions?a. Deciding whether to use two-sigma or three-sigma control limits.b. Choosing between a large sample size and a smaller sample size.c. Trying to increase the capability of a process that is barely capable. LO.1
Who needs to be involved in setting quality standards? LO.1
Name several ways that technology has had an impact on quality control. LO.1
Give two examples of unethical behavior for each of these areas: inspection, process control, process capability. For each, name the relevant ethical principle (see Chapter 1). LO.1
In repetitive operations, it is often possible to automatically check for quality and then reject parts that are unacceptable. In these situations, does that mean control charts aren’t needed? Explain. LO.1
Specifications for a part for a 3-D printer state that the part should weigh between 24 and 25 ounces. The process that produces the parts has a mean of 24.5 ounces and a standard deviation of .2 ounce. The distribution of output is normal.a. What percentage of parts will not meet the weight
An automatic filling machine is used to fill 1-liter bottles of cola. The machine’s output is approximately normal with a mean of 1.0 liter and a standard deviation of .01 liter. Output is monitored using means of samples of 25 observations.a. Determine upper and lower control limits that will
The time in minutes to replace vehicle wiper blades at a service center was monitored using a mean and a range chart. Six samples of n = 20 observations were obtained and the sample means and ranges were computed:Sample Mean Range Sample Mean Range 1 3.06 .42 4 3.13 .46 2 3.15 .50 5 3.06 .46 3 3.11
Software upgrade times (in minutes) are being evaluated. Samples of five observations each have been taken, and the results are as listed. Using factors from Table 10.3, determine upper and lower control limits for mean and range charts, and decide if the process is in control.SAMPLE 1 2 3 4 5 6
Using samples of 200 credit card statements, an auditor found the following:Sample 1 2 3 4 Number with errors 4 2 5 9a. Determine the fraction defective in each sample.b. If the true fraction defective for this process is unknown, what is your estimate of it?c. What is your estimate of the mean and
A medical facility does MRIs for sports injuries. Occasionally, a test yields inconclusive results and must be repeated. Using the following sample data and n = 200, determine the upper and lower control limits for the fraction of retests using two-sigma limits. Is the process in control?SAMPLE 1 2
The postmaster of a small western town receives a certain number of complaints each day about mail delivery. Determine three-sigma control limits using the following data. Is the process in control?DAY 1 2 3 4 5 6 7 8 9 10 11 12 13 14 Number of complaints 4 10 14 8 9 6 5 12 13 7 6 4 2 10 LO.1
Given the following data for the number of defects per spool of cable, using three-sigma limits, is the process in control?OBSERVATION 1 2 3 4 5 6 7 8 9 10 11 12 13 14 Number of defects 2 3 1 0 1 3 2 0 2 1 3 1 2 0 LO.1
After a number of complaints about its tech assistance, a computer manufacturer examined samples of calls to determine the frequency of wrong advice given to callers. Each sample consisted of 100 calls. Determine 95 percent limits. Is the tech assistance process stable (i.e., in control)?
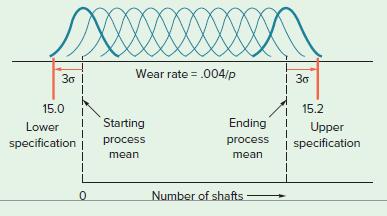
Specifications for a metal shaft are much wider than the machine used to make shafts is capable of.Consequently, the decision has been made to allow the cutting tool to wear a certain amount before replacement. The tool wears at the rate of .004 centimeter per piece. The process has a natural
The lower and upper specifications for the software upgrades in Problem 4 are 78 minutes and 81 minutes. Estimate the percentage of process output that can be expected to fall within the specifications. As a manager, would you feel that the specifications are being met? LO.1
The time needed for checking in at a motel is to be investigated. Historically, the process has had a standard deviation equal to .146. The means of 39 samples of n = 14 are shown in the following table.Sample Mean Sample Mean Sample Mean Sample Mean 1 3.86 11 3.88 21 3.84 31 3.88 2 3.90 12 3.86 22
Analyze the data in the following problems using median and up/down run tests with z = ±2.a. Given the following run test results of process output, what do the results of the run tests suggest about the process?Test z-score Median +1.37 Up/Down +1.05b. Twenty means were plotted on a control
Use both types of run tests to analyze the daily expense voucher listed. Assume a median of $31.Day Amount Day Amount Day Amount Day Amount 1 $27.69 16 $29.65 31 $40.54 46 $25.16 2 28.13 17 31.08 32 36.31 47 26.11 3 33.02 18 33.03 33 27.14 48 29.84 4 30.31 19 29.10 34 30.38 49 31.75 5 31.59 20
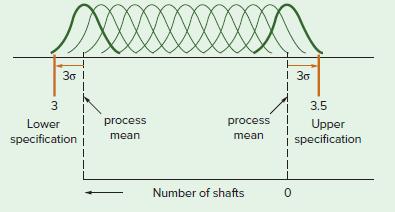
A company has just negotiated a contract to produce a part for another firm. In the process of manufacturing the part, the inside diameter of successive parts becomes smaller and smaller as the cutting tool wears. However, the specs are so wide relative to machine capabilities that it is possible
(Refer to Solved Problem 2.) Suppose the process specifications are 9.65 and 10.35 minutes.Based on the data given, does it appear that the specifications are being met? If not, what should one look for? LO.1
A teller at a drive-up window at a bank had the following service times (in minutes) for 20 randomly selected customers.SAMPLE 1 2 3 4 4.5 4.6 4.5 4.7 4.2 4.5 4.6 4.6 4.2 4.4 4.4 4.8 4.3 4.7 4.4 4.5 4.3 4.3 4.6 4.9a. Determine the mean of each sample.b. If the process parameters are unknown,
Given the following list of processes, the standard deviation and job specification for a set of jobs, determine which processes are capable of performing the given jobs.Process Standard Deviation (in.) Job Specification ( ± in.)001 .02 .05 002 .04 .07 003 .10 .18 004 .05 .15 005 .01 .04 LO.1
Suppose your manager presents you with the following information about machines that could be used for a job, and wants your recommendation on which one to choose. The specification width is .48 mm. In this instance, you can narrow the set of choices, but you probably wouldn’t make a
Each of the processes listed is non-centered with respect to the specifications for that process.Compute the appropriate capability index for each, and decide if the process is capable.Process Mean Standard Deviation Lower Spec Upper Spec H 15.0 0.32 14.1 16.0 K 33.0 1.00 30.0 36.5 T 18.5 0.40 16.5
As part of an insurance company’s training program, participants learn how to conduct an analysis of clients’ insurability. The goal is to have participants achieve a time in the range of 30 to 45 minutes. Test results for three participants were the following: Armand, a mean of 38 minutes and
The Healthy Chocolate Company makes a variety of chocolate candies, including a 12-ounce chocolate bar (340 grams) and a box of six 1-ounce chocolate bars (170 grams).a. Specifications for the 12-ounce bar are 330 grams to 350 grams. What is the largest standard deviation (in grams) that the
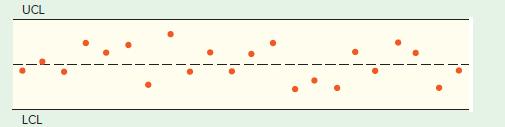
The following is a control chart for the average number of minor errors in 22 service reports.What can you conclude from these data? Explain how you reached your conclusion. LO.1 UCL LCL
Use the three-step process described in the section on Using Control Charts and Runs Tests Together to decide if the following observations represent a process that is in control.Observation 1 2 3 4 5 6 7 8 9 10 11 12 No. of errors 1 0 3 2 0 1 3 2 1 0 2 3 LO.1
How did Jim conclude that the process was not capable based on his first set of samples? (Hint: Estimate the process standard deviation, σ, using A 2 R¯ ≈ 3 _σ_ √__ n .) LO.1
Does the second set of samples show anything that the first set did not? Explain what and why. LO.1
Assuming the problem can be found and corrected, what impact do you think this would have on the capability of the process? Compute the potential process capability using the second data set. LO.1
If small samples can reveal something that large samples might not, why not just take small samples in every situation? LO.1
Identify some of the main reasons organizations need to make location decisions. LO.1
Explain why location decisions are important. LO.1
Discuss the options available for location decisions. LO.1
Discuss key considerations related to global location decisions. LO.1
Outline the decision process for making location decisions. LO.1
Describe some of the key factors that guide service and retail location decisions. LO.1
Use the techniques presented to evaluate location alternatives. LO.1
Will Starbucks be able to successfully battle competition at home and abroad as it continues its march for global growth? LO.1
What are some key differences among the various countries that Starbucks serves, and how can it capitalize on these for future success? LO.1
What advantages might Starbucks have over local coffee businesses in global markets? In what way is it at a disadvantage to existing coffee houses in other countries? LO.1
In what ways can the location decision have an impact on the production system? LO.1
What community factors influence location decisions? LO.1
How are manufacturing and nonmanufacturing location decisions similar? Different? LO.1
What are the potential benefits of locating in foreign countries? Potential drawbacks? LO.1
What is factor rating, and how does it work? LO.1
Outline the general approach for developing location alternatives. LO.1
What are the basic assumptions in locational cost-profit-volume analysis? LO.1
Discuss recent trends in location and possible future strategies. LO.1
What trade-offs are involved in deciding to have a single large, centrally located facility instead of several smaller, dispersed facilities? LO.1
Who needs to be involved in facility location decisions? LO.1
Name several ways that technology has had an impact on location decisions. LO.1
The owner of a fast-food franchise has exclusive rights to operate in a medium-sized metropolitan area. Currently, the owner has one outlet open, which has proved very popular, often with lines of waiting customers. Thus, the owner is considering opening additional outlets in the area. What key
Corruption and bribery are common in some countries. Would you avoid locating in such a country, or locate there and deal with it? If the latter, how would you deal with it? LO.1
Give three examples of unethical behavior involving location selection, and indicate which ethical principle is violated (see Chapter 1). LO.1
A newly formed firm must decide on a plant location. There are two alternatives under consideration:locate near the major raw materials or locate near the major customers. Locating near the raw materials will result in lower fixed and variable costs compared to locating near the market, but the
A company that produces pleasure boats has decided to expand one of its lines. Current facilities are insufficient to handle the increased workload, so the company is considering three alternatives, A (new location), B (subcontract), and C (expand existing facilities). LO.1
Alternative A would involve substantial fixed costs but relatively low variable costs: fixed costs would be $250,000 per year, and variable costs would be $500 per boat. Subcontracting would involve a cost per boat of $2,500, and expansion would require an annual fixed cost of $50,000 and a
Two locations are being considered, one in the center of the city and one on the outskirts. The central city location would involve fixed monthly costs of $7,000 and labor, materials, and transportation costs of $30 per car. The outside location would have fixed monthly costs of $4,700 and labor,
For each of the four types of organizations shown, rate the importance of each factor in terms of making location decisions using L = low importance, M = moderate importance, and H = high importance.Factor Local Bank Steel Mill Food Warehouse Public School Convenience for customers Attractiveness
Using the following factor ratings, determine which location alternative (A, B, or C) should be chosen on the basis of the maximum composite score.Location Score Factor (100 points each) Weight A B C Convenience .15 80 70 60 Parking facilities .20 72 76 92 Display area .18 88 90 90 Shopper traffic
Determine which location has the highest composite score:Factor Weight East #1 East #2 West Initial cost 8 100 150 140 Traffic 10 40 40 30 Maintenance 6 20 25 18 Dock space 6 25 10 12 Neighborhood 4 12 8 15 LO.1
A manager received an analysis of several cities being considered for a new office complex.The data (10 points maximum) are as follows:Location Score Factor A B C Business services 9 5 5 Community services 7 6 7 Real estate costs 3 8 7 Construction costs 5 6 5 Cost of living 4 7 8 Taxes 5 5 4
A clothing manufacturer produces women’s clothes at four locations in Mexico. Relative locations have been determined, as shown in the table below. The location of a central shipping point for bolts of cloth must now be determined. Weekly quantities to be shipped to each location are also shown
A company that handles hazardous waste wants to minimize the shipping cost for shipments to a disposal center from five receiving stations it operates. Given the locations of the receiving stations and the volumes to be shipped daily, determine the location of the disposal center.Location of
Showing 5500 - 5600
of 6090
First
47
48
49
50
51
52
53
54
55
56
57
58
59
60
61
Step by Step Answers