New Semester
Started
Get
50% OFF
Study Help!
--h --m --s
Claim Now
Question Answers
Textbooks
Find textbooks, questions and answers
Oops, something went wrong!
Change your search query and then try again
S
Books
FREE
Study Help
Expert Questions
Accounting
General Management
Mathematics
Finance
Organizational Behaviour
Law
Physics
Operating System
Management Leadership
Sociology
Programming
Marketing
Database
Computer Network
Economics
Textbooks Solutions
Accounting
Managerial Accounting
Management Leadership
Cost Accounting
Statistics
Business Law
Corporate Finance
Finance
Economics
Auditing
Tutors
Online Tutors
Find a Tutor
Hire a Tutor
Become a Tutor
AI Tutor
AI Study Planner
NEW
Sell Books
Search
Search
Sign In
Register
study help
business
inferential statistics
Intro Stats 6th Edition Richard D. De Veaux, Paul F. Velleman, David Bock - Solutions
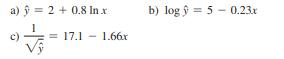
Models Find the predicted value of y, using each model for x = 10 a) 2+0.8 In.x = 17.1 1.66x b) log 5 0.23x
Williams football 2020 The Sears Cup was established in 1993 to honor institutions that maintain a broad-based athletic program, achieving success in many sports, both men’s and women’s. In the years following its Division III inception in 1995, the cup has been won by Williams College 22 of 24
Tobacco and alcohol Are people who use tobacco products more likely to consume alcohol? Here are data on household spending (in pounds) taken by the British government on 11 regions in Great Britain. Do tobacco and alcohol spending appear to be related? What questions do you have about these data?
Gasoline Since clean-air regulations have dictated the use of unleaded gasoline, the supply of leaded gas in New York State has diminished. The following table was given on the August 2001 New York State Math B exam, a statewide achievement test for high school students
Lunchtime Does how long toddlers sit at the lunch table help predict how much they eat? The table and graph show the number of minutes the kids stayed at the table and the number of calories they consumed. Create and interpret a model for these data.
Twins Twins are often born at less than 9 months gestation.The graph from the Journal of the American Medical Association (JAMA) shows the rate of preterm twin births in the United States over the past 20 years. In this study, JAMA categorized mothers by the level of prenatal medical care they
French Consider the association between a student’s score on a French vocabulary test and the weight of the student.What direction and strength of correlation would you expect in each of the following situations? Explain.a) The students are all in third grade.b) The students are in third through
Modeling jumps 2016 Here are the summary statistics for the Olympic jumps displayed in the previous exercise.T Event Mean StdDev High Jump 2.15667 0.195271 Long Jump 8.06222 0.507606 Correlation = 0.90992a) Write the equation of the line of regression for estimating High Jump from Long Jump.b)
Olympic jumps 2016 How are Olympic performances in various events related? The plot shows winning long-jump and high-jump distances, in meters, for the Summer Olympics from 1912 through 2016:
Depression The September 1998 issue of the American Psychologist published an article by Kraut et al. that reported on an experiment examining “the social and psychological impact of the Internet on 169 people in 73 households during their first 1 to 2 years online.” In the experiment, 73
Winter in the city Summary statistics for the data relating the Latitude and average January Temperature for 55 largea) What percent of the variation in January Temperature can be explained by variation in Latitude?b) What is indicated by the fact that the correlation is negative?c) Write the
Correlations The study of U.S. cities in Exercise R2.29 found the mean January Temperature (degrees Fahrenheit), Altitude (feet above sea level), and Latitude (degrees north of the equator) for 55 cities. Here’s the correlation matrix:a) Which seems to be more useful in predicting January
U.S. cities Data from 50 large U.S. cities show the mean January Temperature and the Latitude. Describe what you see in the scatterplot.
Tips It’s commonly believed that people use tips to reward good service. A researcher for the hospitality industry examined tips and ratings of service quality from 2645 dining parties at 21 different restaurants. The correlation between ratings of service and tip percentages was 0.11. (M. Lynn
Pay gap The Bureau of Labor Statistics (BLS) reports median weekly earnings for men and women on a quarterly basis. The following plot depicts how these earnings have changed over time between Q1 2000 and Q1 of 2020. The x-axis displays the quarters indexed such that Q1 2000 takes the index 1, Q2
Social support and happiness The World Happiness Report is an annual report published by the United Nations that studies the happiness levels of individuals per country along with other measures of well-being. For each of 153 countries, the 2020 report provides a happiness score, computed as the
Big screen An electronics website collects data on the size of new HD flat panel televisions (measuring the diagonal of the screen in inches) to predict the cost (in hundreds of dollars). Which of these is most likely to be the slope of the regression line: 0.03, 0.3, 3, 30? Explain.
Improving trees In the last exercise, you saw that the linear model had some deficiencies. Let’s create a better model.a) Perhaps the cross-sectional area of a tree would be a better predictor of its age. Since area is measured in square units, try re-expressing the data by squaring the
How old is that tree? One can determine how old a tree is by counting its rings, but that requires either cutting the tree down or extracting a sample from the tree’s core. Can we estimate the tree’s age simply from its diameter? A forester measured 27 trees of the same species that had been
Crocodile lengths The ranges inhabited by the Indian gharial crocodile and the Australian saltwater crocodile overlap in Bangladesh. Suppose a very large crocodile skeleton is found there, and we wish to determine the species of the animal.Wildlife scientists have measured the lengths of the
Old Faithful again There is evidence that eruptions of Old Faithful can best be predicted by knowing the duration of the previous eruption.a) Describe what you see in the scatterplot of Intervals between eruptions vs. Duration of the previous eruption.
Colorblind Although some women are colorblind, this condition is found primarily in men. Why is it wrong to say there’s a strong correlation between Sex and Colorblindness?
Cars, more efficient? Here is a scatterplot of the residuals from the regression in Exercise R2.18:a) Does the residual plot suggest that the regression conditions were satisfied? Explain.In the United States, fuel efficiency is usually measured as we did here, in miles per gallon. But in the rest
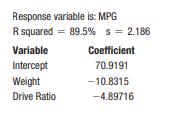
Cars, fuel efficiency Consider a regression to predict the fuel efficiency (as miles per gallon, MPG) of the cars in the Cars data file. Here is one regression model using the Weight and the Drive Ratio:a) What is the interpretation of the coefficient of Weight in this model?b) Do you think this is
Cars, horsepower Can we predict the Horsepower of the engine that manufacturers will put in a car by knowing the Weight of the car? Here are the regression analysis and residuals plot:
Cars, associations Look again at the correlation table for cars in the previous exercise.a) Which two variables in the table exhibit the strongest association?b) Is that strong association necessarily cause-and-effect?Offer at least two explanations why that association might be so strong.c) Engine
Cars, correlations What factor most explains differences in Fuel Efficiency among cars? Below is a correlation matrix exploring that relationship for the car’s Weight (1000 lb), Horsepower, Displacement, and number of Cylinders.(Data in Cars)a) Which factor seems most strongly associated with
Cramming One Thursday, researchers gave students enrolled in a section of basic Spanish a set of 50 new vocabulary words to memorize. On Friday, the students took a vocabulary test. When they returned to class the following Monday, they were retested—without advance warning.Here are the test
Traffic Highway planners investigated the relationship between traffic Density (number of automobiles per mile)and the average Speed of the traffic on a moderately large city thoroughfare. The data were collected at the same location at 10 different times over a span of 3 months. They found a mean
Final exam A statistics instructor created a linear regression equation to predict students’ final exam scores from their midterm exam scores. The regression equation was Fin = 10 + 0.9 Mid.a) If Susan scored a 70 on the midterm, what did the instructor predict for her score on the final?b) Susan
Streams III Exercise R2.9 fit a regression model to the relationship between BCI and pH in streams sampled in the Adirondack Mountains. More variables are available. For example, scientists also recorded the water hardness. Here’s a new model:
A manatee model 2017 Continue your analysis of the manatee situation from Exercise R2.8.a) Create a linear model of the association between Manatee Deaths and Powerboat Registrations.b) Interpret the slope of your model.c) Interpret the y-intercept of your model.d) Which is better for the manatees,
Streams II Exercise R2.7 examined the correlation between BCI and pH in streams sampled in the Adirondack Mountains. Here is the corresponding regression model:T Response variable is: BCI R squared = 27.1% s = 140.4 Variable Coefficient Intercept 2733.37 pH -197.694a) Write the regression model.b)
Manatees 2017 Marine biologists warn that the growing number of powerboats registered in Florida threatens the existence of manatees. The data in the table come from the Florida Fish and Wildlife Conservation Commission
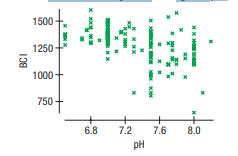
Streams Biologists studying the effects of acid rain on wildlife collected data from 163 streams in the Adirondack Mountains. They recorded the pH (acidity) of the water and the BCI, a measure of biological diversity, and they calculated R2 = 27%. Here’s a scatterplot of BCI against pH:a) What is
Dow Jones 2020 The Dow Jones Industrial Average summarizes the performance of stocks in some of the largest companies on the New York Stock Exchange. A regression of daily Dow prices on fractional year (that is, year plus the fraction of the year for each date) since 2020 for the years 2010 through
Twins by year 2018 In January 2012, the New York Times published a story called Twin Births in the U.S., Like Never Before, in which they reported a 76% increase in the rate of twin births from 1980 to 2009. Here are the number of twin births each year (per 1000 live births).
Vineyards again Instead of Age, perhaps the Size of the vineyard (in acres) is associated with the price of the wines.Look at the scatterplot:
Vineyards Here are the scatterplot and regression analysis for Case Prices of 36 wines from vineyards in the Finger Lakes region of New York State and the Ages of the vineyards. (Data in Vineyards)
Togetherness Are good grades in high school associated with family togetherness? A random sample of 142 high school students was asked how many meals per week their families ate together. Their responses produced a mean of 3.78 meals per week, with a standard deviation of 2.2. Researchers then
College Every year, US News and World Report publishes a special issue on many U.S. colleges and universities. The scatterplots have Student/Faculty Ratio (number of students per faculty member) for the colleges and universities on the y-axes plotted against 4 other variables. The correct
Scottish hill races, men and women climbing The Scottish hill races considered in Exercises 14 and 29 are run by both men and women. We can combine the data to fit a single model for both. Here is one such model. The variable Climb*Sex is the product of the variable Climb and the indicator variable
Scottish hill races, men and women The Scottish hill races considered in Exercise 14 are run by both men and women. We can combine the data to fit a single model for both. Here is one such model. The variable Dist*Sex is the product of the variable Distance and the indicator variable Sex, which is
Candy bars with nuts The data on candy bars per serving from Exercise 16 also has information on whether the candy bar has nuts. The variable Nuts is coded 0 for candy bars without nuts and 1 for those with nuts. Here’s the regression model of Exercise 16 with Nuts added:a) What is a proper
Hand dexterity Researchers studied the dexterity of children using a timed test called the Functional Dexterity Test (FDT). Of course, they needed to allow for differences in dexterity between their subjects’ dominant and non-dominant hands. Here is a scatterplot of the speed at which subjects
Grades The dataset Grades shows the five scores from an Introductory Statistics course. Find a model for final exam score by trying all possible models with two predictor variables.Which model would you choose? Be sure to check the conditions for multiple regression.
Cereals again We saw a model in Exercise 24 for the calorie count of a breakfast cereal. Can we predict the calories of a serving from its vitamin and mineral content? Here’s a multiple regression model of Calories per serving on its Sodium (mg), Potassium (mg), and Sugars (g):Assuming that the
Cereals We saw in Chapter 7 that the calorie content of a breakfast cereal is linearly associated with its sugar content. Is that the whole story? Here’s the output of a regression model that regresses Calories per serving on each serving’s Protein(g), Fat(g), Fiber(g), Carbohydrate(g), and
Body fat revisited The dataset on body fat contains 15 body measurements on 250 men from 22 to 81 years old. Is average%Body Fat related to Weight? Here’s a scatterplot:a) What does the slope coefficient mean in this regression?What happens if we add Height and Waist to that regression?Recall
GPA and SATs A large section of Stat 101 was asked to fill out a survey on grade point average and SAT scores. A regression was run to find out how well Math and Verbal SAT scores could predict academic performance as measured by GPA. The regression was run on a computer package with the following
Admin performance The AFL-CIO has undertaken a study of the yearly salaries (in thousands of dollars) of 30 administrative assistants. The organization wants to predict salaries from several other variables.The variables considered to be potential predictors of salary are:X1 = months of service X2
Home prices II Here are some diagnostic plots for the home prices data from Exercise 17. These were generated by a computer package and may look different from the plots generated by the packages you use. (In particular, note that the axes of the Normal probability plot are swapped relative to the
Predicting finals II Here are some diagnostic plots for the final exam data from Exercise 13. These were generated by a computer package and may look different from the plots generated by the packages you use. (In particular, note that the axes of the Normal probability plot are swapped relative to
More hill races Here is the regression for the women’s records for the same Scottish hill races we considered in Exercise 14:T Dependent variable is: Women’s Time (mins)R-squared = 96.7% s = 10.06 Variable Coefficient Intercept -11.6545 Climb (m) 0.045195 Distance 4.43427a) Compare the
Home prices Many variables have an impact on determining the price of a house. Among these are Living Area of the house (square feet) and number of Bathrooms. Information for a random sample of homes for sale in the Statesboro, GA, area was obtained from the Internet. Regression output modeling the
Candy bars: calories A student collected nutrition data about candy bars by reading the labels in a supermarket. Because candy bars have different “serving sizes,” the data are given as values per serving. Here is a regression predicting calories from the sugar (g/serving). (Five sugar-free
Attendance 2019 Several exercises in Chapter 7 showed that the attendance at American League baseball games increased with the number of runs scored. But fans may respond more to winning teams than to high-scoring games. Here is a regression of average attendance on both the average runs per game
Scottish hill races Hill running—races up and down hills—has a written history in Scotland dating back to the year 1040.Races are held throughout the year at different locations around Scotland. A recent compilation of information for 90 races (for which full information was available and
Predicting final exams How well do exams given during the semester predict performance on the final? One class had three tests during the semester. Computer output of the regression gives ) Write the equation of the regression model.b) How much of the variation in final exam scores is accounted for
More interpretations A household appliance manufacturer wants to analyze the relationship between total sales and the company’s three primary means of advertising (television, magazines, and radio). All values were in millions of dollars.They found the regression equation Sales = 250 + 6.75 TV +
Interpretations A regression performed to predict the selling price of houses found the equation Price = 169,328 + 35.3 Area + 0.718 Lotsize - 6543 Age where Price is in dollars, Area is in square feet, Lotsize is in square feet, and Age is in years. The R2 is 92%. One of the interpretations below
More indicators For each of these potential predictor variables say whether they should be represented in a regression model by indicator variables. If so, then suggest what specific indicators should be used (that is, what values they would have).a) In a regression to predict income, the age of
Indicators For each of these potential predictor variables, say whether they should be represented in a regression model by indicator variables. If so, then suggest what specific indicators should be used (that is, what values they would have).a) In a regression to predict weekly household milk
Hopkins Forest wind In Chapters 4 and 6 we’ve seen data from the Hopkins Forest. Here’s a regression that models the maximum daily wind speed in terms of the average temperature and precipitation:
Movie profits once more Look back at the regression in Exercise 3.Here is the partial regression plot for the coefficient of Budget.a) What is the slope of the least squares regression line in the partial regression plot?b) The point plotted with a red x is the movie Avatar, which had an
Movie residuals For the movies regression in Exercise 3, here is a histogram of the residuals. What does it tell us about the assumptions and conditions shown at the top of the next column?
More movie profits For the movies examined in Exercise 3, here is a scatterplot of USGross vs. Budget:What (if anything) does this scatterplot tell us about the following assumptions and conditions for the regression?a) Linearity Conditionb) Equal Spread Conditionc) Normality Assumption
Movie profits again A middle manager at an entertainment company, upon seeing the analysis of Exercise 3, concludes that longer movies make more money. He argues that his company’s films should all be padded by 30 minutes to improve their gross. Explain the flaw in his interpretation of this
Movie profits What can predict how much a motion picture will make? We have data on 609 releases that includes the USGross (in $M), the Budget ($M), the Run Time (minutes), and the score given by the critics on the Rotten Tomatoes website. The first several entries in the data table look like this:
Candy sales A candy maker surveyed chocolate bars available in a local supermarket and found the following least squares regression model:Calories = 28.4 + 11.37 Fat1g2 + 2.91 Sugar1g2.a) The hand-crafted chocolate she makes has 15 g of fat and 20 g of sugar. How many calories does the model
Housing prices The following regression model was found for the houses in upstate New York considered in the chapter:Price = 20,986.09 - 7483.10 Bedrooms + 93.84 Living Area.a) Find the predicted price of a 2-bedroom, 1000-sq-ft house from this model.b) The house just sold for $135,000. Find the
New York bridges The dataset New York Bridges holds data on all 17,504 bridges in the state. Use the Regression Simple Sample tool to draw many samples of 1000 from the full dataset and find regression slopes for Condition vs Built. Report what you find.
Tree growth A 1996 study examined the growth of grapefruit trees in Texas, determining the average trunk Diameter(in inches) for trees of varying Ages:a) Fit a linear model to these data. What concerns do you have about the model?b) If data had been given for individual trees instead of averages,
Years to live, 2017 Insurance companies and other organizations use actuarial tables to estimate the remaining lifespans of their customers. The data file gives life expectancy (estimated additional years of life) for black males in the United States,
Oranges The table below shows that as the number of oranges on a tree increases, the fruit tends to get smaller.Create a model for this relationship, and express any concerns you may have.
Slower is cheaper? Researchers studying how a car’s Fuel Efficiency varies with its Speed drove a compact car 200 miles at various speeds on a test track. Their data are shown in the table.Create a linear model for this relationship and report any concerns you may have about the model.
Lifting more weight In Exercise 74 you examined the record weightlifting performances for the Olympics. You found a reexpression of Weight Lifted.a) Find a model for Weight Lifted by re-expressing Weight Class instead of Weight Lifted.b) Compare this model to the one you found in Exercise 74.c)
Life expectancy in U.S. history The table gives the Life Expectancy in the United States every decade during the past 110 years (1 = 1900 to 1910, 2 = 1911 to 1920, etc.). Create a model to predict future increases in life expectancy (data from the National Vital Statistics Report).
Weightlifting 2020 Here are the world record men’s weightlifting performances as of 2020.a) Create a linear model for the Weight Lifted in each Weight Class, leaving out the 105+ unlimited class.b) Check the residuals plot. Is your linear model appropriate?c) Create a better model by
Logs (not logarithms) The value of a log is based on the number of board feet of lumber the log may contain. (A board foot is the equivalent of a piece of wood 1 inch thick, 12 inches wide, and 1 foot long. For example, a 2″ * 4″ piece that is 12 feet long contains 8 board feet.) To estimate
Planets, models, and laws The model you found in Exercise 68 is a relationship noted in the 17th century by Kepler as his Third Law of Planetary Motion. It was subsequently explained as a consequence of Newton’s Law of Gravitation. The models for Exercises 69, 70, and 71 relate to what is
Planets and Eris In July 2005, astronomers Mike Brown, Chad Trujillo, and David Rabinowitz announced the discovery of a sun-orbiting object, since named Eris,9 that is 5% larger than Pluto. Eris orbits the sun once every 560 earth years at an average distance of about 6300 million miles from the
Planets and asteroids The asteroid belt between Mars and Jupiter may be the remnants of a failed planet. If so, then Jupiter is really in position 6, Saturn is in 7, and so on. Repeat Exercise 69, using this revised method of numbering the positions. Which method seems to work better?
Is Pluto a planet? Let’s look again at the pattern in the locations of the planets in our solar system seen in the table in Exercise 68.a) Re-express the distances to create a model for the Distance from the sun based on the planet’s Position.b) Based on this model, would you agree with the
Planets Here is a table of the 9 sun-orbiting objects formerly known as planets.
Baseball salaries 2019 Ballplayers have been signing everlarger contracts. The highest salaries (in dollars per season) for each year since 1874 are in the data file Baseball salaries 2019.a) Make a scatterplot of Salary in 2019 vs. Year. Does it look straight?b) Find the best re-expression of
Pendulum A student experimenting with a pendulum counted the number of full swings the pendulum made in 20 seconds for various lengths of string. Her data are shown here.
Brakes The following table shows stopping distances in feet for a car tested 3 times at each of 5 speeds. We hope to create a model that predicts Stopping Distance from the Speed of the car.
Boyle Scientist Robert Boyle examined the relationship between the volume in which a gas is contained and the pressure in its container. He used a cylindrical container with a moveable top that could be raised or lowered to change the volume. He measured the Height in inches by counting equally
Here are regression output and a residual plot when we use the log of GDP in the model. Is this a better model for GDP? Explain. Would you want to consider a different re-expression? If so, which one?
Better GDP model? Consider again the post-1950 trend in U.S. GDP we examined in Exercise
TBill rates 2020, once more The 3-month Treasury bill interest rate is watched by investors and economists. Look at the scatterplot of the 3-month Treasury bill rate since 1934 in Exercise 43:Clearly, the relationship is not linear. Can it be made nearly linear with a re-expression? If so, which
USGDP 2020 The scatterplot shows the gross domestic product (GDP) of the United States in trillions of 2012 dollars plotted against years since 1950.
Crowdedness again In Exercise 58 we looked at United Nations data about a country’s GDP and the average number of people per room (Crowdedness) in housing there. For a re-expression, a student tried the reciprocal -10000>GDP, representing the number of people per $10,000 of gross domestic
Here are the revised regression analysis and residuals plot:a) Explain why this model appears to be better than the linear model.b) Using the regression analysis above, write an equation of this model.c) Interpret the slope of this line.d) Based on this model, how many miles per gallon would you
Gas mileage, revisited Let’s try the re-expressed variable Fuel Consumption (gal/100 mi) to examine the fuel efficiency of the 11 cars in Exercise
Crowdedness In a Chance magazine article (Summer 2005), Danielle Vasilescu and Howard Wainer used data from the United Nations Center for Human Settlements to investigate aspects of living conditions for several countries. Among the variables they looked at were the country’s per capita gross
Gas mileage As the example in the chapter indicates, one of the important factors determining a car’s Fuel Efficiency is its Weight. Let’s examine this relationship again, for 11 cars.a) Describe the association between these variables shown in the scatterplot at the top of the next column.
Hopkins winds, revisited In Chapter 4, we examined the wind speeds in the Hopkins Forest over the course of a year.Here’s the scatterplot we saw then: (Data in Hopkins Forest)a) Describe the pattern you see here.b) Should we try re-expressing either variable to make this plot straighter? Explain.
Oakland passengers 2016 revisited In Exercise 29, we considered whether a linear model would be appropriate to describe the trend in the number of passengers departing from the Oakland (CA) airport each month since the start of 1997. If we fit a regression model, we obtain this residual plot.
Showing 2500 - 2600
of 4734
First
19
20
21
22
23
24
25
26
27
28
29
30
31
32
33
Last
Step by Step Answers