New Semester
Started
Get
50% OFF
Study Help!
--h --m --s
Claim Now
Question Answers
Textbooks
Find textbooks, questions and answers
Oops, something went wrong!
Change your search query and then try again
S
Books
FREE
Study Help
Expert Questions
Accounting
General Management
Mathematics
Finance
Organizational Behaviour
Law
Physics
Operating System
Management Leadership
Sociology
Programming
Marketing
Database
Computer Network
Economics
Textbooks Solutions
Accounting
Managerial Accounting
Management Leadership
Cost Accounting
Statistics
Business Law
Corporate Finance
Finance
Economics
Auditing
Tutors
Online Tutors
Find a Tutor
Hire a Tutor
Become a Tutor
AI Tutor
AI Study Planner
NEW
Sell Books
Search
Search
Sign In
Register
study help
business
inferential statistics
Intro Stats 6th Edition Richard D. De Veaux, Paul F. Velleman, David Bock - Solutions
SI jinx Players in any sport who are having great seasons, turning in performances that are much better than anyone might have anticipated, often are pictured on the cover of Sports Illustrated. Frequently, their performances then falter somewhat, leading some athletes to believe in a “Sports
ESP People who claim to “have ESP” participate in a screening test in which they have to guess which of several images someone is thinking of. You and a friend both took the test. You scored 2 standard deviations above the mean, and your friend scored 1 standard deviation below the mean. The
Another ride The regression of Duration of a roller coaster ride on the height of its initial Drop, described in Exercise 30, had R2 = 29.4,.a) What is the correlation between Drop and Duration?b) What would you predict about the Duration of the ride on a coaster whose initial Drop was 1 standard
World Happiness Report, 2020 The World Happiness Report is an annual report published by the United Nations that studies the happiness levels of individuals per country along with other measures of well-being. For each of 153 countries, the report provides a “Ladder score”13 1units = ;happiness
More misinterpretations A Sociology student investigated the association between a country’s Literacy Rate and Life Expectancy, and then drew the conclusions listed below. Explain why each statement is incorrect. (Assume that all the calculations were done properly.)a) The R2 of 64% means that
Misinterpretations A biology student who created a regression model to use a bird’s Height when perched for predicting its Wingspan made these two statements. Assuming the calculations were done correctly, explain what is wrong with each interpretation.a) My R2 of 93% shows that this linear model
Coasters 2015 again Exercise 30 examined the association between the Duration of a roller coaster ride and the height of its initial Drop, reporting that R2 = 29.4,. Write a sentence (in context, of course) summarizing what the R2 says about this regression.
New York water again The regression of Consumption per Capita on Year has an R2 of 92.8%. Write a sentence (in context, of course) summarizing what the R2 says about this regression.
What slope again? If you create a regression model for estimating the Height of a pine tree (in feet) based on the Circumference of its trunk (in inches), is the slope most likely to be 0.1, 1, 10, or 100? Explain.
What slope? If you create a regression model for predicting the Weight of a car (in pounds) from its Length (in feet), is the slope most likely to be 3, 30, 300, or 3000? Explain.
Coasters 2015, revisited The dataset on roller coasters from Chapter 6, Exercise 23 lists the Duration of the ride in seconds in addition to the Drop height in feet for some of the coasters. One coaster (the “Tower of Terror”) is unusual for having a large drop but a short ride. After setting
New York water 2019 The New York City Open Data Initiative reports on annual water consumption. The table below shows daily water consumption per capita (in gallons) from 1986 to 2019 along with a scatterplot. (Source:
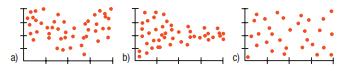
Residuals Tell what each of the residual plots below indicates about the appropriateness of the linear model that was fit to the data.
Residuals Tell what each of the residual plots below indicates about the appropriateness of the linear model that was fit to the data. a) c)
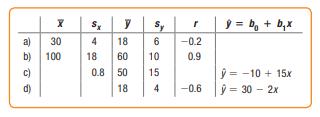
More regression equations Fill in the missing information in the following table. a) b) c) d) X Sx Sy = b + bx g 30 4 18 6 -0.2 100 80 18 60 10 0.9 0.8 50 15 = -10 + 15x 18 4 -0.6 = 30 - 2x
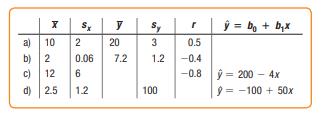
Regression equations Fill in the missing information in the following table. X Sx y Sy r = b + bx a) b) 2 72 10 2 20 3 0.5 0.06 7.2 1.2 -0.4 c) 12 6 -0.8 = 200 - 4x d) 2.5 1.2 100 -100 + 50x
Last tank! For Exercise 16’s regression model predicting fuel economy (in mpg) from the car’s engine size, se = 4.121 Explain in this context what that means.
Last bowl! For Exercise 15’s regression model predicting potassium content (in milligrams) from the amount of fiber (in grams) in breakfast cereals, se = 30.77. Explain in this context what that means.
Another car The correlation between a car’s engine displacement and its fuel economy (in mpg) is r = -0.719. What fraction of the variability in fuel economy is accounted for by the displacement?
Cereal again The correlation between a cereal’s fiber and potassium contents is r = 0.903. What fraction of the variability in potassium is accounted for by the amount of fiber that servings contain?
More engine size In Exercise 16, the regression model CombinedMPG = 33.47 - 3.32 Displacement relates cars’engine size to their fuel economy (CombinedMPG). Explain what the slope means.
Another bowl In Exercise 15, the regression model Potassium = 38 + 27 Fiber relates fiber (in grams) and potassium content (in milligrams) in servings of breakfast cereals. Explain what the slope means.
Engine size again Exercise 16 describes a regression model that uses a car’s engine displacement to estimate its fuel economy. In this context, what does it mean to say that a certain car has a positive residual?
More cereal Exercise 15 describes a regression model that estimates a cereal’s potassium content from the amount of fiber it contains. In this context, what does it mean to say that a cereal has a negative residual?
Engine size In Chapter 6, Exercise 41 we examined the relationship between the fuel economy (CombinedMPG)and Displacement (in liters) for a sample drawn from the 1262 cars in the dataset Fuel Economy 2019. An analysis using the entire dataset produces the regression model CombinedMPG = 33.47 - 3.32
Cereals For many people, breakfast cereal is an important source of fiber in their diets. Cereals also contain potassium, a mineral shown to be associated with maintaining a healthy blood pressure. An analysis of the amount of fiber (in grams)and the potassium content (in milligrams) in servings of
Disk drives 2020, residuals again Here is a scatterplot of the residuals from the regression of the hard drive prices on their sizes from Exercise 6.a) Are any assumptions or conditions violated? If so, which ones?b) What would you recommend about this regression?
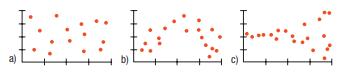
Residual plots Here are residual plots (residuals plotted against predicted values) for three linear regression models. Indicate which condition appears to be violated (straight enough, outlier, or equal spread) in each case.
Disk drives encore For the hard drive data of Exercise 6, find and interpret the value of R2
Bookstore sales last time For the regression model for the bookstore of Exercise 5, what is the value of R2 and what does it mean?
Disk drives 2020, residuals Here are the residuals for a regression of Price on Capacity for the hard drives of Exercise 6(based on the hand-computed coefficients)a) Which residual contributes the most to the sum that is minimized by the least squares criterion?b) Seven of the residuals are
Bookstore sales once more Here are the residuals for a regression of Sales on Number of Sales People Working for the bookstore of Exercise 5:a) What are the units of the residuals?b) Which residual contributes the most to the sum that was minimized according to the least squares criterion to find
Suppose we want to predict Price from Capacity.a) Find the slope estimate, b1.b) What does it mean, in this context?c) Find the intercept, b0.d) What does it mean, in this context? Is it meaningful?e) Write down the equation that predicts Price from Capacity.f) What would you predict for the price
Disk drives 2020 again Recall the data on disk drives we saw in Chapter 6, Exercise
Bookstore sales revisited Recall the data we saw in Chapter 6, Exercise 3 for a bookstore. The manager wants to predict Sales from Number of Sales People Working.a) Find the slope estimate, b1.b) What does it mean, in this context?c) Find the intercept, b0.d) What does it mean, in this context? Is
Residual interpretations The newborn grandson of one of the authors was 48 cm long and weighed 3 kg.According to the regression model of Exercise 3, what was his residual?What does that say about him?
Least squares interpretations A least squares regression line was calculated to relate the length (cm) of newborn boys to their weight in kg. The line is weight = -5.94 + 0.1875 length.Explain in words what this model means. Should new parents(who tend to worry) be concerned if their newborn’s
True or false II If false, explain briefly.a) Some of the residuals from a least squares linear model will be positive and some will be negative.b) Least squares means that some of the squares of the residuals are minimized.c) We write yn to denote the predicted values and y to denote the observed
True or false If false, explain briefly.a) We choose the linear model that passes through the most data points on the scatterplot.b) The residuals are the observed y-values minus the y-values predicted by the linear model.c) Least squares means that the square of the largest residual is as small as
Freedom, social support, and corruption The World Happiness Report also reports on perceived levels of social support, freedom to make life choices, and corruption across 153 countries.Consider the following correlation table summarizing the relationships among these variables.
World Happiness Report, 2020 The World Happiness Report is an annual report published by the United Nations that studies the happiness levels of individuals in each country along with other measures of well-being. For each of 153 countries, the report provides a happiness score, computed as the
Sleep quality One of the contributing authors recorded their sleep quality data over the course of 113 nights from their Fitbit activity tracking wristband. Here is a scatterplot of minutes of deep sleep against % restlessness.
American Time Use Survey, 2018 The American Time Use Survey (ATUS) is an annual survey conducted by the Bureau of Labor Statistics (www.bls.gov) to better understand how Americans spend their time over the course of a 24-hour period.For this exercise, we examine a sample of 30 respondents from the
Flights 2019 Here are the number of domestic flights flown in each year from 2000 to 2019 (www.transtats.bts.gov/homepage.asp):a) Find the correlation of Flights with Year.b) Make a scatterplot and describe the trend.c) Why is the correlation you found in part a not a suitable summary of the
Planets (more or less) On August 24, 2006, the International Astronomical Union voted that Pluto is not a planet. Some members of the public have been reluctant to accept that decision. Let’s look at some of the data. Is there any pattern to the locations of the planets? The table shows the
Vehicle weights The Minnesota Department of Transportation hoped that they could measure the weights of big trucks without actually stopping the vehicles by using a newly developed“weight-in-motion” scale. To see if the new device was accurate, they conducted a calibration test. They weighed
Thrills III For the roller coaster data in Exercise 49:a) Explain why in looking for a variable that explains rank, you will be hoping for a negative correlation.b) Do any of the provided variables provide a strong predictor for roller coaster rank?
Thrills II For the roller coaster data in Exercise 49:a) Examine the relationship between Initial Drop and Speed.b) Examine the relationship between Initial Drop and Height.c) What conclusions can you safely draw about the initial drop of a roller coaster? Is Initial Drop strongly correlated with
Thrills 2013 Since 1994, the Best Roller Coaster Poll(www.ushsho.com/bestrollercoasterpoll.htm) has been ranking the world’s best roller coasters. In 2013, Bizarro dropped to 4th after earning the top steel coaster rank for six straight years.Data on the top 14 steel coasters from this poll are
Housing price sampled In a dataset of 1057 New York homes offered for sale, a histogram of the ages looks like this:Draw 1000 samples of size 100 from the full dataset. For each sample find the mean and median. Make histograms of the 1000 means and the 1000 medians.a) Describe the distributions.b)
Coasters 2015 sampled Return to the data on roller coasters seen in Exercise 23. Here is the distribution of the lengths of the rides of 241 coasters ?Draw 1000 samples of size 60 from the full dataset. For each sample find the mean and median. Make histograms of the 1000 means and the 1000
Second inning 2019 Perhaps fans are just more interested in teams that win. The scatterplot and correlation table below are based on American League teams for the 2019 season. (Data in Attendance 2019)a) Do winning teams generally enjoy greater attendance at their home games? Describe the
Attendance 2019 American League baseball games are played under the designated hitter rule, meaning that pitchers, often weak hitters, do not come to bat. Baseball owners believe that the designated hitter rule means more runs scored, which in turn means higher attendance. Is there evidence that
Burgers again In the previous exercise you analyzed the association between the amounts of fat and sodium in fast food hamburgers. What about fat and calories? Here are data for the same burgers:Analyze the association between fat content and calories using correlation and scatterplots.
Burgers Fast food is often considered unhealthy because much of it is high in both fat and sodium. But are the two related?Here are the fat and sodium contents of several brands of burgers.Analyze the association between fat content and sodium using correlation and scatterplots.
Burgers Fast food is often considered unhealthy because much of it is high in both fat and sodium. But are the two related?Here are the fat and sodium contents of several brands of burgers.a) Create a scatterplot.b) What is the correlation between the percent of teens who have used marijuana and
Drug abuse A survey was conducted in the United States and 10 countries of Western Europe to determine the percentage of teenagers who had used marijuana and other drugs. The results are summarized in the following table.a) Create a scatterplot.b) What is the correlation between the percent of
Fuel economy 2019 Take a random sample of size 50 from the Fuel Economy 2019 dataset. Keep the variables Make, Model, Displacement (engine size), and Comb MPG (combined highway and city fuel efficiency).a) Make a scatterplot of Comb MPG by Displacement and comment on its direction, form, and
Interest rates and mortgages 2020 Since 1985, average mortgage interest rates have fluctuated from a low of nearly 3% to a high of over 14%. Is there a relationship between the amount of money people borrow and the interest rate that’s offered? Here is a scatterplot of Mortgage Loan Amount in the
Income and housing The Office of Federal Housing Enterprise Oversight (www.fhfa.gov) collects data on various aspects of housing costs around the United States. Here is a scatterplot of the Housing Cost Index versus the Median Family Income for each of the 50 states. The correlation is 0.65.
Sample survey A polling organization is checking its database to see if the data sources it used sampled the same ZIP codes.The variable Datasource = 1 if the data source is MetroMedia, 2 if the data source is DataQwest, and 3 if it’s RollingPoll. The organization finds that the correlation
Baldness and heart disease Medical researchers followed 1435 middle-aged men for a period of 5 years, measuring the amount of Baldness present (none = 1, little = 2, some = 3, much = 4, extreme = 5) and presence of Heart Disease(No = 0, Yes = 1). They found a correlation of 0.089 between the two
Correlation conclusions II The correlation between Fuel Efficiency (as measured by miles per gallon) and Price of 150 cars at a large dealership is r = -0.34. Explain whether or not each of these possible conclusions is justified:a) The more you pay, the lower the fuel efficiency of your car will
Correlation conclusions I The correlation between Age and Income as measured on 100 people is r = 0.75. Explain whether or not each of these possible conclusions is justified:a) When Age increases, Income increases as well.b) The form of the relationship between Age and Income is straight.c) There
Smart phones and life expectancy A survey of the world’s nations in 2014 shows a strong positive correlation between percentage of the country using smart phones and life expectancy in years at birth.a) Does this mean that smart phones are good for your health?b) What might explain the strong
Height and reading A researcher studies children in elementary school and finds a strong positive linear association between height and reading scores.a) Does this mean that taller children are generally better readers?b) What might explain the strong correlation?
More correlation errors Students in the Economics class discussed in Exercise 31 also wrote these conclusions. Explain the mistakes they made.a) “There was a very strong correlation of 1.22 between Life Expectancy and GDP.”b) “The correlation between Literacy Rate and GDP was 0.83.This shows
Correlation errors Your Economics instructor assigns your class to investigate factors associated with the gross domestic product (GDP) of nations. Each student examines a different factor (such as Life Expectancy, Literacy Rate, etc.) for a few countries and reports to the class. Apparently, some
More predictions Hurricane Katrina’s hurricane-force winds extended 120 miles from its center. Katrina was a big storm, and that affects how we think about the prediction errors.Suppose we add 120 miles to each error to get an idea of how far from the predicted track we might still find damaging
Prediction units The errors in predicting hurricane tracks(examined in this chapter) were given in nautical miles. A statutory mile is 0.86898 nautical mile. Most people living on the Gulf Coast of the United States would prefer to know the prediction errors in statutory miles rather than nautical
Association V A researcher investigating the association between two variables collected some data and was surprised when he calculated the correlation. He had expected to find a fairly strong association, yet the correlation was near 0.Discouraged, he didn’t bother making a scatterplot. Explain
Cold nights Is there an association between time of year and the nighttime temperature in North Dakota? A researcher assigned the numbers 1–365 to the days January 1–December 31 and recorded the temperature at 2:00 a.m. for each. What might you expect the correlation between Day Number and
Traffic headaches A study of traffic delays in 68 U.S. cities found the following relationship between Total Delay (in total hours lost) and Mean Highway Speed:Is it appropriate to summarize the strength of association with a correlation? Explain.
Streams and hard water In a study of streams in the Adirondack Mountains, the following relationship was found between the water’s pH and its hardness (measured in grains):
Antidepressants A study compared the effectiveness of several antidepressants by examining the experiments in which they had passed the FDA requirements. Each of those experiments compared the active drug with a placebo, an inert pill given to some of the subjects. In each experiment some patients
Coasters 2015 Most roller coasters get their speed by dropping down a steep initial incline, so it makes sense that the height of that drop might be related to the speed of the coaster. Here’s a scatterplot of top Speed and largest Drop for 118 roller coasters around the world.a) Does the
Car thefts The National Insurance Crime Bureau reports that Honda Accords, Honda Civics, and Toyota Camrys are the cars most frequently reported stolen, while Ford Tauruses, Pontiac Vibes, and Buick LeSabres are stolen least often. Is it reasonable to say that there’s a correlation between the
Politics A candidate for office claims that “there is a correlation between television watching and crime.” Criticize this statement on statistical grounds.
Matching II Here are several scatterplots. The calculated correlations are -0.977, -0.021, 0.736, and 0.951. Which is which?
Matching Here are several scatterplots. The calculated correlations are -0.923, -0.487, 0.006, and 0.777. Which is which?
Coffee sales Owners of a new coffee shop tracked sales for the first 20 days and displayed the data in a scatterplot (by day).a) Make a histogram of the daily sales since the shop has been in business.b) State one fact that is obvious from the scatterplot, but not from the histogram.c) State one
Firing pottery A ceramics factory can fire eight large batches of pottery a day. Sometimes a few of the pieces break in the process. In order to understand the problem better, the factory records the number of broken pieces in each batch for 3 days and then creates the scatterplot shown.a) Make a
Kentucky Derby 2020 The fastest horse in Kentucky Derby history was Secretariat in 1973. The scatterplot shows speed(in miles per hour) of the winning horses each year.What do you see? In most sporting events, performances have improved and continue to improve, so surely we anticipate a positive
Performance IQ scores vs. brain size. A study examined brain size (measured as pixels counted in a digitized magnetic resonance image [MRI] of a cross section of the brain) and IQ (4 performance scales of the Wechsler IQ test) for college students. The scatterplot shows the Performance IQ scores
Scatterplots II Which of these scatterplots showa) little or no association?b) a negative association?c) a linear association?d) a moderately strong association?e) a very strong association?
Scatterplots Which of these scatterplots showa) little or no association?b) a negative association?c) a linear association?d) a moderately strong association?e) a very strong association?
Association IV Suppose you were to collect data for each pair of variables. You want to make a scatterplot. Which variable would you use as the explanatory variable and which as the response variable? Why? What would you expect to see in the scatterplot? Discuss the likely direction, form, and
Association III Suppose you were to collect data for each pair of variables. You want to make a scatterplot. Which variable would you use as the explanatory variable and which as the response variable? Why? What would you expect to see in the scatterplot? Discuss the likely direction, form, and
Dexterity scores Scores on a test of dexterity are recorded by timing a subject who is inverting pegs by picking them up with one hand, manipulating them to turn them over, and then placing them back in a frame. A typical 4-year-old needs about 3.125 seconds to invert a peg, but a 9-year-old takes
Salaries and logs For an analysis of the salaries of your company, you plot the salaries of all employees against the number of years they have worked for the company. You find that plotting the base-10 logarithm of salary makes the plot much straighter. A part-time shipping clerk who has worked at
Blizzards A study finds that during blizzards, online sales are highly associated with the number of snow plows on the road;the more plows, the more online purchases. The director of an association of online merchants suggests that the organization should encourage municipalities to send out more
Bookstore sales again A larger firm is considering acquiring the bookstore of Exercise 3. An analyst for the firm, noting the relationship seen in Exercise 3, suggests that when they acquire the store they should hire more people because that will drive higher sales. Is his conclusion justified?
Correlation facts II If we assume that the conditions for correlation are met, which of the following are true? If false, explain briefly.a) A correlation of 0.02 indicates a strong, positive association.b) Standardizing the variables will make the correlation 0.c) Adding an outlier can
Correlation facts If we assume that the conditions for correlation are met, which of the following are true? If false, explain briefly.a) A correlation of -0.98 indicates a strong, negative association.b) Multiplying every value of x by 2 will double the correlation.c) The units of the correlation
Disk drives 2020 Disk drives have been getting larger.Their capacity is now often given in terabytes (TB), where 1 TB = 1000 gigabytes, or about a trillion bytes. A search of prices for external disk drives on Amazon.com in mid2020 found the following data:
Bookstore sales Consider the following data from a small bookstore:a) Prepare a scatterplot of Sales against Number of sales people working.b) What can you say about the direction of the association?c) What can you say about the form of the relationship?d) What can you say about the strength of the
Association II Suppose you were to collect data for each pair of variables. You want to make a scatterplot. Which variable would you use as the explanatory variable and which as the response variable? Why? What would you expect to see in the scatterplot? Discuss the likely direction, form, and
Association Suppose you were to collect data for each pair of variables. You want to make a scatterplot. Which variable would you use as the explanatory variable and which as the response variable? Why? What would you expect to see in the scatterplot? Discuss the likely direction, form, and
Movies investigation The dataset Movies 06-15 introduced in the Chapter 3 exercises includes the distributor, number of tickets sold, and gross revenue in addition to the MPAA rating and the genre for each of the 10 years 2006 to 2015. Investigate the associations among the variables that you find
Student survey investigation The Student Survey dataset introduced in the Chapter 3 exercises includes responses to 13 questions. Investigate the associations among the variables that you find interesting. Write a short report on what you discover. Be sure to include summary statistics, tables, and
Showing 2700 - 2800
of 4734
First
21
22
23
24
25
26
27
28
29
30
31
32
33
34
35
Last
Step by Step Answers