New Semester
Started
Get
50% OFF
Study Help!
--h --m --s
Claim Now
Question Answers
Textbooks
Find textbooks, questions and answers
Oops, something went wrong!
Change your search query and then try again
S
Books
FREE
Study Help
Expert Questions
Accounting
General Management
Mathematics
Finance
Organizational Behaviour
Law
Physics
Operating System
Management Leadership
Sociology
Programming
Marketing
Database
Computer Network
Economics
Textbooks Solutions
Accounting
Managerial Accounting
Management Leadership
Cost Accounting
Statistics
Business Law
Corporate Finance
Finance
Economics
Auditing
Tutors
Online Tutors
Find a Tutor
Hire a Tutor
Become a Tutor
AI Tutor
AI Study Planner
NEW
Sell Books
Search
Search
Sign In
Register
study help
business
inferential statistics
Intro Stats 6th Edition Richard D. De Veaux, Paul F. Velleman, David Bock - Solutions
Mensa People with z-scores above 2.5 on an IQ test are sometimes classified as geniuses. If IQ scores have a mean of 100 and a standard deviation of 15 points, what IQ score do you need to be considered a genius?
Stats test The mean score on the Stats exam was 75 points with a standard deviation of 5 points, and Gregor’s z-score was-2. How many points did he score?
Leisure time, revisited In Exercise 54, we observed that respondents who were employed spent less time on socializing, relaxing, and leisure compared to respondents who were not employed. Given the variation among individual respondents, could that difference be attributed to chance? To examine
Caring for household members, revisited In Exercise 53, we observed that females have a higher median time spent on caring for household members relative to males. Given the variation among individual respondents, could that difference be attributed to chance? To examine this question further, we
Leisure time The same American Time Use Survey (ATUS) in Exercise 53 also tracked the time respondents spent on socializing, relaxing, and leisure over the course of a day. The following table summarizes results from the 2018 survey, by the respondent’s employment status.a) Based on the
Caring for household members The American Time Use Survey (ATUS) is an annual survey conducted by the Bureau of Labor Statistics (www.bls.gov) to better understand how Americans spend their time over the course of a typical 24-hour period. The following table summarizes results from the 2018 survey
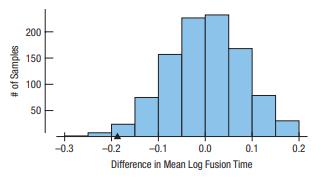
Stereograms shuffled From Exercise 50 it appeared that the mean log fusion time for the VV group was greater than that of the NV group. Could the difference be due to chance? The histogram below shows the difference in the means of the log fusion times by randomly selecting two groups (ignoring the
Cost of living sampled From Exercise 16 it appeared that the mean cost of a loaf of bread was slightly higher than the mean cost of a bottle of water. Given the variation among the prices, could that difference be due just to chance? To examine that further, we took 1000 random samples of 100
Stereograms, revisited Because of the skewness of the distributions of fusion times described in Exercise 49, we might consider a re-expression. Here are the boxplots of the log of fusion times. Is it better to analyze the original fusion times or the log fusion times? Explain.
Stereograms Stereograms appear to be composed entirely of random dots. However, they contain separate images that a viewer can “fuse” into a three-dimensional (3D) image by staring at the dots while defocusing the eyes. An experiment was performed to determine whether knowledge of the embedded
Rainmakers The table lists the amounts of rainfall (in acrefeet) from the 26 clouds seeded with silver iodide discussed in Exercise 40. (Data in Cloud Seeding)a) Plot these data, and describe the distribution.b) Create a re-expression of these data that produces a more advantageous distribution.c)
Assets again Here are the same data you saw in Exercise 45 after re-expressions as the square root of assets (in $M) and the logarithm of assets (in $M):a) Which re-expression do you prefer? Why?b) In the square root re-expression, what does the value 50 actually indicate about the company’s
Music library Students were asked how many songs they had in their digital music libraries. Here’s a display of the responses:a) What aspect of this distribution makes it difficult to summarize, or to discuss, center and spread?b) What would you suggest doing with these data if we want to
Assets Here is a histogram of the assets (in millions of dollars)of 79 companies chosen from the Forbes list of the nation’s top corporations: (Data in Companies)a) What aspect of this distribution makes it difficult to summarize, or to discuss, center and spread?b) What would you suggest doing
Baseball 2019 American League baseball teams play their games with the designated hitter rule, meaning that pitchers do not bat. The league believes that replacing the pitcher, typically a weak hitter, with another player in the batting order produces more runs and generates more interest among
MPG 2021 A consumer organization wants to compare gas mileage figures for several models of cars made in the United States with autos manufactured in other countries. The data for a random sample of cars are found in the file MPG 2021.a) Create graphical displays for the three groups.b) Write a few
Cholesterol and smoking A study that examined the health risks of smoking measured the cholesterol levels of people who had smoked for at least 25 years and people of similar ages who had smoked for no more than 5 years and then stopped. Create appropriate graphical displays for both groups, and
Industrial experiment Engineers at a computer production plant tested two methods for accuracy in drilling holes into a PC board. They tested how fast they could set the drilling machine by running 10 boards at each of two different speeds. To assess the results, they measured the distance (in
Cloud seeding In an experiment to determine whether seeding clouds with silver iodide increases rainfall, 52 clouds were randomly assigned to be seeded or not. The amount of rain they generated was then measured (in acre-feet). Here are the summary statistics:a) Which of the summary statistics are
Reading scores A class of fourth graders takes a diagnostic reading test, and the scores are reported by reading grade level.The 5-number summaries for the 14 boys and 11 girls are shown:a) Which group had the highest score?b) Which group had the greater range?c) Which group had the greater
Framingham cholesterol The Framingham Heart Study recorded the cholesterol levels of more than 1400 participants.(Data in Framingham) Here is an ogive of the distribution of these cholesterol measures. (An ogive shows the percentage of cases at or below a certain value.) Construct a boxplot for
Derby speeds 2020 (Data in Kentucky Derby 2020) How fast do horses run? Kentucky Derby winners run well over 30 miles per hour, as shown in this graph. The graph shows the percentage of Derby winners that have run slower than each given speed. Note that few have won running less than 33 miles per
SAT scores Here are the summary statistics for Verbal SAT scores for a high school graduating class:a) Create side-by-side boxplots comparing the scores of boys and girls as best you can from the information given.b) Write a brief report on these results. Be sure to discuss the shape, center, and
Caffeine A student study of the effects of caffeine asked volunteers to take a memory test 2 hours after drinking soda. Some drank caffeine-free cola, some drank regular cola (with caffeine), and others drank a mixture of the two (getting a halfdose of caffeine). Here are the 5-number summaries for
Vineyards Here are summary statistics for the sizes (in acres)of a collection of vineyards in the Finger Lakes region of New York State:Suppose you didn’t have access to the data. Answer the following questions from the summary statistics alone:a) Would you describe this distribution as symmetric
Graduation? A survey of major universities asked what percentage of incoming freshmen usually graduate “on time”in 4 years. Use the summary statistics given to answer the questions that follow.a) Would you describe this distribution as symmetric or skewed? Explain.b) Are there any outliers?
Eye and hair color A survey of 1021 school-age children was conducted by randomly selecting children from several large urban elementary schools. Two of the questions concerned eye and hair color. In the survey, the following codes were used:The statistics students analyzing the data were asked to
Test scores Three statistics classes all took the same test. Histograms and boxplots of the scores for each class are shown below. Match each class with the corresponding boxplot.
Ozone Ozone levels (in parts per billion, ppb) were recorded at sites in New Jersey monthly between 1926 and 1971. Here are boxplots of the data for each month (over the 46 years), lined up in order (January = 1):a) In what month was the highest ozone level ever recorded?b) Which month has the
Fuel economy The U.S. Department of Energy (www.fueleconomy.gov/feg/download.shtml) provides fuel economy and pollution information on 170 2021 car models. Here is a boxplot of Combined Fuel Economy (using an average of driving conditions) in miles per gallon by the 144 models whose Class is one of
Fuel economy and cylinders Describe what these boxplots tell you about the relationship between the number of cylinders a car’s engine has and the car’s fuel economy (mpg).
Marriage age Do men and women marry at the same age?Here are boxplots of the age at first marriage for a sample of U.S. citizens from the most recent Current Population Survey(CPS) of the U.S. Census. Write a brief report discussing what these data show.
Gas prices 2019 Here are boxplots of monthly gas prices for regular gas in the United States as reported by the U.S. Energy Information Administration for 2009 through October 2019:a) Compare the distribution of prices over the eleven years.b) Compare the stability of prices over the eleven years.
Women’s basketball Here are boxplots of the points scored during the first 10 games of the season for both Scyrine and Alexandra:a) Summarize the similarities and differences in their performance so far.b) The coach can take only one player to the state championship. Which one should she take?
Deaths 2018 A National Vital Statistics Report (www.cdc.gov/nchs/) provides information on deaths by age, sex, and race. Below are displays of the distributions of ages at death for White and Black males:a) Describe the overall shapes of these distributions.b) How do the distributions differ?c)
Hospital stays The U.S. National Center for Health Statistics compiles data on the length of stay by patients in short-term hospitals and publishes its findings in Vital and Health Statistics. Data from a sample of 39 male patients and 35 female patients on length of stay (in days) are displayed in
Camp sites Shown below are the histogram and summary statistics for the number of camp sites at public parks in Vermont:a) Which statistics would you use to identify the center and spread of this distribution? Why?b) How many parks would you classify as outliers? Explain.c) Create a boxplot for
Population growth, by region (Data in Population Growth 2010) Below is a “back-to-back” stem-and-leaf display that shows two datasets at once—one going to the left, one to the right. The display compares the percent change in population for two regions of the United States (based on census
Tendon transfers People with spinal cord injuries may lose function in some, but not all, of their muscles. The ability to push oneself up is particularly important for shifting position when seated and for transferring into and out of wheelchairs.Surgeons compared two operations to restore the
Sugar in cereal Sugar is a major ingredient in many breakfast cereals. The histogram displays the sugar content as a percentage of weight for 49 brands of cereal. The boxplots compare sugar content for adult and children’s cereals.a) What is the range of the sugar contents of these cereals?b)
Slalom times 2018 The Men’s Giant Slalom skiing event consists of two runs whose times are added together for a final score. Two displays of the giant slalom times in the 2018 Winter Olympics at PyeongChang are shown belowa) What features of the distribution can you see in both the histogram and
Rock concert deaths Crowd Management Strategies (www.crowdsafe.com) monitors accidents at rock concerts. In their database, they list the names and other variables of victims whose deaths were attributed to “crowd crush” at rock concerts.Here are the histogram and boxplot of the victims’ ages
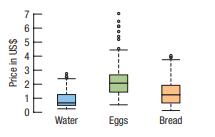
Cost of living 2020—cities Here are the same three prices as in Exercise 15 but for 449 cities around the world. (Prices are all in US$ as of June 2020; data in COLall 2020.)a) In general, which commodity is the most expensive?b) Is a carton of eggs always more expensive than a bottle of water?
Cost of living 2020, selected countries To help travelers know what to expect, researchers collected the prices of commodities in 101 countries throughout the world. Here are boxplots comparing the average prices of a bottle of water, a dozen eggs, and a loaf of bread in the 101 countries (prices
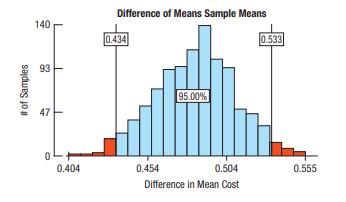
Pizza price differences The mean price of pizza in Baltimore was $2.85, $0.23 higher than the mean price of $2.62 in Dallas.To see if that difference was real, or due to chance, we took the 156 prices from Baltimore and Dallas and mixed those 312 prices together. Then we randomly chose 2 groups of
Pizza prices by city (Data in Pizza prices) The company that sells frozen pizza to stores in four markets in the United States(Denver, Baltimore, Dallas, and Chicago) wants to examine the prices that the stores charge for pizza slices. Here are boxplots comparing data from a sample of stores in
Groups on the Internet Find data on the Internet (or elsewhere) for two or more groups. Make appropriate displays to compare the groups, and interpret what you find.
In the news Find an article in a newspaper, a magazine, or the Internet that compares two or more groups of data.a) Does the article discuss the W’s?b) Is the chosen display appropriate? Explain.c) Discuss what the display reveals about the groups.d) Does the article accurately describe and
Exoplanets re-expressed Here are the exoplanet distances of Exercise 9, re-expressed to the log scale:a) Is this a better scale to understand these distances?b) The low outlier is “sol”— that is, it is the distance of the sun from the earth. Do you think it belongs with these data?
Exoplanets Discoveries of planets beyond our solar system have grown rapidly. Here is a histogram showing the distance(in light-years) from earth to stars known as of 2019 that could possibly sustain life because they are in the “habitable zone”around their star—not too hot and not too
Extraordinary months again (Data in Load factors 2019)Examine the boxplot of all of the domestic load factors on the next page.The boxplots of Exercise 6 show the same data, but the outlier they show is for a different month and year. Why do you think this is?
Extraordinary months (Data in Load factors 2019) Look at the boxplots by year in Exercise 6. The outlier in 2015 corresponds to January—probably due to a blizzard that dumped up to 20" of snow on the East coast on January 26-27. Do you think that data for months affected by extraordinary weather
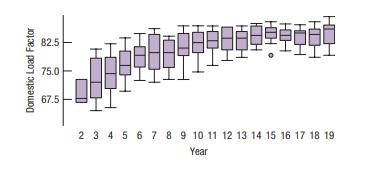
Load factors 2019 by year Here is a display of the domestic load factors by year through 2019 Domestic Load Factor 82.5 75.0 IT 67.5 II 2 3 4 5 6 7 8 9 10 11 12 13 14 15 16 17 18 19 Year
Load factors 2019 by month Here is a display of the international load factors by month for the period from 2002 to 2019: Discuss the patterns you see in this display.
Prisons 2014 In a way, boxplots are the opposite of histograms.A histogram divides the number line into equal intervals and displays the number of data values in each interval. A boxplot divides the data into equal parts and displays the portion of the number line each part covers. These two plots
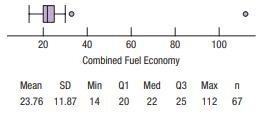
Fuel economy The boxplot shows the fuel economy ratings for 67 model–year–2012 subcompact cars. Some summary statistics are also provided. The extreme outlier is the Mitsubishi i-MiEV, an electric car whose electricity usage is equivalent to 112 miles per gallon.If that electric car is removed
Load factors, 2019 by season We can also compare domestic load factors for September through March versus those for April through August:Compare and contrast what these histograms show.
Load factors 2019 The Research and Innovative Technology Administration of the Bureau of Transportation Statistics (www.TranStats bts.gov/Data_Elements.aspx?Data=2) reports load factors (passenger-miles as a percentage of available seat-miles) for commercial airlines for every month from 2002.
Be a Simpson Can you design a Simpson’s paradox? Two companies are vying for a city’s “Best Local Employer”award, to be given to the company most committed to hiring local residents. Although both employers hired 300 new people in the past year, Company A brags that it deserves the award
Graduate admissions A famous article in the magazine Science examined the graduate admissions process at Berkeley for evidence of sex discrimination. The table below shows the number of applicants accepted to each of four graduate programs:a) What percent of total applicants were admitted?b)
Delivery service A company must decide which of two delivery services it will contract with. During a recent trial period, the company shipped numerous packages with each service and kept track of how often deliveries did not arrive on time. Here are the data:a) Compare the two services’ overall
Hospitals Most patients who undergo surgery make routine recoveries and are discharged as planned. Others suffer excessive bleeding, infection, or other postsurgical complications and have their discharges from the hospital delayed. Suppose your city has a large hospital and a small hospital, each
College values shuffled In Exercise 8 you were asked to compare the responses of college presidents and all U.S. adults to the question about the value of a college education. To examine that question further, we randomly scrambled the responses and created 15 new mosaic plots of these scrambled
Diet and politics shuffled In Exercise 5 you were asked whether you thought the differences in political identification across diet preferences were real. To examine that question further, we randomly scrambled the students’ politics preferences and created 8 new bar charts of these scrambled
Tattoos A study by the University of Texas Southwestern Medical Center examined 626 people to see if an increased risk of contracting hepatitis C was associated with having a tattoo. If the subject had a tattoo, researchers asked whether it had been done in a commercial tattoo parlor or elsewhere.
Drivers’ licenses 2020 The table shows the number of licensed U.S. drivers (in millions) by age and by sex in 2020.(www.fhwa.dot.gov/policyinformation/statistics.cfm)a) What percent of total drivers are under 20?b) What percent of total drivers are male?c) Write a few sentences comparing the
Antidepressants and bone fractures For a period of five years, physicians at McGill University Health Center followed more than 5000 adults over the age of 50. The researchers were investigating whether people taking a certain class of antidepressants (SSRIs) might be at greater risk of bone
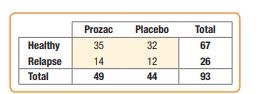
Anorexia Hearing anecdotal reports that some patients undergoing treatment for the eating disorder anorexia seemed to be responding positively to the antidepressant Prozac, medical researchers conducted an experiment to investigate. They found 93 self-identified women being treated for anorexia who
Obesity and exercise The Centers for Disease Control and Prevention (CDC) has estimated that 19.8% of Americans over 15 years old are obese. The CDC conducts a survey on obesity and various behaviors. Here is a table on self-reported exercise classified by body mass index (BMI):a) Are these
Blood pressure A company held a blood pressure screening clinic for its employees. The results are summarized in the table below by Age and Blood pressure:a) Find the marginal distribution of blood pressure level.b) Find the conditional distribution of blood pressure level within each age group.c)
COVID, blood type, and age Exercise 10 looked at data on blood type, hospitalization, and death from the COVID-19 virus in one hospital. Do the results differ according to age?Here are data for just the 1888 subjects who were hospitalized:a) Would you choose row or column percents to look at the
Weather forecasts Just how accurate are the weather forecasts we hear every day? The following table compares the daily forecast with a city’s actual weather for a year:a) On what percent of days did it actually rain?b) On what percent of days was rain predicted?c) What percent of the time was
Parking lots A survey of autos parked in student and staff lots at a large university classified the brands by country of origin, as seen in the tablea) What percent of all the cars surveyed were foreign?b) What percent of the American cars were owned by students?c) What percent of the students
Does it appear that the admissions decisions are made independent of the applicant’s ethnicity? Explain.
Back to school Examine the table about ethnicity and acceptance for the Houston Independent School District’s magnet schools program, shown in Exercise
More politics Look once more at the table summarizing the political views of Intro Stats students in Exercise 30.a) Produce a graphical display comparing the conditional distributions of males and females among the three categories of politics.b) Comment briefly on what you see from the display in
Magnet schools A Chance magazine article examined the impact of an applicant’s ethnicity on the likelihood of admission to the Houston Independent School District’s magnet schools programs. Those data are summarized in the table below:a) What percent of all applicants were Asian?b) What percent
Politics revisited Look again at the table of political views for the Intro Stats students in Exercise 30.a) Find the conditional distributions (percentages) of political views for the females.b) Find the conditional distributions (percentages) of political views for the males.c) Make a graphical
More about seniors Look again at the table of postgraduation plans for the senior class in Exercise 29.a) Find the conditional distributions (percentages) of plans for the white students.b) Find the conditional distributions (percentages) of plans for the minority students.c) Create a graph
Minimum wage workers The U.S. Department of Labor(www.bls.gov) collects data on the number of U.S. workers who are employed at or below the minimum wage. Here is a table showing the number of hourly workers by Age and Sex and the number who were paid at or below the prevailing minimum wage:a) What
Movies 06-15 How have movies changed from 2006 to 2015?Here is a contingency table showing the proportion of movies with each of the MPAA categories in each year:a) Are these column percents or row percents? How can you tell?b) Does it look like things have changed much between 2006 and 2015?Is
Politics and Gender Students in an Intro Stats course were asked to describe their politics as “Liberal,” “Moderate,” or“Conservative.” Here are the results:a) What percent of the class is male?b) What percent of the class considers themselves to be “Conservative”?c) What percent of
Graduate’s plans Many universities survey graduating classes to determine the plans of the graduates. We might wonder whether the plans of students are the same at different schools within a university. Here’s a two-way table for graduates from several schools at one university. Each cell of
A sense of identity The Pew Research survey cited in Exercise 27 also asked what employment sector the respondents worked in and whether their job gave them a sense of identity or whether it was “just what they do for a living.” This table summarizes their responses:a) Is this a table of row
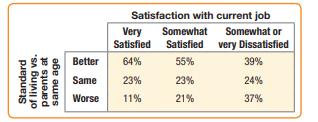
Job satisfaction Pew Research surveyed 5006 U.S. adults to ask their opinions about the state of jobs in the United States in 2016. (pewsocialtrends.org/2016/10/06/the-state-of-american-jobs/)Respondents were asked how satisfied they are with their current job and how their current standard of
Handguns In an effort to reduce the number of gun-related homicides, some cities have run buyback programs in which the police offer cash (often $50) to anyone who turns in an operating handgun. Chance magazine looked at results from a four-year period in Milwaukee. The table below shows what types
Diet and politics IV Here is a mosaic plot of the data on Diet and Politics from Exercise 5 combined with data on Gender.(Data in Student survey)a) Are there more men or women in the survey? Explain briefly.b) Does there appear to be an association between Politics and Gender? Explain briefly.c)
Being successful revisited Here is a mosaic plot of the data on being successful from Exercise 10:a) Are the differences in sample sizes in the four groups very large? Explain briefly.b) Which factor seems more important in determining how someone responded: Age or Gender? Explain briefly.c)
Teen smokers The organization Monitoring the Future (www.monitoringthefuture.org) asked 2048 eighth graders who said they smoked cigarettes what brands they preferred. The table shows brand preferences for two regions of the country. Write a few sentences describing the similarities and differences
College and financial situation improvement The American adults surveyed in Exercise 21 were also asked to rate the financial situations of most Americans along the same categories. The table below summarizes the respondents’ perceived own household financial situation relative to that of most
College and financial well-being In 2019, Pew Research Center conducted a survey of 6878 American adults to ask“How would you describe your household’s financial situation?” Participants were asked to choose one of the following options for their response: “live comfortably,” “meet
Smoking women Look again at the table of smoking prevalence in Exercise 19.a) Compare the smoking rate among 18–24-year-old women to that of men during the time covered by this table.b) Relatively few women over the age of 65 smoke. What other variables might affect this percentage?
Smoking The Centers for Disease Control and Prevention provide data on smoking rates by year and for men and women separately. Here is a table with some of that information:(Data in Smoking by Age and Gender)a) What was the smoking rate among 18–24-year-old men in 1974?b) How has the smoking rate
Cartoons You’ll find a number of cartoons throughout this text. Are they simply entertaining, or will they help with learning? Lawrence M. Lesser, Dennis K. Pearl, and John J.Weber III (Assessing Fun Items’ Effectiveness in Increasing Learning of College Introductory Statistics Students:
Death from the sky A recent article in Geophysical Research Letters (Asteroid impact effects and their immediate hazards for human populations, 10.1002/2017GL073191) simulated the consequences of an earth impact by an asteroid of 400 m in diameter. The writers estimate that for a land impact, 60%
Moviegoers and ethnicity The Motion Picture Association of America studies the ethnicity of moviegoers to understand changes in the demographics of moviegoers over time. Here are the numbers of moviegoers (in millions) classified as Hispanic, African-American, Caucasian, and Other for the year
Poverty and region 2017 In 2017, the following data were reported by the U.S. Census Bureau. The data show the number of people (in thousands) living above and below the poverty line in each of the four regions of the United States. Based on these data, do you think there is an association between
Graphs in the news Find a bar graph or pie chart of categorical data from a newspaper, a magazine, or the Internet.a) Is the graph clearly labeled?b) Does the graph violate the area principle?c) Does the accompanying article tell the W’s of the variable?d) Do you think the article correctly
Tables in the news Find a contingency table of categorical data from a newspaper, a magazine, or the Internet.a) Is it clearly labeled?b) Does it display percentages or counts?c) Does the accompanying article tell the W’s of the variables?d) Do you think the article correctly interprets the
Race and police action The rural village of Williamstown, New York tracked traffic stops and found the following:a) Would column percentages or row percentages be most useful in examining whether there are differences in the treatment of citizens stopped by police?b) Calculate the percentages for
Showing 2900 - 3000
of 4734
First
23
24
25
26
27
28
29
30
31
32
33
34
35
36
37
Last
Step by Step Answers