New Semester
Started
Get
50% OFF
Study Help!
--h --m --s
Claim Now
Question Answers
Textbooks
Find textbooks, questions and answers
Oops, something went wrong!
Change your search query and then try again
S
Books
FREE
Study Help
Expert Questions
Accounting
General Management
Mathematics
Finance
Organizational Behaviour
Law
Physics
Operating System
Management Leadership
Sociology
Programming
Marketing
Database
Computer Network
Economics
Textbooks Solutions
Accounting
Managerial Accounting
Management Leadership
Cost Accounting
Statistics
Business Law
Corporate Finance
Finance
Economics
Auditing
Tutors
Online Tutors
Find a Tutor
Hire a Tutor
Become a Tutor
AI Tutor
AI Study Planner
NEW
Sell Books
Search
Search
Sign In
Register
study help
business
introduction to probability statistics
Introduction To Probability And Statistics 3rd Edition William Mendenhall - Solutions
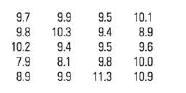
2.66 Basketball Attendances at a high school's basketball games were recorded and found to have a sample mean and variance of 420 and 25, respectively. Calculate xs, 2s, and 3s and then state the approximate fractions of measure- ments you would expect to fall into these intervals according to the
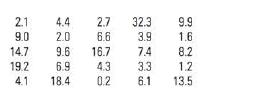
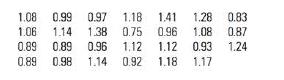
2.65 Polluted Seawater? Petroleum pollution in seas and oceans stimulates the growth of some types of bacteria. A count of petroleumlytic micro-organisms (bacteria per 100 millilitres) in ten portions of seawater gave these readings:a. Guess the value for s using the range approximation.b.
2.64 Fuel Efficiency, continued Refer to Exercise 2.63. Construct a box plot for the data. Are there any outliers? Does this conclusion agree with your results in Exercise 2.63?
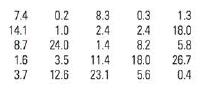
2.63 Fuel Efficiency The litres per 100 km (L/100 km) for each of 20 medium-sized cars, selected from a production line during the month of March, are shown below.a. Construct a relative frequency histogram for these data. How would you describe the shape of the distribution?b. Find the mean and
2.62 Sleep and the University Student How much sleep do you get on a typical school night? A group of 10 university students were asked to report the number of hours that they slept on the previous night with the following results: 7, 6, 7.25, 7, 8.5, 5, 8, 7, 6.75, 6a. Find the mean and the
2.61 Aptitude Tests In contrast to aptitude tests, which are predictive measures of what one can accom- plish with training, achievement tests tell what an individual can do at the time of the test. Mathematics achievement test scores for 400 students were found to have a mean and a variance equal
2.60 Chloroform According to the U.S. Environmental Protection Agency, chloroform, which in its gaseous form is suspected of being a cancer- causing agent, is present in small quantities in all of the 240,000 public water sources in the United States. If the mean and standard deviation of the
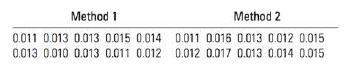
2.59 Electrolysis An analytical chemist wanted to use electrolysis to determine the number of moles of cupric ions in a given volume of solution. The solution was partitioned into n = 30 portions of 0.2 millilitre each, and each of the portions was tested. The average number of moles of cupric ions
2.58 Tuna Fish, again Refer to Exercise 2.8. The prices of a 170-gram can for 14 different brands of water-packed light tuna, based on prices paid nation- ally in supermarkets, are reproduced here. 20a. Calculate the five-number summary.b. Construct a box plot for the data. Are there any
2.57 A Recurring Illness, again Find the median and the lower and upper quartiles for the data on times until recurrence of an illness in Exercise 2.55. Use these descriptive measures to construct a box plot for the data. Use the box plot to describe the data distribution.
2.56 A Recurring Illness, continued Refer to Exercise 2.55.a. Examine the data and count the number of observations that fall into the intervals s, 2s, and 3s.b. Do the percentages that fall into these intervals agree with Tchebysheff's Theorem? With the Empirical Rule?c. Why might the Empirical
2.55 A Recurring Illness Refer to Exercise 1.25 and data set EX0124. The lengths of time (in months) between the onset of a particular illness and its recurrence were recorded:a. Find the range.b. Use the range approximation to find an approximate value for s.c. Compute s for the data and compare
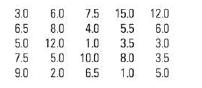
2.54 TV Viewers The number of television viewing hours per household and the prime viewing times are two factors that affect television advertising income. A random sample of 25 house- holds in a particular viewing area produced the fol- lowing estimates of viewing hours per household:a. Scan the
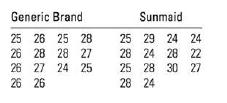
2.53 Raisins The number of raisins in each of 14 miniboxes (15 g) was counted for a generic brand and for Sunmaid brand raisins. The two data sets are shown here:a. What are the mean and standard deviation for the generic brand?b. What are the mean and standard deviation for the Sunmaid brand?c.
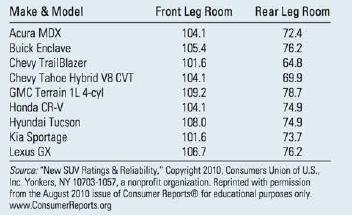
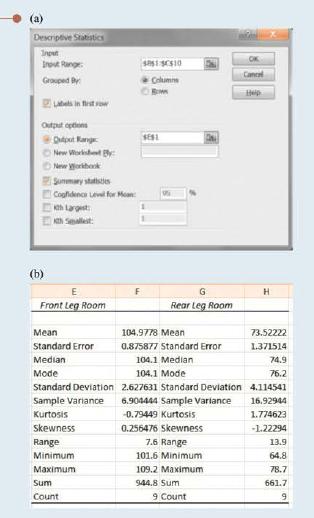
The following data are the front and rear leg rooms (in centimetres) for nine different sports utility vehicles:1. Since the data involve two variables and a third labelling variable, enter the data into the first three columns of an Excel spreadsheet, using the labels in the table. Select Data
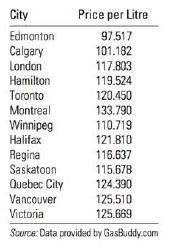
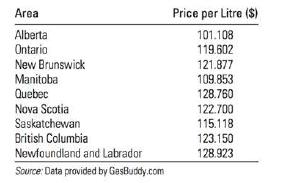
2.52 Who Is Paying More at the Pump? The prices below are for regular gasoline per litre as of December 29, 2011.a. What is the value of the first and third quartiles?b. What is the interquartile range?c. Find the lower fence.d. Find the upper fence.e. Construct a box plot for this data.f. Does the
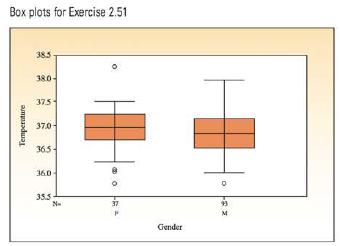
2.51 What's Normal? Refer to Exercise 1.68 and data set EX0168. In addition to the normal body tem- perature in degrees Celsius for the 130 individuals, the data record the gender of the individuals. Box plots for the two groups, male and female, are shown below:How would you describe the
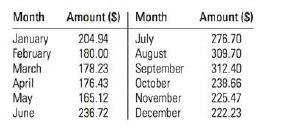
2.50 Utility Bills in Southern Ontario, again The monthly utility bills for a household in Windsor, Ontario, were recorded for 12 consecutive months starting in January 2012:a. Construct a box plot for the monthly utility costs.b. What does the box plot tell you about the distribution of utility
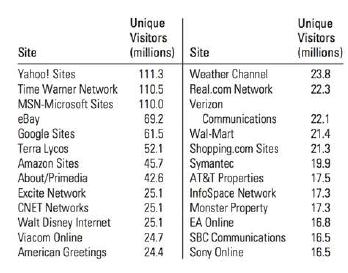
2.49 Internet Hotspots The most visited site on the Internet in 2003 was Yahoo!, which boasted 111,271 thousand unique visitors in December 15. of that year. The number of unique visitors at the top 25 sites are shown in the table:a. Can you tell by looking at the data whether it is roughly
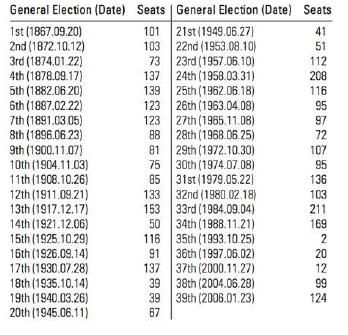
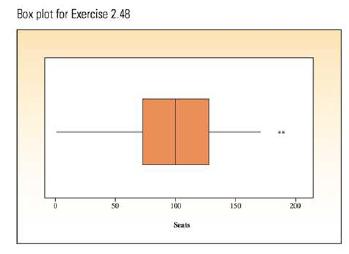
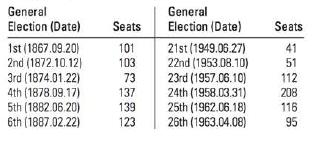
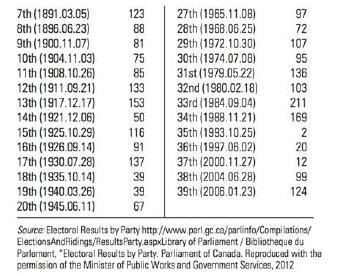
2.48 Canadian Federal Election The data for the seats won by the Conservatives in every election in Canadian history up to 2006 is given in Exercise 1.47 and listed here, along with a box plot generated by MINITAB. Use the box plot to describe the shape of the distribution. General Election (Date)
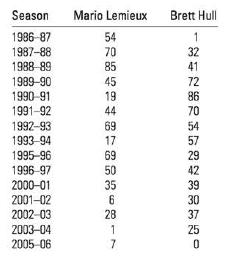
2.47 Comparing NHL Superstars How does Mario Lemieux compare to Brett Hull?The table below shows number of goals scored for each player for selected years.a. Calculate five-number summaries for the number of goals scored by both players.b. Construct box plots for the two sets of data. Are there any
2.46 Packaging Hamburger Meat II The weights (in kilograms) of the 27 packages of ground beef from Exercise 2.24 (see data set EX0224) are listed here in order from smallest to largest:a. Confirm the values of the mean and standard deviation, calculated in Exercise 2.24 as x = 1.05 and s=0.17.b.
2.45 Mercury Concentration in Dolphins Environmental scientists are increasingly concerned with the accumulation of toxic elements in marine mammals and the transfer of such elements to the animals' offspring. The striped dolphin (Stenella coeruleoalba), considered to be the top predator in the
2.44 If you scored at the 69th percentile on a place- ment test, how does your score compare with others?
2.43 Construct a box plot for these data and identify any outliers: 3, 9, 10, 2, 6, 7, 5, 8, 6, 6, 4, 9, 22
2.42 Construct a box plot for these data and identify any outliers: 25, 22, 26, 23, 27, 26, 28, 18, 25, 24, 12
2.41 Find the five-number summary and the IQR for these data: 19, 12, 16, 0, 14, 9, 6, 1, 12, 13, 10, 19, 7, 5, 8
2.40 Given the following data set: 8, 7, 1, 4, 6, 6, 4, 5,7,6,3,0a. Find the five-number summary and the IQR.b. Calculatex and s.c. Calculate the z-score for the smallest and largest observations. Is either of these observations unusually large or unusually small?
As consumers become more careful about the foods they eat, food processors try to stay competitive by avoiding excessive amounts of fat, cholesterol, and sodium in the foods they sell. The following data are the amounts of sodium per slice (in milligrams) for each of eight brands of regular cheese.
Find the lower and upper quartiles for this set of measurements: 16, 25, 4, 18, 11, 13, 20, 8, 11, 9
Suppose you have been notified that your score of 610 on the Verbal Graduate Record Examination placed you at the 60th percentile in the distribution of scores. Where does your score of 610 stand in relation to the scores of others who took the examination?
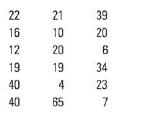
Consider this sample of n = 10 measurements: 1, 1, 0, 15, 2, 3, 4, 0, 1, 3 The measurement x = 15 appears to be unusually large. Calculate the z-score for this observation and state your conclusions.
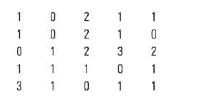
2.39 A Skewed Distribution To illustrate the utility of the Empirical Rule, consider a distribution that is heavily skewed to the right, as shown in the accompanying figure.a. Calculate and s for the data shown. (NOTE: There are 10 zeros, 5 ones, and so on.)b. Construct the intervals s, 2s, and 3s
2.38 International Baccalaureate The International Baccalaureate (IB) program is an accelerated academic program offered at a growing number of high schools throughout the country. Students enrolled in this program are placed in accelerated or advanced courses and must take IB examinations in each
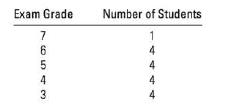
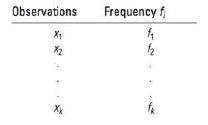
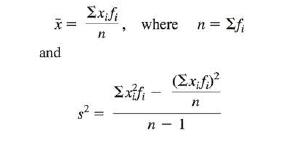
2.37 Suppose that some measurements occur more than once and that the data X1, X2,...,x are arranged in a frequency table as shown here:The formulas for the mean and variance for grouped data areNotice that if each value occurs once, these formulas reduce to those given in the text. Although these
2.36 Who Is Paying More at the Pump? The prices below are for regular gasoline (per litre) as of December 29, 2011.a. Find the standard deviation of these values.b. Find the range R. Compare the range and the standard deviation. Is range related to standard deviation, in any sense?c. Use range to
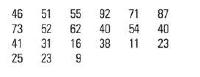
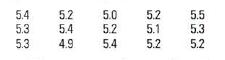
2.35 Wayne Gretzky The number of goals scored by Wayne Gretzky was recorded for seasons 1978-1999.a. Draw a stem and leaf plot to describe the data.b. Calculate the mean and standard deviation for the data.c. What proportion of the measurements lie within two standard deviations of the mean? 46 51
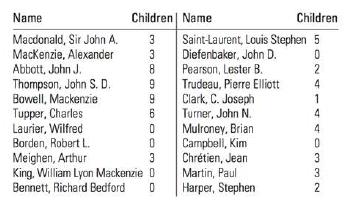
2.34 Prime Minister's Children The table below shows the names of 22 selected prime ministers of Canada along with the number of children in their family.a. Construct a relative frequency histogram to describe the data. How would you describe the shape of this distribution?b. Calculate the mean and
2.33 Old Faithful The data below are 30 waiting times between eruptions of the Old Faithful geyser in Yellowstone National Park.a. Calculate the range.b. Use the range approximation to approximate the standard deviation of these 30 measurements.c. Calculate the sample standard deviations.d. What
2.32 Tuna Fish, again Refer to Exercise 2.8 and data set EX0208. The prices (in dollars) of a 170 g can for 14 different brands of water-packed light tuna, based on prices paid nationally in supermarkets, are reproduced here.a. Use the range approximation to find an estimate of s.b. How does it
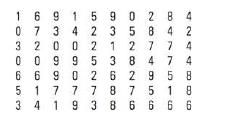
2.31 Timber Tracts To estimate the amount of lumber in a tract of timber, an owner decided to count the number of trees with diameters exceeding 30 cm in randomly selected 15-by-15 m. Seventy 15-by-15 m were chosen, and the selected trees were counted in each tract. The data are listed here:a.
2.30 Survival Times, continued Refer to Exercise 2.29. You can use the Empirical Rule to see why the distribution of survival times could not be mound-shaped.a. Find the value of x that is exactly one standard deviation below the mean.b. If the distribution is in fact mound-shaped, approximately
2.29 Survival Times A group of experimental animals is infected with a particular form of bacteria, and their survival time is found to average 32 days, with a standard deviation of 36 days.a. Visualize the distribution of survival times. Do you think that the distribution is relatively mound-
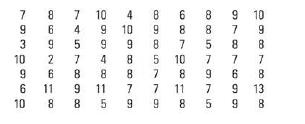
2.28 Social Insurance Numbers, continued Refer to the data set in Exercise 2.27.a. Find the percentage of measurements in the inter- valss, 2s, and 3s.b. How do the percentages obtained in part a compare with those given by the Empirical Rule? Should they be approximately the same? Explain.
2.27 Social Insurance Numbers The data below show the last digit of the social insurance number for a group of 70 students.a. The distribution of this data is relatively "flat," with each different value from 0 to 9 occurring with nearly equal frequency. Using this fact, what would be your best
2.26 Ore Samples A geologist collected 20 different ore samples, all the same weight, and randomly divided them into two groups. She measured the titanium (Ti) content of the samples using two different methods.a. Construct stem and leaf plots for the two data sets. Visually compare their centres
2.25 Breathing Rates Is your breathing rate normal? Actually, there is no standard breathing rate for humans. It can vary from as low as 4 breaths per minute to as high as 70 or 75 for a person engaged in strenuous exercise. Suppose that the resting breathing rates for university-age students have
2.24 Packaging Hamburger Meat The data listed here are the weights (in kilograms) of 27 packages of ground beef in a supermarket meat display:a. Construct a stem and leaf plot or a relative frequency histogram to display the distribution of weights. Is the distribution relatively mound-shaped?b.
2.23 Driving Emergencies The length of time required for an automobile driver to respond to a particular emergency situation was recorded for n = 10 drivers. The times (in seconds) were 0.5, 0.8, 1.1, 0.7. 0.6, 0.9, 0.7, 0.8, 0.7, 0.8.a. Scan the data and use the procedure in Section 2.5 to find an
2.20 Suppose you want to create a mental picture of the relative frequency histogram for a large data set consisting of 1000 observations, and you know that the mean and standard deviation of the data set are 36 and 3, respectively.a. If you are fairly certain that the relative frequency
2.19 A set of n 10 measurements consists of the values 5, 2, 3, 6, 1, 2, 4, 5, 1, 3.a. Use the range approximation to estimate the value of s for this set. (HINT: Use Table 2.6 at the end of Section 2.5.)b. Use your calculator to find the actual value of s. Is the actual value close to your
Use the range approximation to determine an approximate value for the standard devia- tion for the data in Table 2.4.
Use the range approximation to check the calculation of s for Table 2.2.
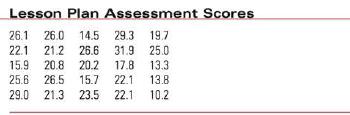
Student teachers are trained to develop lesson plans, on the assumption that the writ- ten plan will help them perform successfully in the classroom. In a study to assess the relationship between written lesson plans and their implementation in the class- room, 25 lesson plans were scored on a
In a time study conducted at a manufacturing plant, the length of time to complete a specified operation is measured for each of n = 40 workers. The mean and standard deviation are found to be 12.8 and 1.7, respectively. Describe the sample data using the Empirical Rule.
The mean and variance of a sample of n = 25 measurements are 75 and 100, respec- tively. Use Tchebysheff's Theorem to describe the distribution of measurements.
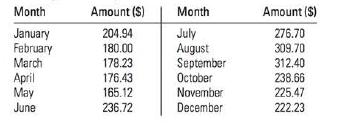
2.18 Utility Bills in Southern Ontario The monthly utility bills for a household in Windsor, Ontario, were recorded for 12 consecutive months starting in January 2012:a. Calculate the range of the utility bills for the year 2012.b. Calculate the average monthly utility bill for the year 2012.c.
2.17 An Archeological Find An article in Archaeometry involved an analysis of 26 samples of Romano-British pottery found at four different kiln sites in the United Kingdom. The samples were analyzed to determine their chemical composition. The percentage of iron oxide in each of five samples
2.17 An Archeological Find An article in Archaeometry involved an analysis of 26 samples of Romano-British pottery found at four different
2.15 You are given n = 8 measurements: 4, 1, 3, 1, 3, 1, 2, 2.a. Find the range.b. Calculate x.c. Calculate s and s using the computing formula.d. Use the data entry method in your calculator to find x, s, and s. Verify that your answers are the same as those in parts b and c.
2.14 You are given n = 5 measurements: 2, 1, 1, 3, 5.a. Calculate the sample mean, X.b. Calculate the sample variance, s, using the formula given by the definition.c. Find the sample standard deviation, s.d. Find s and s using the computing formula. Compare the results with those found in parts b
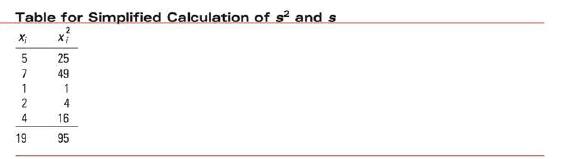
Calculate the variance and standard deviation for the five measurements in Table 2.2, which are 5, 7, 1, 2, 4. Use the computing formula for s and compare your results with those obtained using the original definition of s. Table for Simplified Calculation of s and s 2 x; Xi 57 25 49 1 1 2 4 4 16
2.13 Fighting the Flu Influenza is a highly conta- gious respiratory disease that strikes as many as eight million Canadians in flu season, between October and April. To get an idea of people's preparation for flu season, a sample of 17 family physicians in Ancaster (a township near Hamilton,
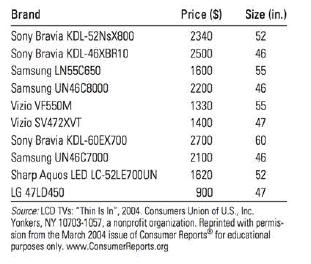
2.12 LCD TVs As technology improves, the choice of televisions becomes more compli- cated. Should you choose an LCD TV, an LED TV, or a plasma TV? In the table below, Consumer Reports gives the prices and screen sizes for the top 10 LCD TVs in the 46-inch and higher categories.a. What is the
2.11 Tim Hortons The number of Tim Hortons shops within 5 kilometres (km) of city centre (downtown) in cities of Southwestern Ontario is shown in the following table.a. Find the mean, the median, and the mode.b. Compare the median and the mean. What can you say about the shape of this
2.10 Time on Task In a psychological experiment, the time on task was recorded for 10 subjects under a 5-minute time constraint. These measurements are in seconds: 175 190 250 230 240 200 185 190 225 265
2.9 Sports Salaries As professional sports teams become a more and more lucrative business for their owners, the salaries paid to the players have also increased. In fact, sports superstars are paid astronomical salaries for their talents. If you were asked by a sports management firm to describe
2.8 Tuna Fish A quick survey gives the price-an estimated average for a 170-gram can-for 14 different brands of water-packed light tuna, based on prices paid nationally in supermarkets:a. Find the average price for the 14 different brands of tuna.b. Find the median price for the 14 different brands
2.7 Birth Order and Personality Does birth order have any effect on a person's personality? A report on a study by an MIT researcher indicates that later-born children are more likely to challenge the establishment, more open to new ideas, and more accepting of change. In fact, the number of
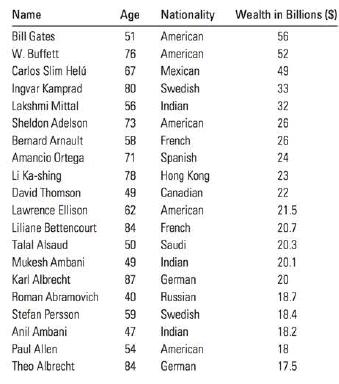
2.6 More Billionaires in 2007 The world has gotten used to having less. But there's one thing the world is getting more of these days, and that's more billionaires. According to the Forbes magazine's editors, the top 20 fortunes when combined would top the half trillion dollar mark.a. Draw a stem
2.5 DVRs The digital video recorder (DVR) player is a common fixture in most Canadian households. In fact, most Canadian households have DVRs, and many have more than one. A sample of 25 households produced the following measurements on x, the number of DVRs in the household:a. Is the distribution
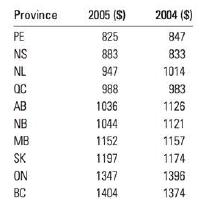
2.4 Auto Insurance The estimated average automobile insurance premiums, 2004-2005, by province, are shown in the following table.'a. What is the average premium for the year 2005?b. What is the average premium for the year 2004?c. If you were a consumer, would you be interested in the average
2.3 You are given n = 10 measurements: 3, 5, 4, 6, 10, 5, 6, 9, 2, 8.a. Calculate x.b. Find m.c. Find the mode.
2.2 You are given n = 8 measurements: 3, 2, 5, 6, 4, 4, 3, 5.a. Find x.b. Find m.c. Based on the results of parts a andb, are the measurements symmetric or skewed? Draw a dotplot to confirm your answer.
2.1 You are given n = 5 measurements: 0, 5, 1, 1, 3.a. Draw a dotplot for the data. (HINT: If two measurements are the same, place one dot above the other.) Guess the approximate "centre."b. Find the mean, median, and mode.c. Locate the three measures of centre on the dotplot in parta. Based on the
For the n = 5 ordered measurements from Example 2.2, the position of the median is 0.5(n+1)=0.5(6) = 3, and the median is the 3rd ordered observation, or m = 6. For the n = 6 ordered measurements from Example 2.3, the position of the median is 0.5(n+1)=0.5(7) = 3.5, and the median is the average of
Find the median for the set of measurements 2, 9, 11, 5, 6, 27.
Find the median for the set of measurements 2, 9, 11, 5, 6.
Draw a dotplot for the n = 5 measurements 2, 9, 11, 5, 6. Find the sample mean and compare its value with what you might consider the "centre" of these observations on the dotplot.
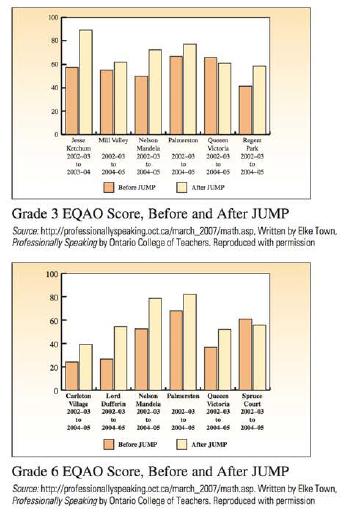
1.44 JUMP and EQAQ Scores Mathematician and award-winning playwright John Mighton started Junior Undiscovered Math Prodigies (JUMP) in 1998. Education Quality and Accountability Office (EQAO) tests are designed to assess a student's ability in reading, writing, and mathematics for Grades 3 and 6 in
1.43 Aqua Running Aqua running has been suggested as a method of cardiovascular con- ditioning for injured athletes and others who want a low-impact aerobics program. A study reported in the Journal of Sports Medicine investigated the rela- tionship between exercise cadence and heart rate by
1.42 Continuous or Discrete, again Identify each variable as continuous or discrete:a. Number of people in line at a supermarket checkout counterb. Depth of a snowfallc. Length of time for a driver to respond when faced with an impending collisiond. Number of aircraft arriving at the Pierre Elliot
1.50 Internet Access from Home As O Canadians become more knowledgeable about computer hardware and software, and as prices drop and installation becomes easier, home networking of PCs is rising. The table gives the number of users per 100 members of the population.a. What graphical methods could
1.45 Ages of Pennies We collected 50 pennies and recorded their ages, by calculating AGE = CURRENT YEAR - YEAR ON PENNY.a. Before drawing any graphs, try to visualize what the distribution of penny ages will look like. Will it be mound-shaped, symmetric, skewed right, or skewed left?b. Draw a
1.46 Ages of Pennies, continued The data below represent the ages of a different set of 50 pennies, again calculated using AGE = CURRENT YEAR - YEAR ON PENNY.a. Draw a relative frequency histogram to describe the distribution of penny ages. Is the shape similar to the shape of the relative
1.47 Canadian Federal Election The data below shows the seats won by the Conservatives in every election in Canadian history up to 2006.12 Use an appropriate graph to describe the number of seats won by Conservatives. Write a sum- mary paragraph describing this set of data. General General Election
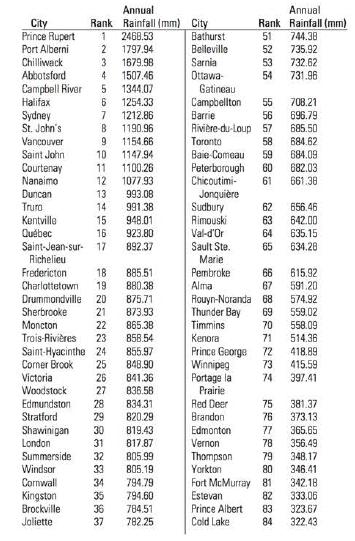
1.48 Wettest Cities Are some cities wetter than others? Does Vancouver deserve to be nicknamed "The Wettest City"? These data are the average rainfall in millimetres (mm) for 100 selected cities in the Canada:13a. Construct a relative frequency histogram for the data. (HINT: Choose the class
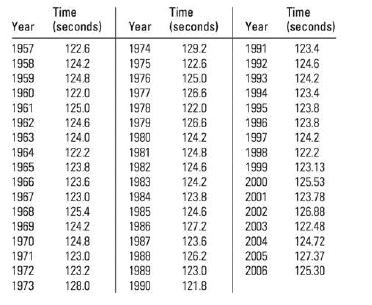
1.49 Queen's Plate Finish Times History was made at Woodbine (Toronto) as Dancethruthedawn captured the 142nd edition of the Queen's Plate Stakes. The royalty bred daughter of 1991 champion Dance Smartly emulated her dam's feat by winning both the Woodbine Oaks and the Queen's Plate. The following
1.41 Continuous or Discrete, again Identify each variable as continuous or discrete:a. Weight of two dozen shrimpb. A person's body temperaturec. Number of people waiting for treatment at a hospital emergency roomd. Number of properties for sale by a real estate agencye. Number of claims received
1.40 Continuous or Discrete? Identify each variable as continuous or discrete:a. Number of homicides in Vancouver during a one- month periodb. Length of time between arrivals at an outpatient clinicc. Number of typing errors on a page of manuscriptd. Number of defective lightbulbs in a package con-
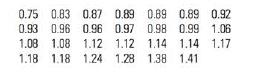
1.31 Calcium Content The calcium (Ca) content of a powdered mineral substance was analyzed ten times with the following percent compositions recorded:a. Draw a dotplot to describe the data. (HINT: The scale of the horizontal axis should range from 0.0260 to 0.0290.)b. Draw a stem and leaf plot for
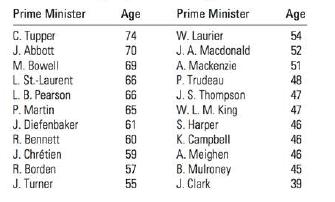
1.32 Canadian Prime Ministers by Age This is a list of prime ministers of Canada since Confederation in 1867, arranged in descending order of their age upon first taking office.a. Before you graph the data, try to visualize the dis- tribution of the ages for the prime ministers. What shape do you
1.33 RBC Counts The red blood cell count of a healthy person was measured on each of 15 days. The number recorded is measured in 10 cells per microlitre (L).a. Use an appropriate graph to describe the data.b. Describe the shape and location of the red blood cell counts.c. If the person's red blood
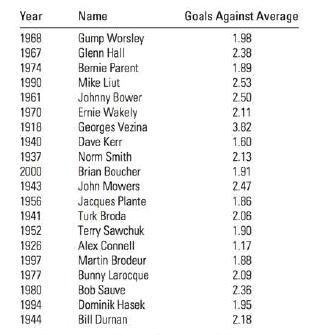
1.34 NHL Goals Against Average Leaders Average determined by games played through 1942-43 season and by minutes played since then. A sample of goals against average leaders is listed in the table.6a. Construct a relative frequency histogram to describe the Goals Against Average for these 20
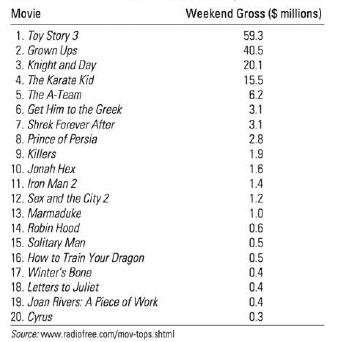
1.35 Top 20 Movies The table that follows shows the weekend gross ticket sales for the top 20 movies for the weekend of June 25, 2010:a. Draw a stem and leaf plot for the data. Describe the shape of the distribution. Are there any outliers?b. Construct a dotplot for the data. Which of the two
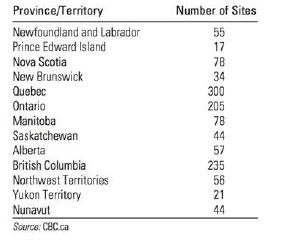
1.36 Contaminated Waste Sites (in 2002) Peggy's Cove Lighthouse is among 1200 contaminated federal sites. Environmentalists are upset following the publication of a national inventory of contaminated sites on federal land. There are more than 1200 sites with contamination ranging from oil spills to
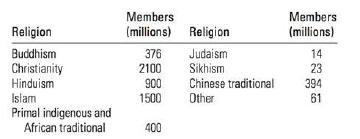
1.37 Organized Religion Statistics of the world's religions are only very rough approximations, since many religions do not keep track of their membership numbers. An estimate of these numbers (in millions) is shown in the table."a. Construct a pie chart to describe the total member- ship in the
1.38 Quantitative or Qualitative? Identify each variable as quantitative or qualitative:a. Ethnic origin of a candidate for public officeb. Score (0-100) on a placement examinationc. Fast-food establishment preferred by a student (McDonald's, Burger King, or Subway)d. Mercury concentration in a
1.39 Symmetric or Skewed? Do you expect the distributions of the following variables to be symmetric or skewed? Explain.a. Size in dollars of nonsecured loansb. Size in dollars of secured loansc. Price of a 250-gram can of peasd. Height in centimetres of first-year women at your universitye. Number
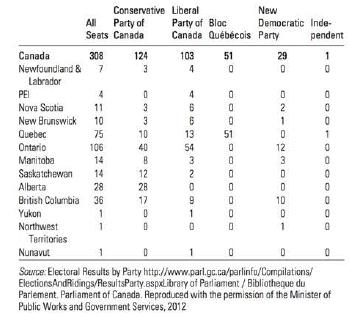
1.51 Election Results The 2006 election was EX0151 somewhat an interesting race, in which the Conservative Party of Canada secured the largest number of House of Commons seats with respect to others. The table below lists the distribution of House of Commons seats following the 39th general
Showing 5100 - 5200
of 7136
First
45
46
47
48
49
50
51
52
53
54
55
56
57
58
59
Last
Step by Step Answers