New Semester
Started
Get
50% OFF
Study Help!
--h --m --s
Claim Now
Question Answers
Textbooks
Find textbooks, questions and answers
Oops, something went wrong!
Change your search query and then try again
S
Books
FREE
Study Help
Expert Questions
Accounting
General Management
Mathematics
Finance
Organizational Behaviour
Law
Physics
Operating System
Management Leadership
Sociology
Programming
Marketing
Database
Computer Network
Economics
Textbooks Solutions
Accounting
Managerial Accounting
Management Leadership
Cost Accounting
Statistics
Business Law
Corporate Finance
Finance
Economics
Auditing
Tutors
Online Tutors
Find a Tutor
Hire a Tutor
Become a Tutor
AI Tutor
AI Study Planner
NEW
Sell Books
Search
Search
Sign In
Register
study help
business
nonparametric statistical inference
Statistical Reasoning For Everyday Life 4th Edition Jeffrey Bennett - Solutions
interpreting P-Values. Assume that you are testing an alternative hypothesis of the form Ha: m 6 claimed value. If the sample mean has a standard score of z = 0.5, what do you conclude? Why is it not necessary to actually conduct the formal hypothesis test?Hypothesis Tests for Means. For Exercises
interpreting P-Values. Assume that you are testing an alternative hypothesis of the form Ha: m 7 claimed value.If the sample mean has a standard score of z = -1.0, what do you conclude? Why is it not necessary to actually conduct the formal hypothesis test?
z = 3.5 for Ha: m ≠ 1,022 find the value of the standard score, z, and determine whether the alternative hypothesis is supported at a 0.05 significance level.use a standard score table to find the P-value that corresponds to the standard z-score, and determine whether the alternative hypothesis
z = 0.15 for Ha: m ≠ 90.3 find the value of the standard score, z, and determine whether the alternative hypothesis is supported at a 0.05 significance level.use a standard score table to find the P-value that corresponds to the standard z-score, and determine whether the alternative hypothesis
z = -1.1 for Ha: m 6 149.6 find the value of the standard score, z, and determine whether the alternative hypothesis is supported at a 0.05 significance level.use a standard score table to find the P-value that corresponds to the standard z-score, and determine whether the alternative hypothesis is
z = -2.1 for Ha: m 6 1,007 find the value of the standard score, z, and determine whether the alternative hypothesis is supported at a 0.05 significance level.use a standard score table to find the P-value that corresponds to the standard z-score, and determine whether the alternative hypothesis is
z = 3.5 for Ha: m 7 75 find the value of the standard score, z, and determine whether the alternative hypothesis is supported at a 0.05 significance level.use a standard score table to find the P-value that corresponds to the standard z-score, and determine whether the alternative hypothesis is
z = 2.7 for Ha: m 7 19.4 find the value of the standard score, z, and determine whether the alternative hypothesis is supported at a 0.05 significance level.use a standard score table to find the P-value that corresponds to the standard z-score, and determine whether the alternative hypothesis is
z = 1.9 for Ha: m ≠ 25.7 find the value of the standard score, z, and determine whether the alternative hypothesis is supported at a 0.05 significance level.use a standard score table to find the P-value that corresponds to the standard z-score, and determine whether the alternative hypothesis is
z = 1.7 for Ha: m ≠ 75 find the value of the standard score, z, and determine whether the alternative hypothesis is supported at a 0.05 significance level.use a standard score table to find the P-value that corresponds to the standard z-score, and determine whether the alternative hypothesis is
z = -2.0 for Ha: m ≠ 172 find the value of the standard score, z, and determine whether the alternative hypothesis is supported at a 0.05 significance level.use a standard score table to find the P-value that corresponds to the standard z-score, and determine whether the alternative hypothesis is
z = -1.6 for Ha: m ≠ 0.389 find the value of the standard score, z, and determine whether the alternative hypothesis is supported at a 0.05 significance level.use a standard score table to find the P-value that corresponds to the standard z-score, and determine whether the alternative hypothesis
z = 1.5 for Ha: m 7 0.227 find the value of the standard score, z, and determine whether the alternative hypothesis is supported at a 0.05 significance level.use a standard score table to find the P-value that corresponds to the standard z-score, and determine whether the alternative hypothesis is
z = 1.9 for Ha: m 7 36.35 find the value of the standard score, z, and determine whether the alternative hypothesis is supported at a 0.05 significance level.use a standard score table to find the P-value that corresponds to the standard z-score, and determine whether the alternative hypothesis is
z = -2.4 for Ha: m 6 727 find the value of the standard score, z, and determine whether the alternative hypothesis is supported at a 0.05 significance level.use a standard score table to find the P-value that corresponds to the standard z-score, and determine whether the alternative hypothesis is
z = -0.4 for Ha: m 6 25 find the value of the standard score, z, and determine whether the alternative hypothesis is supported at a 0.05 significance level.use a standard score table to find the P-value that corresponds to the standard z-score, and determine whether the alternative hypothesis is
Ha: m ≠ 877, n = 90, x = 921, s = 52.find the value of the standard score, z, and determine whether the alternative hypothesis is supported at a 0.05 significance level.
Ha: m ≠ 0.88, n = 50, x = 0.75, s = 0.18.find the value of the standard score, z, and determine whether the alternative hypothesis is supported at a 0.05 significance level.
Ha: m ≠ 156.2, n = 225, x = 155.5, s = 29.find the value of the standard score, z, and determine whether the alternative hypothesis is supported at a 0.05 significance level.
Ha: m ≠ 2.55, n = 100, x = 2.58, s = 0.29.find the value of the standard score, z, and determine whether the alternative hypothesis is supported at a 0.05 significance level.
Ha: m 7 1007, n = 225, x = 1021, s = 35.find the value of the standard score, z, and determine whether the alternative hypothesis is supported at a 0.05 significance level.
Ha: m 7 12, n = 64, x = 14, s = 2.find the value of the standard score, z, and determine whether the alternative hypothesis is supported at a 0.05 significance level.
Ha: m 6 75, n = 36, x = 72, s = 15.find the value of the standard score, z, and determine whether the alternative hypothesis is supported at a 0.05 significance level.
Ha: m 6 75, n = 100, x = 70, s = 15.find the value of the standard score, z, and determine whether the alternative hypothesis is supported at a 0.05 significance level.
Mnemonic. A handy mnemonic for interpreting the Pvalue in a hypothesis test is this: “If the P (value) is low, then the null must go.”decide whether the statement makes sense (or is clearly true) or does not make sense(or is clearly false). Explain clearly. Not all of these statements have
significance level. Because the significance level is the probability of making a type I error, it is wise to select a significance level of zero so that there is no probability of making that error.decide whether the statement makes sense (or is clearly true) or does not make sense(or is clearly
Type i Error. When a consumer group is testing the claim that the mean amount of aspirin in tablets is 350 milligrams, it is extremely important not to reject a true null hypothesis wrongly. Thus, it is better to choose 0.01 than 0.05 for the significance level.decide whether the statement makes
significance. A significance level of 0.05 indicates that the probability of making a type I error is 0.05.
Alternative Hypothesis. In testing the claim that the mean IQ score of statistics students is greater than 100, the alternative hypothesis is expressed as m 7 100.decide whether the statement makes sense (or is clearly true) or does not make sense(or is clearly false). Explain clearly. Not all of
P-Value. In a hypothesis test, a P-value of 0.001 indicates that you should support the alternative hypothesis.decide whether the statement makes sense (or is clearly true) or does not make sense(or is clearly false). Explain clearly. Not all of these statements have definitive answers, so your
P-Value. In testing a claim about a population mean, a larger z test statistic always results in a larger P-value.decide whether the statement makes sense (or is clearly true) or does not make sense(or is clearly false). Explain clearly. Not all of these statements have definitive answers, so your
Hypothesis Test. In hypothesis tests, the P-value is always the same as the significance level.decide whether the statement makes sense (or is clearly true) or does not make sense(or is clearly false). Explain clearly. Not all of these statements have definitive answers, so your explanation is more
statistical significance. Consider a test of the claim that with a new device installed, the mean fuel consumption of cars is reduced by 0.08 miles per gallon. The resulting P-value is 0.009. Is the mean fuel consumption reduction statistically significant? Does the mean fuel consumption reduction
Types of Errors. What is a type I error? What is a type II error?
Waiting Times. A student in a statistics class conducts a project designed to test the claim that wait times at McDonald’s drive-up windows have a mean that is less than 5 minutes. She collects sample data from wait times at five randomly selected McDonald’s locations that are within 30 miles
notation. Briefly describe what each of the variables n, x, s, s, and m represent in hypothesis tests of a claim made about a population mean.
Hypothesis Testing in the news. Find a news article or research report that describes (perhaps not explicitly) a hypothesis test for a population mean or proportion. Attach the article and summarize the method used.
coin Activity. Select a particular quarter and test the claim that it favors heads when flipped. State the null and alternative hypotheses; then flip the quarter 100 times. Applying only common sense, what do you conclude about the claim that the quarter favors heads?
Professional journals. Many professional journals, such as Journal of the American Medical Association, contain articles that include information about formal tests of hypotheses. Find such an article and identify the null hypothesis and alternative hypothesis. In simple terms, state the objective
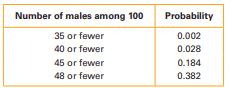
A random sample of 100 births has 32 male babies. Is this result significant at the 0.01 level? What is the P-value for this result?Assume that male births and female births are equally likely. The following table shows the probabilities of various numbers of male babies in a random sample of 100
A random sample of 100 births has 35 male babies. Is this result significant at the 0.01 level? What is the P-value for this result?Assume that male births and female births are equally likely. The following table shows the probabilities of various numbers of male babies in a random sample of 100
A random sample of 100 births has 40 male babies. Is this result significant at the 0.05 level? What is the P-value for this result?Assume that male births and female births are equally likely. The following table shows the probabilities of various numbers of male babies in a random sample of 100
A random sample of 100 births has 40 male babies. Is this result significant at the 0.01 level? What is the P-value for this result?Assume that male births and female births are equally likely. The following table shows the probabilities of various numbers of male babies in a random sample of 100
A random sample of 100 births has 45 male babies. Is this result significant at the 0.01 level? What is the P-value for this result?Assume that male births and female births are equally likely. The following table shows the probabilities of various numbers of male babies in a random sample of 100
A random sample of 100 births has 48 male babies. Is this result significant at the 0.05 level? What is the P-value for this result?Assume that male births and female births are equally likely. The following table shows the probabilities of various numbers of male babies in a random sample of 100
smoking. An educator claims that less than 20% of college graduates smoke.formulate the null and alternative hypotheses for a hypothesis test. State clearly the two possible conclusions that address the given claim.
Holocaust. A high school teacher claims that the majority of her students do not know what the term Holocaust refers to.formulate the null and alternative hypotheses for a hypothesis test. State clearly the two possible conclusions that address the given claim.
Aspirin. The Food and Drug Administration claims that a pharmaceutical company is producing aspirin tablets with a mean amount of aspirin that is less than 350 milligrams.formulate the null and alternative hypotheses for a hypothesis test. State clearly the two possible conclusions that address the
Vending Machines. A sales representative claims that her vending machines dispense coffee so that the mean amount supplied is equal to 10 ounces.formulate the null and alternative hypotheses for a hypothesis test. State clearly the two possible conclusions that address the given claim.
Quality control. The quality control manager at a manufacturing company claims that the proportion of defective carbon monoxide detectors is less than 0.04.formulate the null and alternative hypotheses for a hypothesis test. State clearly the two possible conclusions that address the given claim.
gender selection. The Chief Operations Officer of a medical facility claims that treatments can increase the probability that a baby will be a girl so that the proportion of girls is greater than 0.7.formulate the null and alternative hypotheses for a hypothesis test. State clearly the two possible
sAT scores. A high school principal claims that the mean SAT score of seniors at his school is less than the national average of 1518.formulate the null and alternative hypotheses for a hypothesis test. State clearly the two possible conclusions that address the given claim.
calories. Package labeling indicates that Twix candy bars have an amount of caloric content equal to 250 calories.formulate the null and alternative hypotheses for a hypothesis test. State clearly the two possible conclusions that address the given claim.
What is significant? In testing a method of gender selection, 200 couples are given a treatment designed to increase the likelihood of a girl, and each couple has one baby.a. If the 200 babies include exactly 130 girls, would you consider this result statistically significant or would you attribute
What is significant? In testing a method of gender selection, 40 couples are given a treatment designed to increase the likelihood of a girl, and each couple has one baby.a. If the 40 babies include exactly 22 girls, would you consider this result statistically significant or would you attribute it
P-Value. In interpreting a P-value of 0.001, a researcher states that the results are statistically significant because the P-value is very small, indicating that the results are not likely to occur by chance.decide whether the statement makes sense (or is clearly true) or does not make sense (or
P-Value. In interpreting a P-value of 0.45, a researcher states that the results are statistically significant because the P-value is less than 0.5, indicating that the results are not likely to occur by chance.decide whether the statement makes sense (or is clearly true) or does not make sense (or
sample Mean. A study is designed to determine the proportion of men who weigh more than 195 pounds, so the null hypothesis is m = 195 pounds and the alternative hypothesis is m 7 195 pounds.decide whether the statement makes sense (or is clearly true) or does not make sense (or is clearly false).
drug Treatment. In a test of the claim that, among patients treated with Ziac, the proportion who experience dizziness is less than 0.06, the null hypothesis is p = 0.06.decide whether the statement makes sense (or is clearly true) or does not make sense (or is clearly false). Explain clearly. Not
null Hypothesis. After conducting a hypothesis test, a researcher concludes that there is sufficient sample evidence to support the null hypothesis that m = 75.
null Hypothesis. In testing a claim that the mean LDL cholesterol level is less than 130 mg/dL, the researcher states the alternative hypothesis as m 6 130 mg/dL.decide whether the statement makes sense (or is clearly true) or does not make sense (or is clearly false). Explain clearly. Not all of
P-Value. A researcher is convinced that she can show that a new drug is effective in lowering LDL cholesterol. She claims that the P-value of 0.20 supports her claim of a lower mean level of LDL cholesterol.decide whether the statement makes sense (or is clearly true) or does not make sense (or is
interpreting a Hypothesis Test. To test the claim that a particular drug lowers blood pressure, sample data are collected and a hypothesis test is used, and we form this conclusion:“The study proves that the drug lowers blood pressure in everyone.”decide whether the statement makes sense (or is
P-Value. What is a P-value for a hypothesis test?
Alternative Hypotheses. A researcher wants to test the claim that the mean weight of male airline passengers, including carry-on baggage, is 195 lb. Identify the three different possible expressions that could be used for the alternative hypothesis.
Hypotheses. What is a null hypothesis? What notation is used for a null hypothesis? What is an alternative hypothesis? What notation is used for an alternative hypothesis?
Hypothesis Test. What is a hypothesis test?
Suggest another discipline, besides biology and literature, in which the ideas described in this Focus could be used to estimate an unknown quantity.
Based on Graunt’s tables, estimate the average life expectancy in 1660. Explain your reasoning.
Assuming that the estimates of deaths in Table 5 are accurate, are the estimates of survivors in Table 6 consistent? Note that the numbers in Table 6 do not total to 100;should they? Explain.
Is it surprising that accurate estimates of the population of London were not available in 1660? How would you have suggested making such estimates at that time?
Identify what is wrong with this 95% confidence interval for the population proportion: 0.950 6 p 6 1.250.
When a 95% confidence interval is constructed for the population proportion, a sample proportion is found to be 0.720 and the margin of error is found to be 0.025. Identify the 95% confidence interval.
When a 95% confidence interval is constructed for the population mean, a sample mean is found to be 69.6 and the margin of error is found to be 1.2. Identify the 95%confidence interval.
Find the margin of error corresponding to this 95% confidence interval: 98.0 6 m 6 98.6.
Find the margin of error corresponding to this 95%confidence interval: 0.440 6 p 6 0.500.
Assume that we want to estimate the mean grip strength of adult males in the United States. If a random sample of grip strengths is obtained, which of the following is the best estimate of the population mean?a. Median of the sampleb. Mean of the samplec. Standard deviation of the sampled. Range of
A journal article provides a confidence interval for a proportion in the format 0.60 { 0.08. Express this confidence interval in the format a 6 p 6b. (That is, rewrite a 6 p 6 b using specific values in place of a and b.)
What does the notation pn represent?
If many different random samples of size 500 are selected from the population of college students, what is the shape of the distribution of the proportions of women?
If many different random samples of size 100 are selected from the population of pulse rates of adult women, what is the shape of the distribution of the sample means?
We want to estimate the mean IQ score on the StanfordBinet test for the population of college students. We know that for people randomly selected from the general population, the standard deviation of IQ scores on the StanfordBinet test is 16.a. Using a standard deviation of 16, how many college
Estimating Population Proportions. Find a news article or report in which a population proportion is estimated from a sample. The article should include a margin of error and/or a confidence interval. Discuss the methods used in the study and how the conclusions were reached.
network Polls. All of the major television networks conduct regular polls on a variety of issues. Visit the Web sites of the major networks and gather the results of a particular poll that involves estimation of a population proportion. Be sure to include all information that is given about the
nielsen Methods. Visit the Nielsen Media Research Web site and report on the actual methods used to estimate population proportions and confidence intervals in Nielsen ratings.
Who’s the vice President? Assume that you want to estimate the proportion of students at your college who can correctly identify the Vice President of the United States.How many students must you randomly select in order to be 95% confident that your sample proportion is within 0.1 of the
concealed Weapons. Two-thirds (or 66.6%) of 626 Colorado residents polled by Talmey-Drake Research & Strategy Inc.said they backed a bill pending in the legislature that would standardize laws on granting concealed-weapon permits to gun owners. The bill would force local law enforcement to grant
opinion Poll. A poll finds that 54% of the population approves of the job that the President is doing; the poll has a margin of error of 4% (assuming a 95% degree of confidence).a. What is the 95% confidence interval for the true population percentage that approves of the President’s
unemployment Survey. The Bureau of Labor Statistics estimates the unemployment rate in the United States monthly by surveying 60,000 individuals.a. In one month, 3.4% of the 60,000 individuals surveyed are found to be unemployed. Find the margin of error for this estimate. Is the precision (nearest
Pre-Election Polls. Prior to a statewide election for the U.S. Senate, three polls are conducted. In the first poll, 780 of 1,500 voters favor candidate Martinez. In the second poll, 1,285 of 2,500 voters favor Martinez. In the third poll, 1,802 of 3,500 voters favor Martinez. Find the
Teen Pressure. A study commissioned by the U.S.Department of Education concluded that 44% of teenagers cite grades as their greatest source of pressure. The study was based on responses from 1,015 teenagers. What is the 95% confidence interval?
Drugs in Movies. A study by Stanford University researchers for the Office of National Drug Control Policy and the Department of Health and Human Services concluded that 98% of the top rental films involve drugs, drinking, or smoking. Assume that this study is based on the top 400 rental films.a.
global Warming. A Pew Research Center poll included 1708 randomly selected adults who were asked whether“global warming is a problem that requires immediate government action.” Results showed that 939 of those surveyed indicated that immediate government action is required.A news reporter wants
gender Selection. The Genetics and IVF Institute conducted clinical trials of the YSORT method designed to increase the probability of conceiving a boy. Among 152 babies born to parents using the YSORT method, 127 were boys. Identify the margin of error and the 95% confidence interval for these
Student opinions. An annual survey of first-year college students, conducted by the Higher Education Research Institute at UCLA, asks approximately 276,000 students about their attitudes on a variety of subjects. According to a recent survey, 51% of first-year students believe that abortion should
Hazing of athletes. A study done by researchers at Alfred University concluded that 80% of all student athletes in this country have been subjected to some form of hazing. The study is based on responses from 1,400 athletes. What are the margin of error and 95% confidence interval for the study?
nielsen ratings. Repeat Exercise 17 assuming that the sample size is doubled to 10,000. Given that the large cost and effort of conducting the Nielsen survey would be doubled, does this increase in sample size appear to be justified by the increased reliability?
nielsen ratings. Nielsen Media Research uses samples of 5,000 households to rank TV shows. Nielsen reported that 60 Minutes had 15% of the TV audience. What is the 95%confidence interval for this result?
E = 0.035 estimate the minimum sample size needed to achieve the given margin of error.
E = 0.015 estimate the minimum sample size needed to achieve the given margin of error.
Showing 1400 - 1500
of 5397
First
8
9
10
11
12
13
14
15
16
17
18
19
20
21
22
Last
Step by Step Answers