New Semester
Started
Get
50% OFF
Study Help!
--h --m --s
Claim Now
Question Answers
Textbooks
Find textbooks, questions and answers
Oops, something went wrong!
Change your search query and then try again
S
Books
FREE
Study Help
Expert Questions
Accounting
General Management
Mathematics
Finance
Organizational Behaviour
Law
Physics
Operating System
Management Leadership
Sociology
Programming
Marketing
Database
Computer Network
Economics
Textbooks Solutions
Accounting
Managerial Accounting
Management Leadership
Cost Accounting
Statistics
Business Law
Corporate Finance
Finance
Economics
Auditing
Tutors
Online Tutors
Find a Tutor
Hire a Tutor
Become a Tutor
AI Tutor
AI Study Planner
NEW
Sell Books
Search
Search
Sign In
Register
study help
business
nonparametric statistical inference
Statistical Reasoning For Everyday Life 4th Edition Jeffrey Bennett - Solutions
Scatterplot. One set of paired data results in r = 1 and a second set of paired data results in r = -1. How do the corresponding scatterplots differ?
Correlation. After computing the correlation coefficient r from 50 pairs of data, you find that r = 0.Does it follow that there is no relationship between the two variables?Why or why not?
Scatterplot. What is a scatterplot, and how does it help us investigate correlation?
Discuss a few other ways DNA tests can be useful, such as in settling issues of paternity. Overall, how much do you think DNA evidence affects our society?
The Innocence Project uses DNA to try to clear suspects wrongfully convicted of crimes. Is innocence easier to establish than guilt through DNA testing? Explain.
Evidence from blood tests can identify a suspect with a probability of about 1 in 200.Evidence from DNA tests often provides probabilities claimed to be on the order of 1 in 10 million. If you were a juror, would you accept such a probability as positive identification of a suspect?
Suppose that an allele has a greater frequency in a suspect’s subpopulation than in the full population, but that the suspect is compared to the full population. How would this affect the probability of a match between the suspect and a DNA sample from the crime scene?
The result of a DNA test is considered physical (as opposed to circumstantial) evidence. Yet it is much more sophisticated and difficult to understand than a typical piece of physical evidence, such as a weapon or a piece of clothing. Some people have therefore argued that DNA evidence should not
An anonymous quote circulated on the Internet read“Lotteries are a tax on people who are bad at math.”Comment on the meaning and accuracy of this quote.
Considering all factors presented in this section and other facts that you can find, do you think lotteries are fair to poor or uneducated people? Should they remain legal?Should they be restricted in any way?
Find and study a particular lottery advertisement, and determine whether it is misleading in any way.
Based on the more than $50 billion in total annual lottery spending and the current U.S. population, about how much does the average person spend on the lottery each year? Now, using the statistics in Figure 14 to estimate the percentage of the population that plays the lottery, about how much does
Study Figure 14.Do lottery players appear to be a typical cross-section of American society based on age? Based on income? Based on level of education?Explain. How does the “no response” category affect these conclusions?
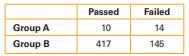
Find the probability of getting someone who passed, given that the selected person is in Group A.use the following results:In the judicial case of United States v. City of Chicago, discrimination was charged in a qualifying exam for the position of fire captain. In the table below, Group A is a
Find the probability of randomly selecting one of the test subjects and getting someone who is in Group A and passed the exam.use the following results:In the judicial case of United States v. City of Chicago, discrimination was charged in a qualifying exam for the position of fire captain. In the
Find the probability of randomly selecting two different test subjects and finding that they are both in Group A.use the following results:In the judicial case of United States v. City of Chicago, discrimination was charged in a qualifying exam for the position of fire captain. In the table below,
Find the probability of randomly selecting one of the test subjects and getting someone who is in Group B or passed.use the following results:In the judicial case of United States v. City of Chicago, discrimination was charged in a qualifying exam for the position of fire captain. In the table
If one of the test subjects is randomly selected, find the probability of getting someone who passed the exam.use the following results:In the judicial case of United States v. City of Chicago, discrimination was charged in a qualifying exam for the position of fire captain. In the table below,
If P(A) = 0.4, what is the value of P(A)?
When conducting a clinical trial of the effectiveness of a gender selection method, it is found that there is a 0.342 probability that the results could have occurred by chance.Does the method appear to be effective?
Estimate the probability that a randomly selected prime-time television show will be interrupted with a news bulletin.
For the same handicapper described in Exercise 1, find the probability that she is correct in each of her next two predictions.
A Las Vegas handicapper can correctly predict the winning professional football team 70% of the time. What is the probability that she is wrong in her next prediction?
For a recent year, the fatality rate from motor vehicle crashes was reported as 15.2 per 100,000 population.a. What is the probability that a randomly selected person will die this year as a result of a motor vehicle crash?b. If two people are randomly selected, find the probability that they both
The Binary Computer Company manufactures computer chips used in DVD players. Those chips are made with a 27% yield, meaning that 27% of them are good and the others are defective.a. If one chip is randomly selected, find the probability that it is not good.b. If two chips are randomly selected,
Use subjective probability to estimate the probability of randomly selecting a car and selecting one that is black.
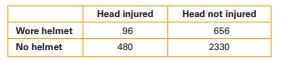
If one of the subjects is randomly selected, find the probability of selecting someone who did not wear a helmet, given that the subject had head injuries.use the data in the accompanying table (based on data from “Helmet Use and Risk of Head Injuries in Alpine Skiers and Snowboarders” by
If two different study subjects are randomly selected, find the probability that they both wore helmets.use the data in the accompanying table (based on data from “Helmet Use and Risk of Head Injuries in Alpine Skiers and Snowboarders” by Sullheim et al., Journal of the American Medical
If one of the subjects is randomly selected, find the probability of selecting someone who did not wear a helmet and was not injured.use the data in the accompanying table (based on data from “Helmet Use and Risk of Head Injuries in Alpine Skiers and Snowboarders” by Sullheim et al., Journal of
If one of the subjects is randomly selected, find the probability of selecting someone who wore a helmet and was injured.use the data in the accompanying table (based on data from “Helmet Use and Risk of Head Injuries in Alpine Skiers and Snowboarders” by Sullheim et al., Journal of the
If one of the subjects is randomly selected, find the probability of selecting someone who did not wear a helmet or was not injured.use the data in the accompanying table (based on data from “Helmet Use and Risk of Head Injuries in Alpine Skiers and Snowboarders” by Sullheim et al., Journal of
If one of the subjects is randomly selected, find the probability of selecting someone who had a head injury or wore a helmet.use the data in the accompanying table (based on data from “Helmet Use and Risk of Head Injuries in Alpine Skiers and Snowboarders” by Sullheim et al., Journal of the
If one of the subjects is randomly selected, find the probability of selecting someone with a head injury.use the data in the accompanying table (based on data from “Helmet Use and Risk of Head Injuries in Alpine Skiers and Snowboarders” by Sullheim et al., Journal of the American Medical
A columnist for the New York Daily News (Stephen Allensworth) provided tips for selecting numbers in New York State’s lottery. He advocated a system based on the use of “cold digits,” which are digits that hit once or not at all in a seven-day period. He made this statement: “That [system]
Simulation. A classic probability problem involves a king who wants to increase the proportion of women in his kingdom. He decrees that after a mother gives birth to a son, she is prohibited from having any more children. The king reasons that some families will have just one boy whereas other
hIV among College Students. Suppose that 3% of the students at a particular college are known to carry HIV.a. If a student has 6 sexual partners during the course of a year, what is the probability that at least one of them carries HIV?b. If a student has 12 sexual partners during the course of a
The Bets of the Chevalier de mère. It is said that probability theory was invented in the 17th century to explain the gambling of a nobleman named the Chevalier de Mère.a. In his first game, the Chevalier bet on rolling at least one 6 with four rolls of a fair die. If played repeatedly, is this a
BINgo. The game of BINGO involves drawing numbered and lettered buttons at random from a barrel. The B numbers are 1–15, the I numbers are 16–30, the N numbers are 31–45, the G numbers are 46–60, and the O numbers are 61–75. Buttons are not replaced after they have been selected. What is
Probability Distributions and genetics. Many traits are controlled by a dominant gene, denoted bya, and a recessive gene, denoted bya. Suppose that two parents carry these genes in the proportion 3:1; that is, the probability of either parent giving the a gene is 0.75, and the probability of either
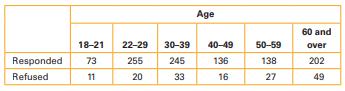
Survey Refusals. Refer to the following table summarizing results from a study of people who refused to answer survey questions (based on data from “I Hear You Knocking but You Can’t Come In,” by Fitzgerald and Fuller, Sociological Methods and Research, Vol. 11, No. 1). In each case, assume
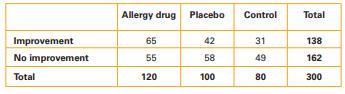
Drug Tests. An allergy drug is tested by giving 120 people the drug and 100 people a placebo. A control group consists of 80 people who were given no treatment. The number of people in each group who showed improvement appears in the table below.a. What is the probability that a randomly selected
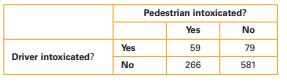
If two different pedestrian deaths are randomly selected, find the probability that in both cases the pedestrians were intoxicated.use the following table, which summarizes data on 985 pedestrian deaths that were caused by accidents (based on data from the National Highway Traffic Safety
If two different pedestrian deaths are randomly selected, find the probability that they both involved intoxicated drivers.use the following table, which summarizes data on 985 pedestrian deaths that were caused by accidents (based on data from the National Highway Traffic Safety Administration)
If one of the pedestrian deaths is randomly selected, find the probability that the driver was intoxicated or the pedestrian was not intoxicated.use the following table, which summarizes data on 985 pedestrian deaths that were caused by accidents (based on data from the National Highway Traffic
If one of the pedestrian deaths is randomly selected, find the probability that the pedestrian was intoxicated or the driver was not intoxicated.use the following table, which summarizes data on 985 pedestrian deaths that were caused by accidents (based on data from the National Highway Traffic
If one of the pedestrian deaths is randomly selected, find the probability that the pedestrian was not intoxicated or the driver was not intoxicated.use the following table, which summarizes data on 985 pedestrian deaths that were caused by accidents (based on data from the National Highway Traffic
If one of the pedestrian deaths is randomly selected, find the probability that the pedestrian was intoxicated or the driver was intoxicated.use the following table, which summarizes data on 985 pedestrian deaths that were caused by accidents (based on data from the National Highway Traffic Safety
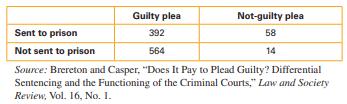
If a defendant is randomly selected, what is the probability that the defendant entered a guilty plea and was not sent to prison?The data in the following table show the outcomes of guilty and not-guilty pleas in 1,028 criminal court cases. Use the data to answer Exercise Sent to prison Not sent to
If a defendant is randomly selected, what is the probability that the defendant entered a guilty plea and was sent to prison?The data in the following table show the outcomes of guilty and not-guilty pleas in 1,028 criminal court cases. Use the data to answer Exercise Sent to prison Not sent to
If two different defendants are randomly selected, what is the probability that they both were sentenced to prison?The data in the following table show the outcomes of guilty and not-guilty pleas in 1,028 criminal court cases. Use the data to answer Exercise Sent to prison Not sent to prison Guilty
If two different defendants are randomly selected, what is the probability that they both entered guilty pleas?The data in the following table show the outcomes of guilty and not-guilty pleas in 1,028 criminal court cases. Use the data to answer Exercise Sent to prison Not sent to prison Guilty
What is the probability that a randomly selected defendant either pled not guilty or was not sent to prison?The data in the following table show the outcomes of guilty and not-guilty pleas in 1,028 criminal court cases. Use the data to answer Exercise Sent to prison Not sent to prison Guilty plea
What is the probability that a randomly selected defendant either pled guilty or was sent to prison?The data in the following table show the outcomes of guilty and not-guilty pleas in 1,028 criminal court cases. Use the data to answer Exercise Sent to prison Not sent to prison Guilty plea
Polling Calls. A telephone pollster has names and telephone numbers for 45 voters, 20 of whom are registered Democrats and 25 of whom are registered Republicans.Calls are made in random order. Suppose you want to find the probability that the first two calls are to Republicans.a. Are these
Radio Tunes. An MP3 player is loaded with 60 musical selections: 30 rock selections, 15 jazz selections, and 15 blues selections. The player is set on “random play,” so selections are played randomly and can be repeated. What is the probability of each of the following events?a. The first four
Wearing hunter orange. A study of hunting injuries and the wearing of hunter orange clothing showed that among 123 hunters injured when mistaken for game, 6 were wearing orange (based on data from the Centers for Disease Control and Prevention). If a follow-up study begins with the random selection
Password. A new computer owner creates a password consisting of five characters. She randomly selects a letter of the alphabet for the first character and a digit (0, 1, 2, 3, 4, 5, 6, 7, 8, 9) for each of the other four characters; the digits may be reused, so there are 10 possibilities for each
Births. A couple plans to have four children. Find the probability that the first two children are girls and the last two children are boys.
Births. Assume that boys and girls are equally likely and that the gender of a child is independent of the gender of any brothers or sisters. If a couple already has three girls, find the probability of getting a girl when their fourth baby is born.
Lottery. The probability of your winning the state lottery this week is not affected by whether you won that same lottery last week.decide whether the statement makes sense (or is clearly true) or does not make sense (or is clearly false). Explain clearly; not all of these have definitive answers,
Either/Or Probability. P(A) = 0.5 and P(A or B) = 0.8.decide whether the statement makes sense (or is clearly true) or does not make sense (or is clearly false). Explain clearly; not all of these have definitive answers, so your explanation is more important than your chosen answer.
Combining Probabilities. The probability of flipping a coin and getting heads is 0.5. The probability of selecting a red card when one card is drawn from a shuffled deck is also 0.5. When flipping a coin and drawing a card, the probability of getting heads or a red card is 0.5 + 0.5 = 1.decide
Lottery. The numbers 5, 17, 18, 27, 36, and 41 were drawn in the last lottery; they should not be bet on in the next lottery because they are now less likely to occur.decide whether the statement makes sense (or is clearly true) or does not make sense (or is clearly false). Explain clearly; not all
Complementary Events. Let A denote some event. Are events A and A non-overlapping? Why or why not?
Sampling with Replacement? The professor in a class of 25 students randomly selects a student and then randomly selects a second student. If all 25 students are available for the second selection, is this sampling with replacement or sampling without replacement? Is the second outcome independent
Non-overlapping Events. In your own words, state what it means for two events to be non-overlapping.
Independence. Let A denote the event of turning on your cell phone and finding that it works, and let B denote the event of turning on your car radio and finding that it works. Are events A and B independent or are they dependent?
Vital Statistics. Find a recent news report that gives current data about vital statistics or life expectancy. Summarize the report and the statistics, and discuss any personal or social implications of the new data.
Travel Safety. Find a recent news article discussing some aspect of travel safety (such as risk of accidents in automobiles or airplanes, the efficacy of child car seats, or the effects of driving while talking on a cell phone). Summarize any given statistics about risks, and give your overall
understanding Risk. The book Against the Gods: The Remarkable Story of Risk by Peter Bernstein (John Wiley, 1996) is an award-winning account of the history of probability and risk assessment. Find the book in a library or bookstore (it’s a worthwhile purchase) and identify a particular event
Richter Scale for Risk. The Royal Statistical Society has proposed a system of risk magnitudes and risk factors analogous to the Richter scale for measuring earthquakes.Go to the Internet to learn how these measures of risk are defined and computed. Using these measures, discuss the risks of
Life Expectancy Calculations. You will find many life expectancy calculators available on the Internet; try a few of them. Do they seem to give accurate or realistic results?Explore the statistical techniques that are used to make life expectancy tables.
uganda Case Study. Find data regarding life expectancies in Uganda over the past few decades. You will see that Ugandan life expectancy has risen dramatically in the past decade. What explains this rise, and what lessons might it have for improving life expectancy in other African nations?
male and Female Life Expectancies. Find data about how and why male and female life expectancies are changing with time. Why do women have longer life expectancies than men? Should we expect male life expectancies to catch up with female life expectancies in the future?Summarize your findings with
u.S. vs. World Life Expectancy. You can find a great deal of data on the Web about life expectancies around the world. How does U.S. life expectancy compare to life expectancy in other developed countries? What might explain the differences you see? Based on your findings, discuss potential
China Birth and Death Rates. These estimated 2011 values are for China: population = 1,336,718,015; birth rate =12.3 per 1,000; death rate = 7.0 per 1,000.a. Approximately how many births were there in China?b. About how many deaths were there in China?c. Based on births and deaths alone (i.e., not
u.S. Birth and Death Rates. In 2011, the estimated U.S.population reached 313 million. The overall birth rate was estimated to be 13.8 births per 1,000, and the overall death rate was estimated to be 8.4 deaths per 1,000.a. Approximately how many births were there in the United States?b. About how
high/Low u.S. Death Numbers. In a recent year, there were 235,000 deaths in California, the highest number in the United States. The state with the lowest number of deaths was Alaska, with 3,000 deaths. The populations of California and Alaska were approximately 35,463,000 and 648,000,
high/Low u.S. Birth Rates. The highest and lowest birth rates in the United States in 2008 were in Utah and Maine, respectively. Utah reported 55,633 births with a population of 2,736,424 people. Maine reported 13,610 births with a population of 1,316,456 people. Use these data to find the birth
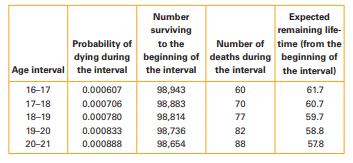
Death Rate. Find the death rate per 10,000 for people during their 17th year (age 16–17).use the data in the following table for people in the United States between the ages of 16 and 21 years. Probability of dying during Number surviving to the beginning of Expected remaining life- Number of
Death Rate. Life insurance companies must carefully monitor death rates. Before issuing a life insurance policy for a 19-year-old, the company needs to know the death rate for that age group. Find the death rate per 10,000 for people during their 20th year (age 19–20).use the data in the
Expected Lifetime. How many years is a randomly selected 17-year-old expected to live beyond his or her 17th birthday?use the data in the following table for people in the United States between the ages of 16 and 21 years. Probability of dying during Number surviving to the beginning of Expected
Expected Lifetime. How many years is a randomly selected 19-year-old expected to live beyond his or her 19th birthday?use the data in the following table for people in the United States between the ages of 16 and 21 years. Probability of dying during Number surviving to the beginning of Expected
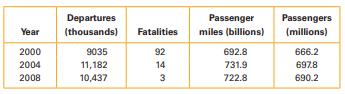
For the year 2008, find the fatality rate in deaths per passenger mile. Why don’t we report the fatality rate in units of deaths per passenger mile?use the following table, which summarizes data on commercial aviation flights in the United States for three separate years. Departures Passenger
For each of the three years, find the fatality rate in deaths per million passengers. On the basis of those rates, which year was the safest? Why?use the following table, which summarizes data on commercial aviation flights in the United States for three separate years. Departures Passenger
For each of the three years, find the fatality rate in deaths per billion passenger miles. On the basis of those rates, which year was the safest? Why?use the following table, which summarizes data on commercial aviation flights in the United States for three separate years. Departures Passenger
For each of the three years, find the fatality rate in deaths per 1,000 departures. On the basis of those rates, which year was the safest? Why?use the following table, which summarizes data on commercial aviation flights in the United States for three separate years. Departures Passenger
Risk of Death. In a recent year, the total numbers of deaths in the United States due to either accidents or pneumonia were approximately decide whether the statement makes sense (or is clearly true) or does not make sense (or is clearly false). Explain clearly. Not all of these have definitive
Expected age at Death. As you become older, your expected age at death increases.decide whether the statement makes sense (or is clearly true) or does not make sense (or is clearly false). Explain clearly. Not all of these have definitive answers, so your explanation is more important than your
Life Expectancy. Your life expectancy increases as your age increases.decide whether the statement makes sense (or is clearly true) or does not make sense (or is clearly false). Explain clearly. Not all of these have definitive answers, so your explanation is more important than your chosen answer.
Life Expectancy. Because people are not expected to live longer than 90 years, a 100-year-old person has a negative life expectancy.decide whether the statement makes sense (or is clearly true) or does not make sense (or is clearly false). Explain clearly. Not all of these have definitive answers,
Life Expectancy. Based on recent data, a 20-year-old person in the United States has a life expectancy of 58.8 years.What does that mean?
Life Expectancy. What is life expectancy? Does a 30-yearold person have the same life expectancy as a 20-year-old person? Why or why not?
Vital Statistics. What are vital statistics?
Birth Rate. The current U.S. birth rate is given as 13.5 per 1,000 population. When comparing population growth in different countries, why is it better to use birth rates instead of the actual numbers of births?
gambler’s Ruin. Describe a situation you know of in which someone lost nearly everything through gambling. Did his or her strategy appear to be rational, or did it appear to be the result of a destructive addiction?
gambler’s Fallacy in Life. Describe a situation in which you or someone you know has fallen victim to the gambler’s fallacy. How could the situation have been dealt with correctly?
Personal Law of Large Numbers. Describe a situation in which you personally have made use of the law of large numbers, either correctly or incorrectly. Why did you use the law of large numbers in this situation?Was it helpful?
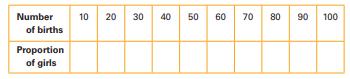
Law of Large Numbers. Use a coin to simulate 100 births: Flip the coin 100 times, recording the results, and then convert the outcomes to genders of babies(tail = boy and head = girl). Use the results to fill in the following table. What happens to the proportion of girls as the sample size
analyzing Lotteries on the Web. Go to the Web site for all U.S. lotteries and study the summary of state and multistate lottery odds and prizes. Pick five lotteries and determine the expected value for winnings in each case. Discuss your results.
Showing 1700 - 1800
of 5397
First
11
12
13
14
15
16
17
18
19
20
21
22
23
24
25
Last
Step by Step Answers