New Semester
Started
Get
50% OFF
Study Help!
--h --m --s
Claim Now
Question Answers
Textbooks
Find textbooks, questions and answers
Oops, something went wrong!
Change your search query and then try again
S
Books
FREE
Study Help
Expert Questions
Accounting
General Management
Mathematics
Finance
Organizational Behaviour
Law
Physics
Operating System
Management Leadership
Sociology
Programming
Marketing
Database
Computer Network
Economics
Textbooks Solutions
Accounting
Managerial Accounting
Management Leadership
Cost Accounting
Statistics
Business Law
Corporate Finance
Finance
Economics
Auditing
Tutors
Online Tutors
Find a Tutor
Hire a Tutor
Become a Tutor
AI Tutor
AI Study Planner
NEW
Sell Books
Search
Search
Sign In
Register
study help
business
nonparametric statistical inference
Statistical Reasoning For Everyday Life 4th Edition Jeffrey Bennett - Solutions
E = 0.05 estimate the minimum sample size needed to achieve the given margin of error.
E = 0.04 estimate the minimum sample size needed to achieve the given margin of error.
n = 780, pn = 0.160 assume that population proportions are to be estimated from the samples described. In each case, find the approximate margin of error and 95% confidence interval.
n = 550, pn = 0.1 assume that population proportions are to be estimated from the samples described. In each case, find the approximate margin of error and 95% confidence interval.
Sample size = 800, sample proportion = 0.25 assume that population proportions are to be estimated from the samples described. In each case, find the approximate margin of error and 95% confidence interval.
Sample size = 1,000, sample proportion = 0.4 assume that population proportions are to be estimated from the samples described. In each case, find the approximate margin of error and 95% confidence interval.
Sample Size. A reporter for the Kingston Chronicle claims that any good confidence interval should be based on a sample that is at least 5% of the population size.decide whether the statement makes sense (or is clearly true) or does not make sense (or is clearly false). Explain clearly. Not all of
Sample Size. The 95% confidence interval given in Example 1 is based on a sample size of 150.If the sample size is increased, the confidence interval will become smaller (or narrower).decide whether the statement makes sense (or is clearly true) or does not make sense (or is clearly false). Explain
confidence interval in the Media. The Kingston Chronicle publishes an article stating that, based on survey results, 82% of Orange County residents oppose an increase in the sales tax, with a margin of error of 4 percentage points. A reader says that this can be expressed as the confidence interval
interpreting a confidence interval.We can interpret the confidence interval given in Exercise 1 by saying that there is a 95% chance that the true population proportion will fall between 0.393 and 0.553.decide whether the statement makes sense (or is clearly true) or does not make sense (or is
Small Sample. In a Pew Research Center poll, 73% of 3011 adults surveyed said that they use the Internet. A reporter claims that the results are not very good because they are based on a survey of only 0.001% of the adults in the United States, and that percentage is too small to be meaningful. Is
confidence intervals in the Media. Here is a typical statement made by the media: “Based on a survey of 1050 likely voters, 44% plan to vote for the Republican candidate, and this survey has a margin of error of 3 percentage points.”What important and relevant piece of information is omitted
Margin of Error. In a study of 1,228 randomly selected medical malpractice lawsuits, it is found that the proportion that were dropped or dismissed is 0.697. When a 95% confidence interval is constructed for the population proportion of all lawsuits, the margin of error is found to be
confidence interval. In an Accountemps survey, senior executives were asked to identify the most common error made in interviews of job applicants. The following 95%confidence interval estimates the population proportion p for “little or no knowledge of the company.” Interpret that confidence
Estimating Population Means. Find a news article or report in which a population mean is estimated from a sample. The article should include a margin of error and/or a confidence interval. Discuss the methods used in the study and how the conclusions were reached.
international corruption. Transparency International uses surveys to determine a Bribe Payer’s Index and Corruption Perception Index that measure the degree of corruption in many countries worldwide. Visit the Transparency International Web site and review the extensive documentation describing
network Polls. All of the major television networks conduct regular polls on a variety of issues. Visit the Web site of at least one major network and gather the results of a particular poll that involves estimation of a population mean. Be sure to include all information that is given about the
Polling organizations. Three leading public polling organizations are the Gallup Organization, Harris Poll, and Yankelovich Partners. Visit their Web sites. Describe the history of each organization and the polling services it provides. Which organization has the best description on its Web site of
car ages. Assume that you want to estimate the mean age of cars driven by students at your college. A previous study shows that the standard deviation of those ages is approximately 3.7 years. How many car ages must you randomly select in order to be 95% confident that your sample mean is within 1
Tv Sets. A random sample of n = 31 households is asked the number of TV sets in the household. The responses are as follows:1 0 2 3 2 3 4 2 1 1 2 4 3 2 3 3 0 1 0 1 3 2 4 3 2 1 4 0 1 2 3a. What is the mean number of TVs for the sample?b. What is the standard deviation for the sample?c. What is the
Family Size. You select a random sample of n = 31 families in your neighborhood and find the following family sizes (number of people in the family):2 3 6 5 4 2 3 3 1 2 3 2 3 4 5 3 1 3 3 4 7 3 2 3 2 2 3 4 1 5 2a. What is the mean family size for the sample?b. What is the standard deviation for the
cotinine Levels of Smokers. When people smoke, the nicotine they absorb is converted to cotinine, which can be measured. A sample of cotinine levels of 40 smokers is listed below. Find a 95% confidence interval estimate of the mean cotinine level of all smokers.1 0 131 173 265 210 44 277 32 3 35
Weight of Bears. The health of the bear population in Yellowstone National Park is monitored by periodic measurements taken from anesthetized bears. A sample of the weights (pounds) of such bears is given below. Find a 95%confidence interval estimate of the mean of the population of all such bear
garbage Production. Based on a sample of 62 households, the mean weight of discarded plastic is 1.91 pounds and the standard deviation is 1.07 pounds (data from the Garbage Project at the University of Arizona). Use a single value to estimate the mean weight of discarded plastic for all households.
Time to graduation. Data from the National Center for Education Statistics on 4,400 college graduates show that the mean time required to graduate with a bachelor’s degree is 5.15 years with a standard deviation of 1.68 years.Use a single value to estimate the mean time required to graduate for
Weights of Babies. A sample of 186 newborn babies has a mean weight of 3103 g and a standard deviation of 696 g.Use a single value to estimate the mean weight of a newborn baby. Also, find the 95% confidence interval.
Weight of Quarters. You want to estimate the mean weight of quarters in circulation. A sample of 40 quarters has a mean weight of 5.639 grams and a standard deviation of 0.062 gram. Use a single value to estimate the mean weight of all quarters. Also, find the 95% confidence interval.
Sample Size for Estimating income. An economist wants to estimate mean annual income from the first year of work for college graduates who have had the profound wisdom to take a statistics course. How many such incomes must be found if she wants to be 95% confident that the sample mean is within
Sample Size for Mean iQ of Statistics Students. The Wechsler IQ test is designed so that the mean is 100 and the standard deviation is 15 for the population of normal adults. Find the sample size necessary to estimate the mean IQ score of Delaware residents. We want to be 95% confident that our
Sample Size for Housing Prices. A government survey conducted to estimate the mean price of houses in a large metropolitan area is designed to have a margin of error of$10,000. Pilot studies suggest that the population standard deviation is $65,500. Estimate the minimum sample size needed to
Sample Size for Tv Survey. Nielsen Media Research wishes to estimate the mean number of hours that high school students spend watching TV on a weekday. A margin of error of 0.25 hour is desired. Past studies suggest that a population standard deviation of 1.7 hours is reasonable.Estimate the
Margin of error = 0.5 g, standard deviation = 8.7 g assume that you want to construct a 95% confidence interval estimate of a population mean. Find an estimate of the sample size needed to obtain the specified margin of error for the 95% confidence interval. The sample standard deviation is given.
Margin of error = 3.5 ml, standard deviation = 155.2 ml assume that you want to construct a 95% confidence interval estimate of a population mean. Find an estimate of the sample size needed to obtain the specified margin of error for the 95% confidence interval. The sample standard deviation is
Margin of error = 18.2 cm, standard deviation = 95.2 cm assume that you want to construct a 95% confidence interval estimate of a population mean. Find an estimate of the sample size needed to obtain the specified margin of error for the 95% confidence interval. The sample standard deviation is
Margin of error = +5, standard deviation = +20 assume that you want to construct a 95% confidence interval estimate of a population mean. Find an estimate of the sample size needed to obtain the specified margin of error for the 95% confidence interval. The sample standard deviation is given.
n = 64, x = +550, s = +60 decide whether the statement makes sense (or is clearly true) or does not make sense (or is clearly false). Explain clearly. Not all of these statements have definitive answers, so your explanation is more important than your chosen answer.
n = 100, x = 8.0 ft, s = 2.0 ft decide whether the statement makes sense (or is clearly true) or does not make sense (or is clearly false). Explain clearly. Not all of these statements have definitive answers, so your explanation is more important than your chosen answer.
Sample size = 81, sample mean = 4.5 km, sample standard deviation = 3.1 km decide whether the statement makes sense (or is clearly true) or does not make sense (or is clearly false). Explain clearly. Not all of these statements have definitive answers, so your explanation is more important than
sample size = 49, sample mean = 25.2 cm, sample standard deviation = 2.2 cm decide whether the statement makes sense (or is clearly true) or does not make sense (or is clearly false). Explain clearly. Not all of these statements have definitive answers, so your explanation is more important than
Best Estimate. When sample data were used to estimate the value of the mean weight of all pennies, this 95% confidence interval was obtained:2.512 grams 6 m 6 2.512 grams assume that population means are to be estimated from the samples described. In each case, use the sample results to approximate
Margin of Error. When sample data are used to estimate the value of a population mean, the margin of error decreases as the sample size increases.decide whether the statement makes sense (or is clearly true) or does not make sense (or is clearly false). Explain clearly. Not all of these statements
Margin of Error. The mean income of high school mathematics teachers was estimated to be $48,213 with a margin of error of five percentage points.decide whether the statement makes sense (or is clearly true) or does not make sense (or is clearly false). Explain clearly. Not all of these statements
interpreting a confidence interval.For the confidence interval given in Exercise 1, we can interpret that result by saying that “95% of sample means will fall between 8.0518 grams and 8.0902 grams.”decide whether the statement makes sense (or is clearly true) or does not make sense (or is
Sample Size. The National Health Examination involves measurements from about 25,000 people, and the results are used to estimate values of various population means.Is it valid to criticize this survey because the sample size is only about 0.01% of the population of all Americans? Explain.
confidence intervals in the Media. Here is a typical statement made by the media: “Based on a recent study, pennies weigh an average of 2.5 grams with a margin of error of 0.006 gram.” What important and relevant piece of information is omitted from that statement? Is it OK to use the word
Margin of Error. Based on a random sample of hospital costs for car crash victims, the sample mean is $9,004 and the margin of error for a 95% confidence interval is $266.Identify the confidence interval.
confidence interval. From a random sample of weights of dollar coins, we construct this 95% confidence interval estimate of the mean:8.0518 grams 6 m 6 8.0902 grams Interpret this confidence interval.
Sample Proportions in the news. Find a news or research report in which a sample proportion is cited. Discuss how it is used to estimate a population proportion.
Sample Means in the news. Find a news or research report in which a sample mean is cited. Discuss how it is used to estimate a population mean.
Distributions of Sample Proportions. Consider the data set from earlier in this section showing 400 yes and no responses to a survey question (“Do you own a car?”). Discuss methods for selecting a random sample from this population. Let each person in the class select a random sample of n = 10
Distributions of Sample Means. Consider the large data set of hours students spend using an Internet search engine, listed earlier in this section. Discuss methods for selecting a random sample from this population.Let each person in the class select a random sample of n = 10 individuals from the
Forming Sampling Distributions. The ages (years) of the four U.S. presidents when they were assassinated in office are 56 (Lincoln), 49 (Garfield), 58 (McKinley), and 46(Kennedy). Consider these four ages to be a population.a. Assuming that two of the ages are randomly selected to form samples of
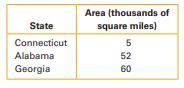
Forming Sampling Distributions. Three states and their areas (in thousands of square miles) are given in the following table. Consider these three states to be the entire population from which samples of size n = 2 will be selected(with replacement).a. Find the mean of each of the 9 different
Sampling Distribution. Here is the population of all five U.S. presidents who had professions in the military, along with their ages at inauguration: Eisenhower, 62; Grant, 46;Harrison, 68; Taylor, 64; and Washington, 57.Assume that samples of size 2 are randomly selected (with replacement)from the
Sampling Distribution. A quarterback threw 1 interception in his first game, 2 interceptions in his second game, 5 interceptions in his third game, and then he retired. Consider the values of 1, 2, and 5 to be a population. Assume that samples of size 2 are randomly selected (with replacement)from
Distribution of Sample Proportions. Suppose you know that the distribution of sample proportions of women employees is normal with a mean of 0.42 and a standard deviation of 0.21. Suppose you select a random sample of employees and find that the proportion of women in the sample is 0.45.a. How many
Distribution of Sample Proportions. Suppose you know that the distribution of sample proportions of nonresidents in samples of 200 students is normal with a mean of 0.34 and a standard deviation of 0.03. Suppose you select a random sample of 200 students and find that the proportion of nonresident
Estimating Population Proportions. A random sample of 500 people was selected from the 103,219 people in attendance at the Super Bowl game between the Green Bay Packers and the Pittsburgh Steelers. Within the sample, 290 people supported the Packers. Based on this result, estimate how many people
Estimating Population Proportions. You select a random sample of 150 people at a medical convention attended by 1,608 people. Within your sample, you find that 73 people have traveled from abroad. Based on this sample statistic, estimate how many people at the convention traveled from abroad. Would
Sample and Population Proportions. The College of Portland has 2,444 students and 269 of them are lefthanded. You conduct a survey of 50 students and find that 8 of them are left-handed.a. What is the population proportion of left-handed students?b. What is the sample proportion of left-handed
Sample and Population Proportions. Suppose that, in a suburb of 12,345 people, 6,523 people moved there within the past five years. You survey 500 people and find that 245 of the people in your sample moved to the suburb in the past five years.a. What is the population proportion of people who
Distribution of Sample Means. Assume that the population of heights of men has a normal distribution with a mean of 69.5 in. and random samples of 100 men result in sample mean heights with a mean of 69.5 in. and a standard deviation of 0.24 in.a. If one sample of 100 men results in a mean height
Distribution of Sample Means. Assume that cans of Coke are filled so that the actual amounts have a mean of 12.00 ounces. A random sample of 36 cans has a mean amount of 12.19 ounces. The distribution of sample means of size 36 is normal with an assumed mean of 12.00 ounces, and those sample means
Estimating Population Means. When 40 women were randomly selected and tested for their cholesterol levels, a mean of 240.9 milligrams was obtained. Would you be more confident of your estimate if the sample included measurements from 500 women? Explain.
Estimating Population Proportions. In a survey of children 5 to 17 years old, 1,050 children were randomly selected from the nine states in the Northeast, and the proportion who spoke a language other than English in their home was 0.19. Is that sample proportion a good estimate for children in the
Survey. In an Adecco Staffing survey of 1,000 adults in the United States, 140 (or 14%) said that salary was the most important feature of their job. The sample proportion of 0.14 cannot be a good estimate of the population proportion because this survey is based on such a small proportion of the
Large Sample Size. A researcher for a car dealership wants to estimate the mean age of cars in his county. He goes to the largest shopping mall, he randomly selects 3,000 cars in the parking lot, and he obtains their ages from the registration stickers on the car windows. He then computes the mean
Larger Sample Size. When a random sample is used to estimate a population mean, the sample mean tends to become a better estimate of the population mean as the sample size increases.decide whether the statement makes sense (or is clearly true) or does not make sense (or is clearly false). Explain
Larger Sample Size. Two different surveys will be conducted to estimate the mean salary of employees who have taken a statistics course. If the first survey has a larger sample size than the second survey, the first survey will result in a sample mean that is closer to the population mean(when
notation. What does pn denote, what does p denote, and what is the difference between them?
notation. What does x‾ denote, what does m denote, and what is the difference between them?
Polls. America OnLine published a survey question.Among the 2,300 Internet users who responded, 20%answered “yes” and the others answered “no.” For the“yes” responses, what is the value of pn? What is fundamentally wrong with this survey?
Sampling Distribution. Pollsters often use randomly selected digits between 0 and 9 to generate parts of telephone numbers to be called. What is the distribution of such randomly selected digits? If we repeat the process of randomly generating 50 digits and finding the mean, what is the
Based on what you’ve learned about the cause of global warming and its potential consequences, what do you think we should be doing about it, if anything?
Investigate some of the likely consequences of global warming. If current trends continue, what changes can you expect in the world by the year 2050? 2100?
Would you say that the case for human activity as the cause of global warming is now at the level of possible cause, probable cause, or cause beyond reasonable doubt? Defend your opinion.
Look back at the legal levels of confidence in causality discussed in Section
Look back at the six guidelines for establishing causality.Discuss whether or how each guideline is met by current data and understanding of global warming.
Read the latest edition of the NAEP Reading Report Card(available online). What are some of the latest results with regard to the teaching of reading in the United States?
Have you ever helped a child learn to read? Compare your experiences with those of other classmates who have worked with young children.
Currently, the NAEP tests are given to only a few thousand of the millions of school children in the United States. Some people advocate giving similar tests to all students, on either a voluntary or a mandatory basis. Do you think such “standardized national testing” is a good idea? Why or why
Do you think that standardized tests like those of the NAEP are valid ways to measure academic achievement?Why or why not?
One result of the NAEP reading tests is that students in private schools tend to score significantly higher than students in public schools. Does this imply that private schools are“better” than public schools? Defend your opinion.
If the line of best fit is inserted in a scatterplot, it must pass through every point in the graph.determine whether the given statement is true or false.
A scatterplot is a graph in which the points are scattered throughout, without any noticeable pattern.determine whether the given statement is true or false.
If the value of the correlation coefficient is negative, the value of r 2must also be negative.determine whether the given statement is true or false.
If r = 1 or r = -1, then all points in the scatterplot lie directly on the line of best fit.determine whether the given statement is true or false.
If r = 0.200, then r2 = 0.040 and 4% of the plotted points lie on the line of best fit.determine whether the given statement is true or false.
Refer again to the scatterplot in Figure 23.Does there appear to be a significant correlation between the two variables?
For a collection of paired sample data, the correlation coefficient is found to be -0.099. Which of the following statements best describes the relationship between the two variables?a. There is no correlation.b. There is a weak correlation.c. There is a strong correlation.d. One of the variables
Which of the following are likely to have a correlation?a. SAT scores and weights of randomly selected subjectsb. Reaction times and IQ scores of randomly selected subjectsc. Height and arm span of randomly selected subjectsd. Proportion of seats filled and amount of airline profit for randomly
Fill in the blanks: Every possible correlation coefficient must lie between the values of _____ and _____.
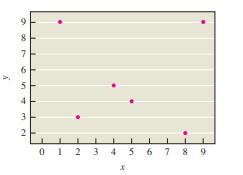
Examine the scatterplot in Figure 22 and estimate the value of the correlation coefficient. 3 4 54 6 986 7 2 0 1 2 3 4 5 6789
A researcher collects paired sample data and computes the value of the linear correlation coefficient to be 0.Based on that value, he concludes that there is no relationship between the two variables. What is wrong with this conclusion?
You are considering the most expensive purchase that you are likely to make: the purchase of a home. Identify at least five different variables that are likely to affect the actual value of a home. Among the variables that you have identified, which single variable is likely to have the greatest
In a study of randomly selected subjects, it is found that there is a strong correlation between household income and number of visits to dentists. Is it valid to conclude that higher incomes cause people to visit dentists more often?Is it valid to conclude that more visits to dentists cause people
For 10 pairs of sample data, the correlation coefficient is computed to be r = -1. What do you know about the scatterplot?
In a study of global warming, assume that we have found a strong positive correlation between carbon dioxide concentration and temperature. Identify three possible explanations for this correlation.
In a study of casino size (square feet) and revenue, the value of r = 0.445 is obtained. Find the value of r 2. What does that value tell us?
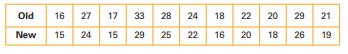
Can we conclude that the old ratings have a direct causal effect on the new ratings? Explain briefly.refer to the combined city–highway fuel economy ratings (mi/gal) for different cars. The old ratings are based on tests used before 2008 and the new ratings are based on tests that went into
Showing 1500 - 1600
of 5397
First
9
10
11
12
13
14
15
16
17
18
19
20
21
22
23
Last
Step by Step Answers