New Semester
Started
Get
50% OFF
Study Help!
--h --m --s
Claim Now
Question Answers
Textbooks
Find textbooks, questions and answers
Oops, something went wrong!
Change your search query and then try again
S
Books
FREE
Study Help
Expert Questions
Accounting
General Management
Mathematics
Finance
Organizational Behaviour
Law
Physics
Operating System
Management Leadership
Sociology
Programming
Marketing
Database
Computer Network
Economics
Textbooks Solutions
Accounting
Managerial Accounting
Management Leadership
Cost Accounting
Statistics
Business Law
Corporate Finance
Finance
Economics
Auditing
Tutors
Online Tutors
Find a Tutor
Hire a Tutor
Become a Tutor
AI Tutor
AI Study Planner
NEW
Sell Books
Search
Search
Sign In
Register
study help
business
nonparametric statistical inference
Statistical Reasoning For Everyday Life 4th Edition Jeffrey Bennett - Solutions
SAT Score. Jennifer received an SAT score that was equal to the first quartile and the 35th percentile.decide whether the statement makes sense (or is clearly true) or does not make sense (or is clearly false). Explain clearly; not all of these statements have definitive answers, so your
Quartiles. For the salaries paid to the 817 professional baseball players in a recent year, the first quartile is $4,355,101.What do we mean when we say that $4,355,101 is the first quartile?
correct Statement? In the book How to Lie with Charts, the author writes that “the standard deviation is usually shown as plus or minus the difference between the high and the mean, and the low and the mean. For example, if the mean is 1, the high is 3, and the low is -1, the standard deviation
Standard Deviation. Assume that you are manufacturing aspirin tablets that are supposed to contain 325 mg of aspirin. If the standard deviation of the amounts of aspirin is calculated, which value would you prefer: a standard deviation of 20 mg or a standard deviation of 10 mg? Why?
range. How is the range computed for a set of sample data? Is the range a measure of variation? What is a major disadvantage of the range?
Skewed Distribution. Give an example of a real distribution that you would expect to be either right- or left-skewed. Make a rough sketch of the distribution;be sure to label the axes on your sketch.
Trimodal Distribution. Give an example of a real distribution that you expect to have three modes. Make a rough sketch of the distribution; be sure to label the axes on your sketch.
Distributions in the News. Find three recent examples in the news of distributions shown as histograms or line charts. Over each distribution, draw a smooth curve that captures its general features. Then classify the distribution according to its number of modes, symmetry or skewness, and variation.
Social Security Data. Survey a sample of fellow students, asking each to indicate the last digit of her or his Social Security number. Also ask each participant to indicate the fifth digit. Draw one graph showing the distribution of the last digits and another graph showing the distribution of the
Tax Stats. The IRS Web site provides statistics collected from tax returns on income, refunds, and much more.Choose a set of statistics from this Web site and study the distribution. Describe the distribution in words, and discuss anything you learn that is relevant to national tax policies.
New york Marathon. The Web site for the New York City marathon gives frequency data for finish times in the most recent marathon. Study the data, make a rough sketch of the distribution, and describe the shape of the distribution in words.
Times. The amounts of time that 5000 randomly selected individual taxpayers used to prepare their federal tax returns answer the following questions:a. How many modes would you expect for the distribution?b. Would you expect the distribution to be symmetric, left-skewed, or right-skewed?
Incomes. The incomes of people sitting in luxury boxes at the Super Bowl answer the following questions:a. How many modes would you expect for the distribution?b. Would you expect the distribution to be symmetric, left-skewed, or right-skewed?
Patron Ages. The ages of people who visit Disneyworld answer the following questions:a. How many modes would you expect for the distribution?b. Would you expect the distribution to be symmetric, left-skewed, or right-skewed?
Patron Ages. The ages of adults who visit the National Air and Space Museum answer the following questions:a. How many modes would you expect for the distribution?b. Would you expect the distribution to be symmetric, left-skewed, or right-skewed?
Speeds. The speeds of drivers on a highway in Montana answer the following questions:a. How many modes would you expect for the distribution?b. Would you expect the distribution to be symmetric, left-skewed, or right-skewed?
Patients. The ages of 1,000 randomly selected patients being treated for dementia answer the following questions:a. How many modes would you expect for the distribution?b. Would you expect the distribution to be symmetric, left-skewed, or right-skewed?
Vehicle Weights. The weights of cars in a fleet consisting of 50 compact cars and 50 delivery trucks answer the following questions:a. How many modes would you expect for the distribution?b. Would you expect the distribution to be symmetric, left-skewed, or right-skewed?
Weights of cola. The weights of the cola in 1000 randomly selected cans of Coke answer the following questions:a. How many modes would you expect for the distribution?b. Would you expect the distribution to be symmetric, left-skewed, or right-skewed?
heights. The heights of 500 male students, half of whom are adults while the other half are eight years of age answer the following questions:a. How many modes would you expect for the distribution?b. Would you expect the distribution to be symmetric, left-skewed, or right-skewed?
heights. The heights of 250 randomly selected male attorneys answer the following questions:a. How many modes would you expect for the distribution?b. Would you expect the distribution to be symmetric, left-skewed, or right-skewed?
reaction Times. The reaction times of 500 randomly selected drivers, measured under standard conditions answer the following questions:a. How many modes would you expect for the distribution?b. Would you expect the distribution to be symmetric, left-skewed, or right-skewed?
Incomes. The annual incomes of all those in a statistics class, including the instructor answer the following questions:a. How many modes would you expect for the distribution?b. Would you expect the distribution to be symmetric, left-skewed, or right-skewed?
boston rainfall. The daily rainfall amounts (in inches) for Boston in a recent year consist of 365 values with these properties:• The mean daily rainfall amount is 0.083 inch.• The median of the daily rainfall amounts is 0 inches.• The minimum daily rainfall amount is 0 inches and the maximum
baseball Salaries. In a recent year, the 817 professional baseball players had salaries with the following characteristics:• The mean was $3,250,178.• The median was $1,152,000.• The salaries ranged from a low of $400,000 to a high of$33,000,000.a. Describe the shape of the distribution of
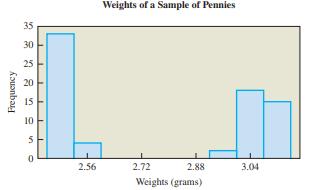
Penny Weights. The histogram in Figure 12 shows the weights (in grams) of 72 pennies. Over the histogram, draw a smooth curve that captures its general features. Then classify the distribution according to its number of modes and its symmetry or skewness. What feature of the graph reflects the fact
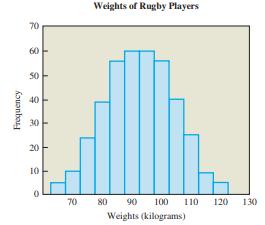
rugby Weights. The histogram in Figure 11 shows the weights of a sample of 391 rugby players. Over the histogram, draw a smooth curve that captures its general features. Then classify the distribution according to its number of modes and its symmetry or skewness. In words, summarize the meaning of
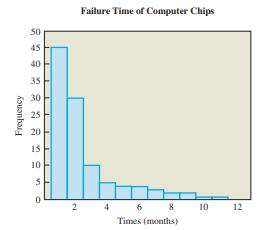
chip Failures. The histogram in Figure 10 shows the time until failure for a sample of 108 computer chips. Over the histogram, draw a smooth curve that captures its general features. Then classify the distribution according to its number of modes and its symmetry or skewness. In words, summarize
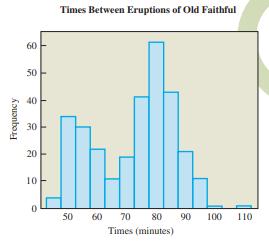
old Faithful. The histogram in Figure 9 shows the times between eruptions of Old Faithful geyser in Yellowstone National Park for a sample of 300 eruptions (with 299 times between eruptions). Over the histogram, draw a smooth curve that captures its general features. Then classify the distribution
uniform Distribution. Examination of a data set reveals that the mean and median are both equal to 98.2, so the distribution must be uniform.decide whether the statement makes sense (or is clearly true) or does not make sense (or is clearly false). Explain clearly; not all of these statements have
Distribution. Examination of a data set reveals that its distribution is left-skewed and unimodal.decide whether the statement makes sense (or is clearly true) or does not make sense (or is clearly false). Explain clearly; not all of these statements have definitive answers, so your explanation is
Symmetry. Examination of the data set reveals that it is symmetric with a mean of 98.2 and a median of 98.2.decide whether the statement makes sense (or is clearly true) or does not make sense (or is clearly false). Explain clearly; not all of these statements have definitive answers, so your
Symmetry. Because a data set has three modes, it must have a skewed distribution.decide whether the statement makes sense (or is clearly true) or does not make sense (or is clearly false). Explain clearly; not all of these statements have definitive answers, so your explanation is more important
Skewness. What is skewness in a graph?
IQ Scores. Consider the IQ scores of professors who teach statistics courses compared with the IQ scores of adults randomly selected from the general population. Which of these two sets of IQ scores has less variation? What effect does the lower variation have on a graph of the distribution of
Distribution. When the digits 0 through 9 are selected for a state lottery, the digits are selected in a way that they are all equally likely. Which term best describes the distribution of selected digits: skewed, bimodal, uniform, or unimodal?
Symmetry. In the United States, there are many people with little or no accumulated wealth, and there are a few people with very large amounts of wealth. What does this suggest about the symmetry of the distribution of wealth?
Averages in the News. Find three recent news articles that refer to some type of average. In each case, explain whether the average is a mean, a median, or some other type of average.
Daily Averages. Cite three examples of averages that you deal with in your own life (such as grade point average or batting average). In each case, explain whether the average is a mean, a median, or some other type of average. Briefly describe how the average is useful to you.
Navel Data. The navel ratio is defined to be a person’s height divided by the height (from the floor) of his or her navel. Measure the navel ratio of each person in your class and bin the data. Then make a frequency table, and draw a histogram of the distribution. What is the mean of the
Is the Median the Message? Read the article “The Median Isn’t the Message,” by Stephen Jay Gould, which is posted on the Web. Write a few paragraphs in which you describe the message that Gould was trying to get across.How is this message important to other patients diagnosed with cancer?
Salary Data. Many Web sites offer data on salaries in different careers. Find salary data for a career you are considering. What are the mean and median salaries for this career? How do these salaries compare with those of other careers that interest you?
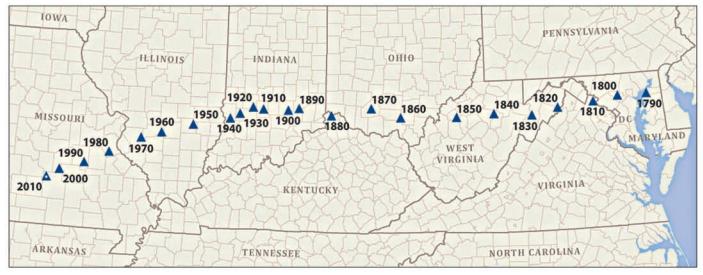
u.S. Population center. Imagine taking a huge flat map of the United States and placing weights on it to represent where people live. The point at which the map would balance is called the mean center of population. Figure 2 shows how the location of the mean center of population has shifted from
Phenotypes of Peas. An experiment was conducted to determine whether a deficiency of carbon dioxide in soil affects the phenotypes of peas. Listed below are the phenotype codes, where 1 = smooth yellow, 2 = smooth geen, 3 = wrinkled yellow, and 4 = wrinkled green. Can the measures of center be
gPA. One common system for computing a grade point average (GPA) assigns 4 points to an A, 3 points to a B, 2 points to a C, 1 point to a D, and 0 points to an F. What is the GPA of a student who gets an A in a 4-credit course, a B in each of two 3-credit courses, and a C in a 1-credit course?
Stockholder Voting. A small company has four stockholders. One stockholder has 400 shares, a second stockholder has 300 shares, a third stockholder has 200 shares, and the fourth stockholder has 100 shares. In a vote on a new advertising campaign, the first stockholder votes yes, and the other
Slugging Average. In addition to the batting average, another measure of hitting performance in baseball is called the slugging average. In finding a slugging average, a single is worth 1 point, a double is worth 2 points, a triple is worth 3 points, and a home run is worth 4 points. A player’s
batteries. A manufacturer uses two different production sites to make batteries for cell phones. There is a defect rate of 2%at one of the sites, and the defect rate at the other site is 4%.Does it follow that when the batteries from the two sites are combined, the overall rate of defects is 3%?
Averaging Averages. Suppose a player has a batting average over many games of 0.200 (he’s not very good). In his next game, he goes 2 for 4, which is a batting average of 0.500 for the game. Does it follow that his new batting average is 10.200 + 0.5002/2 = 0.350? Explain.
batting Average. A batting average in baseball is determined by dividing the total number of hits by the total number of at-bats (neglecting walks, sacrifices, and a few other special cases). A player goes 2 for 4 (2 hits in 4 at-bats) in the first game, 0 for 3 in the second game, and 3 for 5 in
Final grade. Your course grade is based on one midterm that counts as 15% of your final grade, one class project that counts as 20% of your final grade, a set of homework assignments that counts as 40% of your final grade, and a final exam that counts as 25% of your final grade. Your midterm score
Different Means? Each of the 300 students at a high school takes the same four courses. Three of the courses are each taught in 15 classes of 20 students each. The fourth course is taught in 3 classes of 100 students each. Find the mean class size experienced by each student. Find the mean class
Average confusion. An instructor has a first-period class with 25 students, and they had a mean score of 86% on the midterm exam. The second-period class has 30 students, and they had a mean score of 84% on the same exam. Does it follow that the mean score for both classes combined is 85%? Explain.
Average Peaches. A grocer has three baskets of peaches.One holds 50 peaches and weighs 18 pounds, one holds 55 peaches and weighs 22 pounds, and the third holds 60 peaches and weighs 24 pounds. What is the mean weight of all of the peaches combined? Explain.
comparing Averages. Suppose the National Basketball Association (NBA) reports that the average height of basketball players is 6’8”. As a coach, you know that the players on your starting lineup have heights of 6’5”, 6’6”, 6’6”, 7’0”, and 7’2”. Would you be justified in
comparing Averages. Suppose that school district officials claim that the average reading score for fourth-graders in the district is 73 (out of a possible 100). As a principal, you know that your fourth-graders had the following scores: 55, 60, 68, 70, 87, 88, 95.Would you be justified in claiming
raising your grade. Suppose you have scores of 60, 70, 65, 85, and 85 on exams in a sociology class.a. What is the mean of these scores?b. What score would you need on the next exam to have an overall mean of 75?c. If the maximum score on an exam is 100, what is the maximum mean score that you
raising your grade. Suppose you have scores of 80, 84, 87, and 89 on quizzes in a mathematics class.a. What is the mean of these scores?b. What score would you need on the next quiz to have an overall mean of 88?c. If the maximum score on a quiz is 100, is it possible to have a mean of 90 after the
outlier coke. Cans of regular Coca-Cola vary slightly in weight. Here are the measured weights of seven cans, in pounds:0.8161 0.8194 0.8165 0.8176 0.7901 0.8143 0.8126a. Find the mean and median of these weights.b. Which, if any, of these weights would you consider to be an outlier? Explain.c.
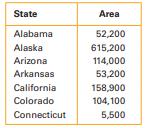
Alphabetic States. The following table gives the total area in square miles (land and water) of the seven states with names beginning with the letters A through C.a. Find the mean area and median area for these states.b. Which state is an outlier on the high end? If you eliminate this state, what
Quarters. Weights (in grams) of quarters in circulation:5.60 5.63 5.58 5.56 5.66 5.58 5.57 5.59 5.67 5.61 5.84 5.73 5.53 5.58 5.52 5.65 5.57 5.71 5.59 5.53 5.63 5.68 each list a set of numbers. In each case, find the mean, median, and mode of the listed numbers.
Weights of M&Ms. Weights (in grams) of randomly selected M&M plain candies:0.957 0.912 0.842 0.925 0.939 0.886 0.914 0.913 0.958 0.947 0.920 each list a set of numbers. In each case, find the mean, median, and mode of the listed numbers.
old Faithful geyser. Time intervals (in minutes) between eruptions of Old Faithful geyser in Yellowstone National Park:98 92 95 87 96 90 65 92 95 93 98 94 each list a set of numbers. In each case, find the mean, median, and mode of the listed numbers.
blood Alcohol. Blood alcohol concentrations of drivers involved in fatal crashes and then given jail sentences(based on data from the U.S. Department of Justice):0.27 0.17 0.17 0.16 0.13 0.24 0.29 0.24 0.14 0.16 0.12 0.16 each list a set of numbers. In each case, find the mean, median, and mode of
body Temperatures. Body temperatures (in degrees Fahrenheit) of randomly selected normal and healthy adults:98.6 98.6 98.0 98.0 99.0 98.4 98.4 98.4 98.4 98.6 each list a set of numbers. In each case, find the mean, median, and mode of the listed numbers.
Perception of Time. Actual times (in seconds) recorded when statistics students participated in an experiment to test their ability to determine when one minute (60 seconds) had passed:53 52 75 62 68 58 49 49 each list a set of numbers. In each case, find the mean, median, and mode of the listed
Space Shuttle Flights. Listed below are the durations (in hours) of a sample of all flights of NASA’s Space Transport System (space shuttle):73 95 235 192 165 262 191 376 259 235 381 331 221 244 0 each list a set of numbers. In each case, find the mean, median, and mode of the listed numbers.
Number of Words. Pages from Merriam-Webster’s Collegiate Dictionary, 11th edition, were randomly selected.Here are the numbers of words defined on those pages:51 63 36 43 34 62 73 39 53 79 each list a set of numbers. In each case, find the mean, median, and mode of the listed numbers.
Pulse rates. The average resting pulse rate of 500 randomly selected female statistics students list “averages” that someone might want to know. In each case, state whether the mean or median would give a better description of the “average.” Explain your reasoning.
Ages. The following ages (years) of survey respondents: 22, 19, 21, 27, “over 65,” “over 80”list “averages” that someone might want to know. In each case, state whether the mean or median would give a better description of the “average.” Explain your reasoning.
Salary. The average salary of all active professional basketball players list “averages” that someone might want to know. In each case, state whether the mean or median would give a better description of the “average.” Explain your reasoning.
height. The average height of all active professional basketball players list “averages” that someone might want to know. In each case, state whether the mean or median would give a better description of the “average.” Explain your reasoning.
Weighted Mean. A professor calculates final grades using a weighted mean in which the final exam counts twice as much as the midterm.decide whether the statement makes sense (or is clearly true) or does not make sense (or is clearly false). Explain clearly; not all of these statements have
Mean, Median, and Mode. A researcher studying an income distribution obtains the same value of $75,000 for the mean, median, and mode.decide whether the statement makes sense (or is clearly true) or does not make sense (or is clearly false). Explain clearly; not all of these statements have
Mode. A data set of incomes has modes of $50,000 and$80,000.decide whether the statement makes sense (or is clearly true) or does not make sense (or is clearly false). Explain clearly; not all of these statements have definitive answers, so your explanation is more important than your chosen answer.
Mean. The number on the jersey of each New York Giants football player is recorded, then the mean of those numbers is computed.decide whether the statement makes sense (or is clearly true) or does not make sense (or is clearly false). Explain clearly; not all of these statements have definitive
Is the result the mean income for the United States? Why or why not?
Mean Income. An economist wants to find the mean annual income for all adults in the United States. She knows that it is not practical to survey each member of the adult population, so she refers to an almanac and finds the mean income listed for each of the 50 states. She adds the 50 state means
outlier. For the same statistics class described in Exercise 2, is the executive secretary’s salary an outlier? Why or why not? In general, is an outlier defined in an exact way so that it can be clearly and objectively identified?
Mean and Median. A statistics class consists of 24 students, all but one of whom are unemployed or are employed in low-paying part-time jobs. One student works as an executive secretary earning $75,000 per year. Which does a better job of describing the income of a typical student in the class: the
Average and Mean. Do the terms “average” and “mean”have the same meaning? Explain.
The graphs in Figure 46 summarize a great deal of scientific data. How important are clear graphics to our understanding of these data? Defend your opinion.
Find the latest data for the atmospheric carbon dioxide concentration. Is the level still rising? How fast is it rising?
Discuss some of the factors that will affect the future concentration of carbon dioxide in the atmosphere. What do you think should be done to slow or stop the growth in the carbon dioxide concentration?
In the past, a carbon dioxide concentration of 300 parts per million accompanied global average temperatures as much as about 9°F (5°C) higher than the global average temperature today. What do you think would happen if Earth’s temperature rose that much over the next century? Is that a
Study Figure 46 carefully. How does the carbon dioxide concentration today compare to that of 1750? How does that of 1750 compare to that during the past 800,000 years? What conclusions can you draw from your answers to these questions?
Discuss how you might make a similar graph for some other historical or political event.
Note that this graph plots six variables: two variables of direction (north-south and east-west), the size of the army, the location of the army, the direction of the army’s movement, and temperatures during the retreat. Do you think Minard could have gotten the point across with fewer variables?
Discuss how this graph helps to overcome the impersonal nature of the many deaths in a war. What kind of impact does it have on you personally?
In one county, the cost of snow removal tripled from 1980 to the current year. Why is it misleading to represent the amounts with images of two rectangular snowplows if the second is three times as wide and three times as tall as the first snowplow?
Identify the values represented by the following stemplot:0 0 1 1 1 0 1 2 34 9 9
Construct a dotplot representing these six IQ scores: 90, 95, 95, 100, 105, 110.
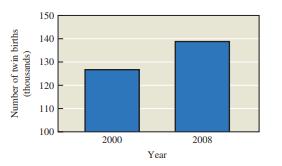
The bar chart in Figure 44 depicts the number of twin births in the United States in the years 2000 and 2008. In what way is this graph misleading? Number of twin births (thousands) 150 140 100 2000 2008 Year
The third class in a frequency table is 40–49 and the corresponding cumulative frequency is 80.What does the value of 80 indicate?
The first class in a relative frequency table is 20–29 and the corresponding relative frequency is 0.25. What does the value of 0.25 indicate?
The first class in a frequency table is 20–29 and the corresponding frequency is 15.What does the value of 15 indicate?
A stemplot is created from the intervals (min) between eruptions of the Old Faithful geyser in Yellowstone National Park, and one row of that stemplot is 6 1222279.Identify the values represented by that row.
As a quality control manager at Sony, you find that defective CDs have various causes, including worn machinery, human error, bad supplies, and packaging mistreatment.Which of the following graphs would be best for describing the causes of defects: histogram, bar chart, Pareto chart, dotplot, or
The IQ scores of 500 college football players are randomly selected. Which graph would be most appropriate for these data: histogram, bar chart, pie chart, multiple bar graph, or stack plot?
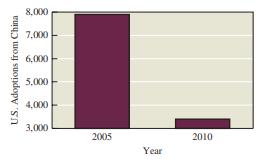
bar Chart. Figure 43 shows the numbers of U.S. adoptions from China in the years 2005 and 2010. What is wrong with this graph? Draw a graph that depicts the data in a fair and objective way. US. Adoptions from China 8,000 7,000 6,000- 5,000 4,000- 3,000 2005 2010 Year
Showing 2100 - 2200
of 5397
First
15
16
17
18
19
20
21
22
23
24
25
26
27
28
29
Last
Step by Step Answers