New Semester
Started
Get
50% OFF
Study Help!
--h --m --s
Claim Now
Question Answers
Textbooks
Find textbooks, questions and answers
Oops, something went wrong!
Change your search query and then try again
S
Books
FREE
Study Help
Expert Questions
Accounting
General Management
Mathematics
Finance
Organizational Behaviour
Law
Physics
Operating System
Management Leadership
Sociology
Programming
Marketing
Database
Computer Network
Economics
Textbooks Solutions
Accounting
Managerial Accounting
Management Leadership
Cost Accounting
Statistics
Business Law
Corporate Finance
Finance
Economics
Auditing
Tutors
Online Tutors
Find a Tutor
Hire a Tutor
Become a Tutor
AI Tutor
AI Study Planner
NEW
Sell Books
Search
Search
Sign In
Register
study help
business
nonparametric statistical inference
Statistical Reasoning For Everyday Life 4th Edition Jeffrey Bennett - Solutions
Discuss some of the common uses of IQ tests. Do you think that IQ tests should be used for these purposes?Does the Flynn effect alter your thoughts about the uses of IQ tests? Explain.
Results on IQ tests tend to differ among different ethnic groups. Some people have used this fact to argue that some ethnic groups tend to be intellectually superior to others. Can such an argument still be supported in light of the Flynn effect? Defend your opinion.
The rise in performance on IQ tests contrasts sharply with a steady decline in performance over the past few decades on many tests that measure factual knowledge, such as the SAT. Think of several possible ways to explain these contrasting results, and form an opinion as to the most likely
Which explanation do you favor for the Flynn effect: that people are getting smarter or that people are getting more practice at the skills measured on IQ tests? Defend your opinion.
Notice that scores for males have been consistently higher than scores for females. Why do you think this is the case? Do you think that changes in our education system could eliminate this gap? Defend your opinions.
The downward trend in verbal skills was a major reason why the College Board added the writing test in 2006.The hope was that adding the new test would cause students to focus more on writing in high school and therefore improve both in writing and in overall verbal abilities. What do you think of
Do you think that comparisons of SAT scores over two years are meaningful? Over 10 years? Do you agree that the long-term trends indicate that students today have poorer verbal skills but better mathematical skills than those of a few decades ago? Defend your opinions.
Aside from the small number of common questions that link one year to the next, the test changes every year. Can test scores from one year legitimately be compared to scores in other years?
Are trends among the sample of high school students who take the SAT representative of trends for the population of all high school students?
Which of the following is likely to have a distribution that is closest to a normal distribution?a. The outcomes that occur when a single die is rolled many timesb. The outcomes that occur when two dice are rolled many times and the mean is computed each timec. The outcomes that occur when five
A population is normally distributed with a mean of 850 and a standard deviation of 49.Find the percentage of scores between 801 and 948.
A population is normally distributed with a mean of 850 and a standard deviation of 49.If 2.28% of the scores are less than 752, what percentage of scores are greater than 752?
A population is normally distributed with a mean of 850 and a standard deviation of 49.What percentage of scores are greater than 801?
A population is normally distributed with a mean of 850 and a standard deviation of 49.What is the standard z-score corresponding to 801?
A population is normally distributed with a mean of 850 and a standard deviation of 49, and samples of size 100 are randomly selected. What is the standard deviation of the sample means?
A population is normally distributed with a mean of 850 and a standard deviation of 49, and samples of size 100 are randomly selected. What is the mean of the sample means?
Car seat belts are tested for strength, and it is found that the results are normally distributed with a mean of 2,400 lb and a standard deviation of 400 lb. Use Table 1 to find the percentage of scores between 1,600 lb and 3,200 lb.
Car seat belts are tested for strength, and it is found that the results are normally distributed with a mean of 2,400 lb and a standard deviation of 400 lb. Using the 68-95-99.7 rule, find the percentage of scores between 1,600 lb and 3,200 lb.
Which of the following statements are correct?a. A normal distribution is any distribution that typically occurs.b. The graph of a normal distribution is bell-shaped.c. The graph of a normal distribution has one mode.d. In a normal distribution, the mean and median are equal.e. In a normal
Dice rolling. Demonstrate the Central Limit Theorem using dice, as discussed in this section. Give each person in your class as many dice as possible. Begin by rolling one die and making a histogram of the outcomes. Then let every person roll two dice and make a histogram of the mean for each roll.
The Quincunx on the Internet. Do an Internet search on “central limit theorem” or “quincunx” and find a site that has an animated demonstration of the quincunx (or Galton’s board). Describe the quincunx and explain how it illustrates the Central Limit Theorem.
Central Limit Theorem on the Internet. Doing an Internet search on “central limit theorem” will uncover many sites devoted to this subject. Find a site that has animated demonstrations of the Central Limit Theorem. Describe in your own words what you observed and how it illustrates the Central
Blood Pressure in Women. Systolic blood pressure for women between the ages of 18 and 24 is normally distributed with a mean of 114.8 (millimeters of mercury) and a standard deviation of 13.1.a. What is the likelihood that an individual woman has a blood pressure above 125?b. Suppose a random
Kindergarten Desks. In designing new desks for an incoming class of 25 kindergarten girls, an important characteristic of the desks is that they must accommodate the sitting heights of those students. (The sitting height is the height of a seated student measured from the bottom of the feet to the
aircraft safety standards. Federal Aviation Administration rules require airlines to estimate the weight of a passenger as 195 pounds, including carry-on baggage. Men have weights(without baggage) that are normally distributed with a mean of 172 pounds and a standard deviation of 29 pounds.a. If
Vending machines. Currently, quarters have weights that are normally distributed with a mean of 5.670 grams and a standard deviation of 0.062 gram. A vending machine is configured to accept only those quarters with weights between 5.550 grams and 5.790 grams.a. If 280 different quarters are
Labeling of m&m Packages. M&M plain candies have weights that are normally distributed with a mean weight of 0.8565 gram and a standard deviation of 0.0518 gram (based on measurements from one of the authors). A random sample of 100 M&M candies is obtained from a package containing 465 candies; the
redesign of Ejection seats. When women were allowed to become pilots of fighter jets, engineers needed to redesign the ejection seats because they had been designed for men only. The ACES-II ejection seats were designed for men weighing between 140 pounds and 211 pounds. The population of women has
staying out of hot Water. In planning for hot water requirements, the manager of the Luxurion Hotel finds that guests spend a mean of 11.4 minutes each day in the shower (based on data from the Opinion Research Corporation). Assume that the shower times are normally distributed with a standard
Designing motorcycle helmets. Engineers must consider the breadths of male heads when designing motorcycle helmets for men. Men have head breadths that are normally distributed with a mean of 6.0 inches and a standard deviation of 1.0 inch (based on anthropometric survey data from Gordon, Churchill
Designing strobe Lights. An aircraft strobe light is designed so that the times between flashes are normally distributed with a mean of 3.00 seconds and a standard deviation of 0.40 second.a. What is the likelihood that an individual time is greater than 4.00 seconds?b. What is the likelihood that
amounts of Cola. Assume that cans of cola are filled so that the actual amounts are normally distributed with a mean of 12.00 ounces and a standard deviation of 0.11 ounce.a. What is the likelihood that a sample of 36 cans will have a mean amount of at least 12.05 ounces?b. Given the result in
What percentage of individual men have weights between 176 lb and 185 lb? If samples of 25 men are randomly selected and the mean weight is computed for each sample, what percentage of sample means is between 176 lb and 185 lb?assume that weights of men are normally distributed with a mean of 170
What percentage of individual men have weights between 164 lb and 176 lb? If samples of 100 men are randomly selected and the mean weight is computed for each sample, what percentage of sample means is between 164 lb and 176 lb?assume that weights of men are normally distributed with a mean of 170
What percentage of individual men have weights greater than 167 lb? If samples of 100 men are randomly selected and the mean weight is computed for each sample, what percentage of the sample means are greater than 167 lb?assume that weights of men are normally distributed with a mean of 170 lb and
What percentage of individual men have weights less than 185 lb? If samples of 36 men are randomly selected and the mean weight is computed for each sample, what percentage of the sample means are less than 185 lb?assume that weights of men are normally distributed with a mean of 170 lb and a
Ten-sided Dice and the Central Limit Theorem. Rolling a fair 10-sided die produces a uniformly distributed set of numbers between 1 and 10 with a mean of 5.5 and a standard deviation of 2.872. Assume that n 10-sided dice are rolled many times and the mean of the n outcomes is computed each time.a.
Twelve-sided Dice and the Central Limit Theorem. Rolling a fair 12-sided die produces a uniformly distributed set of numbers between 1 and 12 with a mean of 6.5 and a standard deviation of 3.452. Assume that n 12-sided dice are rolled many times and the mean of the n outcomes is computed each
saT scores and the Central Limit Theorem. Based on data from the College Board, assume that SAT scores are normally distributed with a mean of 1518 and a standard deviation of 325.Assume that many samples of size n are taken from a large population of students and the mean SAT score is computed for
IQ scores and the Central Limit Theorem. IQ scores are normally distributed with a mean of 100 and a standard deviation of 16.Assume that many samples of size n are taken from a large population of people and the mean IQ score is computed for each sample.a. If the sample size is n = 64, find the
Central Limit Theorem. The population of unemployed adults has ages with mean m and standard deviation s.Samples of unemployed adults are randomly selected so that there are exactly 100 in each sample. For each sample, the mean age is computed. What does the Central Limit Theorem tell us about the
Central Limit Theorem. A process consists of repeating this operation: Randomly select two values from a normally distributed population and then find the mean of the two values. Will the sample means be normally distributed, even though each sample has only two values?
Notation. In this section, it was noted that the standard deviation of sample means is s/1n. In that expression, what does s represent and what does n represent?
Texas Lottery. In each drawing for the Texas Pick 3 lottery, 3 digits between 0 and 9 (inclusive) are randomly selected.What is the distribution of the selected digits? If the mean is calculated for each drawing, can the distribution of the sample means be treated as a normal distribution?
Estimating a minute. Ask survey subjects to estimate 1 minute without looking at a watch or clock. Each subject should say “go” at the beginning of the minute and then “stop” when he or she thinks that 1 minute has passed. (Alternatively, you could repeatedly time yourself by looking away
Normal Distribution Demonstrations on the Web. Do an Internet search on the keywords “normal distribution” and find an animated demonstration of the normal distribution.Describe how the demonstration works and the useful features that you observed.
movie Lengths. Based on a random sample of movie lengths, the mean length is 110.5 minutes with a standard deviation of 22.4 minutes. Assume that movie lengths are normally distributed.a. What fraction of movies are more than 2 hours long?b. What fraction of movies are less than 11 2 hours long?c.
Being a marine. According to data from the National Health Survey, the heights of adult men are normally distributed with a mean of 69.0 inches and a standard deviation of 2.8 inches. The U.S. Marine Corps requires that men have heights between 64 inches and 78 inches. What percentage of American
spelling Bee scores. At the district spelling bee, the 60 girls have a mean score of 71 points with a standard deviation of 6, while the 50 boys have a mean score of 66 points with a standard deviation of 5 points. Those students with a score greater than 75 are eligible to go to the state spelling
Calibrating Barometers. Researchers for a manufacturer of barometers (devices to measure atmospheric pressure)read each of 50 barometers at the same time of day. The mean of the readings is 30.4 (inches of mercury) with a standard deviation of 0.23 inch, and the readings appear to be normally
GrE scores. Assume that the scores on the Graduate Record Exam (GRE) are normally distributed with a mean of 497 and a standard deviation of 115.a. A graduate school requires a GRE score of 650 for admission. To what percentile does this correspond?b. A graduate school requires a GRE score in the
saT scores. Based on data from the College Board, SAT scores are normally distributed with a mean of 1518 and a standard deviation of 325.a. Find the percentage of SAT scores greater than 2000b. Find the percentage of SAT scores less than 1500.c. Find the percentage of SAT scores between 1600 and
Pregnancy Lengths. Lengths of pregnancies are normally distributed with a mean of 268 days and a standard deviation of 15 days.a. What is the percentage of pregnancies that last less than 250 days?b. What is the percentage of pregnancies that last more than 300 days?c. If a birth is considered
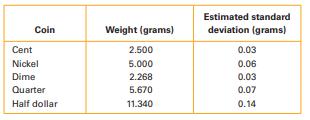
Coin Weights. Consider the following table, showing the official mean weight and estimated standard deviation for five U.S. coins. Suppose a vending machine is designed to reject all coins with weights more than 2 standard deviations above or below the mean. For each coin, find the range of weights
The percentage of heights between 146 centimeters and 156 centimeters use the normal distribution of heights of adult women, which has a mean of 162 centimeters and a standard deviation of 6 centimeters. Use Table 1 to find the indicated quantities. Note: Table 1 shows standard scores from -3.5 to
The percentage of heights between 148 centimeters and 170 centimeters use the normal distribution of heights of adult women, which has a mean of 162 centimeters and a standard deviation of 6 centimeters. Use Table 1 to find the indicated quantities. Note: Table 1 shows standard scores from -3.5 to
The percentage of heights between 159 centimeters and 165 centimeters use the normal distribution of heights of adult women, which has a mean of 162 centimeters and a standard deviation of 6 centimeters. Use Table 1 to find the indicated quantities. Note: Table 1 shows standard scores from -3.5 to
The percentage of heights between 156 centimeters and 168 centimeters use the normal distribution of heights of adult women, which has a mean of 162 centimeters and a standard deviation of 6 centimeters. Use Table 1 to find the indicated quantities. Note: Table 1 shows standard scores from -3.5 to
The percentage of heights greater than 179 centimeters use the normal distribution of heights of adult women, which has a mean of 162 centimeters and a standard deviation of 6 centimeters. Use Table 1 to find the indicated quantities. Note: Table 1 shows standard scores from -3.5 to +3.5. In these
The percentage of heights less than 144 centimeters use the normal distribution of heights of adult women, which has a mean of 162 centimeters and a standard deviation of 6 centimeters. Use Table 1 to find the indicated quantities. Note: Table 1 shows standard scores from -3.5 to +3.5. In these
The percentage of heights less than 147 centimeters use the normal distribution of heights of adult women, which has a mean of 162 centimeters and a standard deviation of 6 centimeters. Use Table 1 to find the indicated quantities. Note: Table 1 shows standard scores from -3.5 to +3.5. In these
The percentage of heights less than 177 centimeters use the normal distribution of heights of adult women, which has a mean of 162 centimeters and a standard deviation of 6 centimeters. Use Table 1 to find the indicated quantities. Note: Table 1 shows standard scores from -3.5 to +3.5. In these
The percentage of heights greater than 171 centimeters use the normal distribution of heights of adult women, which has a mean of 162 centimeters and a standard deviation of 6 centimeters. Use Table 1 to find the indicated quantities. Note: Table 1 shows standard scores from -3.5 to +3.5. In these
The percentage of heights greater than 156 centimeters use the normal distribution of heights of adult women, which has a mean of 162 centimeters and a standard deviation of 6 centimeters. Use Table 1 to find the indicated quantities. Note: Table 1 shows standard scores from -3.5 to +3.5. In these
The percentage of heights less than 168 centimeters use the normal distribution of heights of adult women, which has a mean of 162 centimeters and a standard deviation of 6 centimeters. Use Table 1 to find the indicated quantities. Note: Table 1 shows standard scores from -3.5 to +3.5. In these
The percentage of heights greater than 162 centimeters use the normal distribution of heights of adult women, which has a mean of 162 centimeters and a standard deviation of 6 centimeters. Use Table 1 to find the indicated quantities. Note: Table 1 shows standard scores from -3.5 to +3.5. In these
Percentage of scores between 76 and 108 use the normal distribution of IQ scores, which has a mean of 100 and a standard deviation of 16.Use Table 1 to find the indicated quantities. Note:Table 1 shows standard scores from -3.5 to +3.5. In these problems, for standard scores above 3.5, use a
Percentage of scores between 52 and 116 use the normal distribution of IQ scores, which has a mean of 100 and a standard deviation of 16.Use Table 1 to find the indicated quantities. Note:Table 1 shows standard scores from -3.5 to +3.5. In these problems, for standard scores above 3.5, use a
Percentage of scores between 68 and 132 use the normal distribution of IQ scores, which has a mean of 100 and a standard deviation of 16.Use Table 1 to find the indicated quantities. Note:Table 1 shows standard scores from -3.5 to +3.5. In these problems, for standard scores above 3.5, use a
Percentage of scores between 84 and 116 use the normal distribution of IQ scores, which has a mean of 100 and a standard deviation of 16.Use Table 1 to find the indicated quantities. Note:Table 1 shows standard scores from -3.5 to +3.5. In these problems, for standard scores above 3.5, use a
Percentage of scores greater than 148 use the normal distribution of IQ scores, which has a mean of 100 and a standard deviation of 16.Use Table 1 to find the indicated quantities. Note:Table 1 shows standard scores from -3.5 to +3.5. In these problems, for standard scores above 3.5, use a
Percentage of scores greater than 76 use the normal distribution of IQ scores, which has a mean of 100 and a standard deviation of 16.Use Table 1 to find the indicated quantities. Note:Table 1 shows standard scores from -3.5 to +3.5. In these problems, for standard scores above 3.5, use a
Percentage of scores less than 92 use the normal distribution of IQ scores, which has a mean of 100 and a standard deviation of 16.Use Table 1 to find the indicated quantities. Note:Table 1 shows standard scores from -3.5 to +3.5. In these problems, for standard scores above 3.5, use a percentile
Percentage of scores less than 132 use the normal distribution of IQ scores, which has a mean of 100 and a standard deviation of 16.Use Table 1 to find the indicated quantities. Note:Table 1 shows standard scores from -3.5 to +3.5. In these problems, for standard scores above 3.5, use a percentile
Percentage of scores greater than 108 use the normal distribution of IQ scores, which has a mean of 100 and a standard deviation of 16.Use Table 1 to find the indicated quantities. Note:Table 1 shows standard scores from -3.5 to +3.5. In these problems, for standard scores above 3.5, use a
Percentage of scores less than 68 use the normal distribution of IQ scores, which has a mean of 100 and a standard deviation of 16.Use Table 1 to find the indicated quantities. Note:Table 1 shows standard scores from -3.5 to +3.5. In these problems, for standard scores above 3.5, use a percentile
Percentage of scores less than 116 use the normal distribution of IQ scores, which has a mean of 100 and a standard deviation of 16.Use Table 1 to find the indicated quantities. Note:Table 1 shows standard scores from -3.5 to +3.5. In these problems, for standard scores above 3.5, use a percentile
Percentage of scores greater than 100 use the normal distribution of IQ scores, which has a mean of 100 and a standard deviation of 16.Use Table 1 to find the indicated quantities. Note:Table 1 shows standard scores from -3.5 to +3.5. In these problems, for standard scores above 3.5, use a
applying the 68-95-99.7 rule. When designing the placement of a CD player in a new model car, engineers must consider the forward grip reach of the driver. Women have forward grip reaches that are normally distributed with a mean of 27.0 inches and a standard deviation of 1.3 inches (based on
applying the 68-95-99.7 rule. In a study of facial behavior, people in a control group are timed for eye contact in a 5-minute period. Their times are normally distributed with a mean of 184.0 seconds and a standard deviation of 55.0 seconds(based on data from “Ethological Study of Facial
Use the 68-95-99.7 rule to find the following values.a. Percentage of scores less than 50b. Percentage of scores less than 60c. Percentage of scores greater than 70d. Percentage of scores greater than 40e. Percentage of scores between 40 and 70 10.using the 68-95-99.7 rule. Assume the resting pulse
using the 68-95-99.7 rule. A test of depth perception is designed so that scores are normally distributed with a mean of 50 and a standard deviation of
saT scores. SAT scores are normally distributed with a mean of 1518 and a standard deviation of 325.decide whether the statement makes sense (or is clearly true) or does not make sense (or is clearly false). Explain clearly; not all of these have definitive answers, so your explanation is more
Depth Perception scores. Scores on a standard test of depth perception are normally distributed with two different modes.decide whether the statement makes sense (or is clearly true) or does not make sense (or is clearly false). Explain clearly; not all of these have definitive answers, so your
Birth Weights. Birth weights (in grams) in Lichtenstein are normally distributed with a mean of 3,420 g and a standard deviation of 0 g.decide whether the statement makes sense (or is clearly true) or does not make sense (or is clearly false). Explain clearly; not all of these have definitive
Test scores. Scores on a statistics test are normally distributed with a mean of 75 and a standard deviation of 75.decide whether the statement makes sense (or is clearly true) or does not make sense (or is clearly false). Explain clearly; not all of these have definitive answers, so your
z-scores and Percentages. Table 1 includes standard scores and percentiles. Can a z-score be a negative value?Can a percentile be a negative value? Explain.
Distributions. For rolling a die, the mean outcome is 3.5.Can we apply the 68-95-99.7 rule and conclude that 95% of all outcomes fall within 2 standard deviations of 3.5? Why or why not?
standard score. The standard score for the height of a male is z = -2. Is the height of this male above or below the mean height of all males? How many standard deviations away from the mean is this?
standard score. Men’s heights are normally distributed with a mean of 69.0 in. and a standard deviation of 2.8 in. What is the standard z-score for a man with a height of 69.0 in.?
Non-normal Distributions. Find two variables in news reports that you suspect do not have nearly normal distributions. Explain your reasoning
Normal Distributions. Rarely does a news article refer to the actual distribution of a variable or state that a variable is normally distributed. Nevertheless, variables mentioned in news reports must have some distribution. Find two variables in news reports that you suspect have nearly normal
movie Lengths. Collect data to support or refute the claim that movies have gotten shorter over the decades.Specifically, make a histogram of movie lengths for each decade from the 1940s through the present, find the mean movie length for each sample, and comment on whether these distributions are
Finding Normal Distributions. Using the guidelines given in the text, choose a variable that you think should be nearly normally distributed. Collect at least 30 data values for the variable and make a histogram. Comment on how closely the distribution fits a normal distribution. In what ways does
saT score Distributions. The College Board Web site gives the distribution of SAT scores (usually in 50-point bins). Collect these data and construct a histogram for each part of the test. Discuss the validity of the claim that SAT scores are normally distributed.
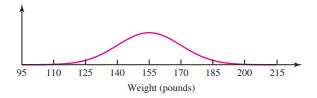
Estimating areas. Consider the graph of the normal distribution in Figure 15, which gives the relative frequencies in a distribution of body weights for a sample of male students.a. What is the mean of the distribution?b. Estimate (using area) the percentage of students whose weight is less than
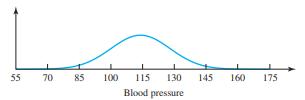
Estimating areas. Consider the graph of the normal distribution in Figure 14, which illustrates the relative frequencies in a distribution of systolic blood pressures for a sample of female students. The distribution has a standard deviation of 14.a. What is the mean of the distribution?b. Estimate
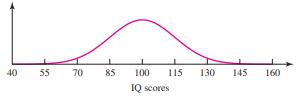
areas and relative Frequencies. Consider the graph of the normal distribution in Figure 13, which shows the relative frequencies in a distribution of IQ scores. The distribution has a mean of 100 and a standard deviation of 16.a. What is the total area under the curve?b. Estimate (using area) the
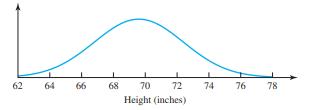
areas and relative Frequencies. Consider the graph of the normal distribution in Figure 12, which gives relative frequencies in a distribution of men’s heights. The distribution has a mean of 69.6 inches and a standard deviation of 2.8 inches.a. What is the total area under the curve?b. Estimate
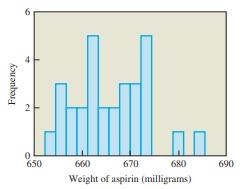
aspirin Weights. Figure 11 shows a histogram for the weights of 30 randomly selected aspirin tablets. The mean weight is 665.4 milligrams. Is this distribution close to normal? Should this variable have a normal distribution? Why or why not? Frequency 650 660 670 Weight of aspirin (milligrams) 680
Showing 1900 - 2000
of 5397
First
13
14
15
16
17
18
19
20
21
22
23
24
25
26
27
Last
Step by Step Answers