New Semester
Started
Get
50% OFF
Study Help!
--h --m --s
Claim Now
Question Answers
Textbooks
Find textbooks, questions and answers
Oops, something went wrong!
Change your search query and then try again
S
Books
FREE
Study Help
Expert Questions
Accounting
General Management
Mathematics
Finance
Organizational Behaviour
Law
Physics
Operating System
Management Leadership
Sociology
Programming
Marketing
Database
Computer Network
Economics
Textbooks Solutions
Accounting
Managerial Accounting
Management Leadership
Cost Accounting
Statistics
Business Law
Corporate Finance
Finance
Economics
Auditing
Tutors
Online Tutors
Find a Tutor
Hire a Tutor
Become a Tutor
AI Tutor
AI Study Planner
NEW
Sell Books
Search
Search
Sign In
Register
study help
business
nonparametric statistical inference
Statistical Reasoning For Everyday Life 4th Edition Jeffrey Bennett - Solutions
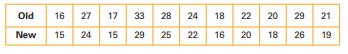
Estimate the value of the correlation coefficient. What does that value suggest?refer to the combined city–highway fuel economy ratings (mi/gal) for different cars. The old ratings are based on tests used before 2008 and the new ratings are based on tests that went into effect in 2008. Old 16 27
Construct a scatterplot. What does the result suggest?refer to the combined city–highway fuel economy ratings (mi/gal) for different cars. The old ratings are based on tests used before 2008 and the new ratings are based on tests that went into effect in 2008. Old 16 27 17 33 28 New 15 24 15 9 29
Legal Causation. Find a news report concerning an ongoing legal case, either civil or criminal, in which establishing causality is important to the outcome.Briefly describe the issue of causation in the case and how the ability to establish or refute causality will influence the outcome of the case.
Causation in the news. Find a recent news report in which a statistical study led to a conclusion of causation. Describe the study and the claimed causation. Do you think the claim of causation is legitimate? Explain.
Dietary Fiber and Coronary heart Disease. In the largest study of how dietary fiber prevents coronary heart disease (CHD) in women (Journal of the American Medical Association, Vol. 281, No. 21), researchers detected a reduced risk of CHD among women who have a high-fiber diet. Find the research
air Bags and Children. Starting from the Web site of the National Highway Traffic Safety Administration, research the latest studies on the safety of air bags, especially with regard to children. Write a short report summarizing your findings and offering recommendations for improving child safety
Vasectomies and Prostate Cancer. An article titled “Does Vasectomy Cause Prostate Cancer?” (Chance, Vol. 10, No. 1)reports on several large studies that found an increased risk of prostate cancer among men with vasectomies. In the absence of a direct cause, several researchers attribute the
gun Control. Those who favor gun control often point to a positive correlation between the availability of handguns and murder rates to support their position that gun control would save lives. Does this correlation, by itself, indicate that handgun availability causes a higher murder rate? Suggest
high-Voltage Power Lines. Suppose that people living near a high-voltage power line have a higher incidence of cancer than people living farther from the power line. Can you conclude that the high-voltage power line is the cause of the elevated cancer rate? If not, what other explanations might
older moms. A study reported in Nature claims that women who give birth later in life tend to live longer. Of the 78 women who were at least 100 years old at the time of the study, 19%had given birth after their 40th birthday. Of the 54 women who were 73 years old at the time of the study, only
Longevity of orchestra Conductors. A famous study in Forum on Medicine concluded that the mean lifetime of conductors of major orchestras was 73.4 years, about 5 years longer than that of all American males at the time.The author claimed that a life of music causes a longer life.Evaluate the claim
other Lung Cancer Causes. Several things besides smoking have been shown to be probabilistic causal factors in lung cancer. For example, exposure to asbestos and exposure to radon gas, both of which are found in many homes, can cause lung cancer. Suppose that you meet a person who lives in a home
Smoking and Lung Cancer. There is a strong correlation between tobacco smoking and incidence of lung cancer, and most physicians believe that tobacco smoking causes lung cancer. Yet, not everyone who smokes gets lung cancer. Briefly describe how smoking could cause cancer when not all smokers get
Identifying Causes: headaches. You are trying to identify the cause of late-afternoon headaches that plague you several days each week.For each of the following tests and observations, explain which of the six guidelines for establishing causality you used and what you concluded. Then summarize
IQ and Pulse rate. People with higher resting pulse rates (beats per minute) tend to have higher IQ scores.determine whether the stated causal connection is valid. If the causal connection appears to be valid, provide an explanation.
Drinking and reaction Time. Drinking greater amounts of alcohol decreases a person’s reaction time.determine whether the stated causal connection is valid. If the causal connection appears to be valid, provide an explanation.
magnet Treatment. Heart disease can be cured by wearing a magnetic bracelet on your wrist.determine whether the stated causal connection is valid. If the causal connection appears to be valid, provide an explanation.
Test grades. Test grades are affected by the amount of time and effort spent studying and preparing for the test.determine whether the stated causal connection is valid. If the causal connection appears to be valid, provide an explanation.
Smoking and Cotinine. When the body absorbs nicotine, it converts it into cotinine. Experiments have ruled out coincidence as an explanation for a correlation between exposure to second-hand smoke and cotinine in the body. The only possible explanations for that correlation are that the exposure
Smoking and Cotinine. A study showed that there is a correlation between exposure to second-hand smoke and the measured amount of cotinine in the body. We can establish that exposure to second-hand smoke is a cause of cotinine if we can rule out coincidence as a possible explanation of the
Value of r. A variable can have a direct causal effect on another variable only if the correlation coefficient is given by r = 1.decide whether the statement makes sense (or is clearly true) or does not make sense (or is clearly false). Explain clearly; not all of these statements have definitive
Value of r. When analyzing paired sample data, the value of the correlation coefficient r allows us to determine whether one variable has a direct causal effect on the other.decide whether the statement makes sense (or is clearly true) or does not make sense (or is clearly false). Explain clearly;
Correlation and Causality. What is the difference between finding a correlation between two variables and establishing causality between two variables?
Confounding Variable. What is a confounding variable?How can a confounding variable create a situation in which an underlying causality is hidden?
role of Experiments. In theory, we can use experiments to rule out two of the three different explanations for the presence of a correlation between two variables. Which of the three explanations do we not want to rule out? Why would we not want to rule it out?
Correlation. Identify three different explanations for the presence of a correlation between two variables.
your own multiple regression. Come up with an example from your own life or work in which a multiple regression analysis might reveal important trends. Without actually doing any analysis, describe in words what you would look for through the multiple regression and how the answers might be useful.
Best-Fit Line in the news. Although scatterplots are rare in the news, they are not unheard of. Find a scatterplot of any kind in a news article (recent or not).Draw a best-fit line by eye. Discuss what predictions, if any, can be made from your best-fit line.
Predictions in the news. Find a recent news report in which a correlation is used to make a prediction.Evaluate the validity of the prediction, considering all of the cautions described in this section. Overall, do you think the prediction is valid? Why or why not?
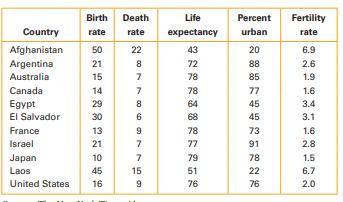
Worldwide Population Indicators. The following table gives five population indicators for eleven selected countries. Study these data and try to identify possible correlations. Doing additional research if necessary, discuss the possible correlations you have found, speculate on the reasons for the
asbestos. Research asbestos, its sources, and its effects.Discuss the correlations that have helped researchers understand adverse health effects from asbestos exposure.Discuss efforts to prevent those adverse health effects.
Lead Poisoning. Research lead poisoning, its sources, and its effects. Discuss the correlations that have helped researchers understand lead poisoning. Discuss efforts to prevent it.
Use both scatterplots for actual and predicted temperature in Figure 6.determine how much of the variation in the variable can be accounted for by the best-fit line.c. Briefly discuss whether you could make valid predictions from this best-fit line.
Use the scatterplot for number of farms and size of farms in Figure 5.determine how much of the variation in the variable can be accounted for by the best-fit line.c. Briefly discuss whether you could make valid predictions from this best-fit line.
Use the scatterplot for life expectancy and infant mortality in Figure 4.determine how much of the variation in the variable can be accounted for by the best-fit line.c. Briefly discuss whether you could make valid predictions from this best-fit line.
Use the scatterplot for color and price in Figure 2.determine how much of the variation in the variable can be accounted for by the best-fit line.c. Briefly discuss whether you could make valid predictions from this best-fit line.
old Faithful. Using paired sample data consisting of the duration time (in seconds) of eruptions of Old Faithful geyser and the time interval (in minutes) after the eruption, a value of r2 = 0.926 is calculated, indicating that about 93% of the variation in the interval after eruption can be
height and Weight. Using data from the National Health Survey, the equation of the best-fit line for women’s heights and weights is obtained, and it shows that a woman 120 inches tall is predicted to weigh 430 pounds.decide whether the statement makes sense (or is clearly true) or does not make
r 2 Value. A value of r2 = -0.040 is obtained from a sample of men, with each pair of data consisting of the height in inches and the SAT score for one man.decide whether the statement makes sense (or is clearly true) or does not make sense (or is clearly false). Explain clearly; not all of these
r 2 Value. A value of r2 = 1 is obtained from a sample of paired data with one variable representing the amount of gas (gallons) purchased and the total cost of the gas.decide whether the statement makes sense (or is clearly true) or does not make sense (or is clearly false). Explain clearly; not
regression. An investigator has data consisting of heights of daughters and the heights of the corresponding mothers and fathers. She wants to analyze the data to see the effect that the height of the mother and the height of the father has on the height of the daughter. Should she use a (linear)
r 2.For a study involving paired sample data, it is found that r = -0.4. What is the value of r 2? In general, what is r2 called, what does it measure, and how can it be interpreted? That is, what does its value tell us about the variables?
Best-Fit Line. What is a best-fit line (also called a regression line)? How is a best-fit line useful?
Well-Interpreted Correlations. Find a recent news report in which you believe that a correlation has been presented with a reasonable interpretation. Describe the correlation and the reported interpretation, and explain why you think the interpretation is valid.
misinterpreted Correlations. Find a recent news report in which you believe that a correlation may have been misinterpreted. Describe the correlation, the reported interpretation, and the problems you see in the interpretation.
real Correlations.a. Describe a real situation in which there is a positive correlation that is the result of coincidence.b. Describe a real situation in which there is a positive correlation that is the result of a common underlying cause.c. Describe a real situation in which there is a positive
Football-Stock update. Find data for recent years concerning the Super Bowl winner and the end-of-year change in the stock market (positive or negative). Do recent results still agree with the correlation described in Example 2?Explain.
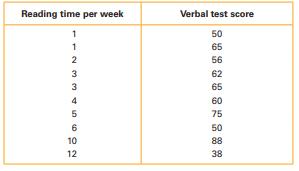
reading and Test Scores. The following (hypothetical)data set gives the number of hours 10 sixth-graders read per week and their performance on a standardized verbal test(maximum of 100).a. Construct a scatterplot for these data. Estimate or compute the correlation coefficient. Based on this
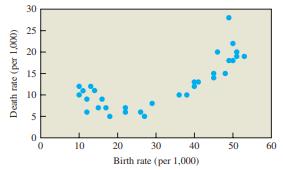
Birth and Death rates. Figure 17 shows the birth and death rates for different countries, measured in births and deaths per 1,000 population.a. Estimate the correlation coefficient and discuss whether there is a strong correlation between the variables.b. Notice that there appear to be two groups
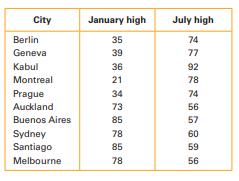
grouped Temperature Data. The following table shows the average January high temperature and the average July high temperature for 10 major cities around the world.a. Construct a scatterplot for the data. Estimate or compute the correlation coefficient. Based on this correlation coefficient, would
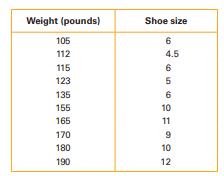
grouped Shoe Data. The following table gives measurements of weight and shoe size for 10 people (including both men and women).a. Construct a scatterplot for the data. Estimate or compute the correlation coefficient. Based on this correlation coefficient, would you conclude that shoe size and
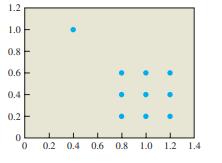
outlier Effects. Consider the scatterplot in Figure 16.a. Which point is an outlier? Ignoring the outlier, estimate or compute the correlation coefficient for the remaining points.b. Now include the outlier. How does the outlier affect the correlation coefficient? Estimate or compute the
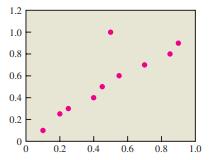
outlier Effects. Consider the scatterplot in Figure 15.a. Which point is an outlier? Ignoring the outlier, estimate or compute the correlation coefficient for the remaining points.b. Now include the outlier. How does the outlier affect the correlation coefficient? Estimate or compute the
melanoma and Latitude. Some studies have shown that, for certain ethnic groups, the incidence of melanoma (the most dangerous form of skin cancer) increases as latitude decreases.In each case, state the correlation clearly.(For example, we might state that “there is a positive correlation between
gas and Driving. It has been found that as gas prices increase, the distances vehicles are driven tend to get shorter.In each case, state the correlation clearly.(For example, we might state that “there is a positive correlation between variable A and variable B.”) Then state whether the
galaxies. Astronomers have discovered that, with the exception of a few nearby galaxies, all galaxies in the universe are moving away from us. Moreover, the farther the galaxy, the faster it is moving away. That is, the more distant a galaxy, the greater the speed at which it is moving away from
Traffic Lights and Car Crashes. It has been found that as the number of traffic lights increases, the number of car crashes also increases.In each case, state the correlation clearly.(For example, we might state that “there is a positive correlation between variable A and variable B.”) Then
Vehicles and Waiting Time. It has been found that as the number of registered vehicles increases, the time drivers spend sitting in traffic also increases.In each case, state the correlation clearly.(For example, we might state that “there is a positive correlation between variable A and variable
Study Time. Statistics students find that as they spend more time studying, their test scores are higher.In each case, state the correlation clearly.(For example, we might state that “there is a positive correlation between variable A and variable B.”) Then state whether the correlation is most
running and Weight. It has been found that people who exercise regularly by running tend to weigh less than those who do not run, and those who run longer distances tend to weigh less than those who run shorter distances.In each case, state the correlation clearly.(For example, we might state that
guns and Crime rate. In one state, the number of unregistered handguns steadily increased over the past several years, and the crime rate increased as well.
Causation. If we have two variables with one being the direct cause of the other, then there may or may not be a correlation between those two variables.decide whether the statement makes sense (or is clearly true) or does not make sense (or is clearly false). Explain clearly; not all of these
Causation. If we conduct a study showing that there is a strong negative correlation between resting pulse rate and amounts of time spent in rigorous exercise, we can conclude decreases in resting pulse rates are somehow associated with increases in exercise.decide whether the statement makes sense
Causation. If we have 20 pairs of sample data with a correlation coefficient of 1, then we know that one of the two variables is definitely the cause of the other.decide whether the statement makes sense (or is clearly true) or does not make sense (or is clearly false). Explain clearly; not all of
Scatterplot. A set of paired sample data results in a correlation coefficient of r = 0, so the scatterplot will show that there is no pattern of the plotted points.decide whether the statement makes sense (or is clearly true) or does not make sense (or is clearly false). Explain clearly; not all of
Scatterplot. Does a scatterplot reveal anything about a cause and effect relationship between two variables?
outliers. When studying salaries paid to CEOs of large companies, it is found that almost all of them range from a few hundred thousand dollars to several million dollars, but one CEO is paid a salary of $1. Is that salary of $1 an outlier? In general, how might outliers affect conclusions about
SIDS. An article in the New York Times on infant deaths included a statement that, based on the study results, putting infants to sleep in the supine position decreased deaths due to SIDS (sudden infant death syndrome). What is wrong with that statement?
Correlation and Causality. In clinical trials of the drug Lisinopril, it is found that increased dosages of the drug correlated with lower blood pressure levels. Based on the correlation, can we conclude that Lisinopril treatments cause lower blood pressure? Why or why not?
your own negative Correlations. Give examples of two variables that you expect to be negatively correlated. Explain why the variables are correlated and why the correlation is (or is not) important.
your own Positive Correlations. Give examples of two variables that you expect to be positively correlated. Explain why the variables are correlated and why the correlation is (or is not) important.
Correlations in the news. Find a recent news report that discusses some type of correlation. Describe the correlation. Does the article give any sense of the strength of the correlation? Does it suggest that the correlation reflects any underlying causality? Briefly discuss whether you believe the
height and Pulse rate. Select a sample of at least eight people and record each person’s pulse rate by counting the number of heartbeats in 1 minute. Also record each person’s height. Using the paired sample data, construct a scatterplot and estimate or calculate the value of the correlation
height and arm Span. Select a sample of at least eight people and measure each person’s height and arm span.(When you measure arm span, the person should stand with arms extended like the wings on an airplane.) Using the paired sample data, construct a scatterplot and estimate or calculate the
Statistical abstract. Explore the “frequently requested tables” at the Web site for the Statistical Abstract of the United States. Choose data that are of interest to you and explore at least two correlations. Briefly discuss what you learn from the correlations.
Success in the nFL. Find last season’s NFL team statistics. Construct a table showing the following for each team:number of wins, average yards gained on offense per game, and average yards allowed on defense per game. Make scatterplots to explore the correlations between offense and wins and
unemployment and Inflation. Use the Bureau of Labor Statistics Web page to find monthly unemployment rates and inflation rates over the past year. Construct a scatterplot for the data. Do you see any trends?
Changing units of measurement. The correlation coefficient remains unchanged if we change the units used to measure x, y, or both.determine whether the given property is true, and explain your answer.
Interchanging Variables. The correlation coefficient remains unchanged if we interchange the variables x and y.determine whether the given property is true, and explain your answer.
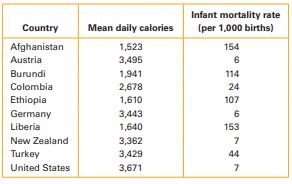
Calories and Infant mortality. Consider the following table showing mean daily caloric intake (all residents) and infant mortality rate (per 1,000 births) for 10 countries.a. Construct a scatterplot for the data.b. Briefly characterize the correlation in words and estimate the correlation
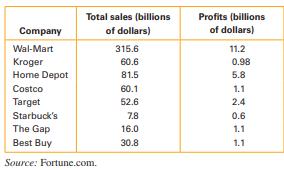
retail Sales. Consider the following table showing one year’s total sales (revenue) and profits for eight large retailers in the United States.a. Construct a scatterplot for the data.b. Briefly characterize the correlation in words and estimate the correlation coefficient.c. Discuss your
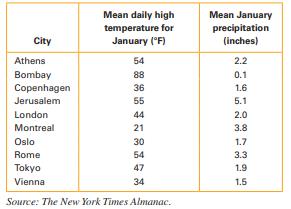
January Weather. Consider the following table showing January mean monthly precipitation and mean daily high temperature for ten Northern Hemisphere cities (National Oceanic and Atmospheric Administration).a. Construct a scatterplot for the data.b. Briefly characterize the correlation in words and
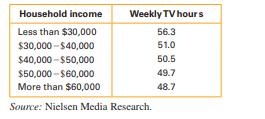
TV Time. Consider the following table showing the average hours of television watched in households in five categories of annual income.a. Construct a scatterplot for the data. To locate the dots, use the midpoint of each income category. Use a value of $25,000 for the category “less than
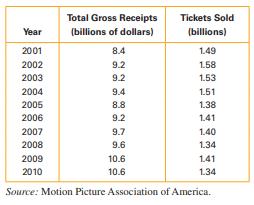
movie Data. Consider the following table showing total box office receipts and total attendance for all American films.a. Construct a scatterplot of the data.b. Briefly characterize the correlation in words and estimate the correlation coefficient. 2001 Year Total Gross Receipts (billions of
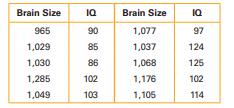
Brain Size and Intelligence. The table below lists brain sizes (in cm3) and Wechsler IQ scores of subjects (based on data from “Brain Size, Head Size, and Intelligence Quotient in Monozygatic Twins,” by Tramo et al, Neurology, Vol. 50, No. 5). Is there sufficient evidence to conclude that there
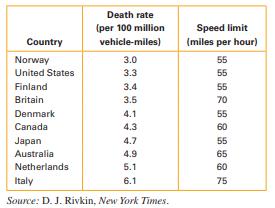
Safe Speeds? Consider the following table showing speed limits and death rates from automobile accidents in selected countries.a. Construct a scatterplot of the data.b. Briefly characterize the correlation in words (for example, strong positive correlation, weak negative correlation) and estimate
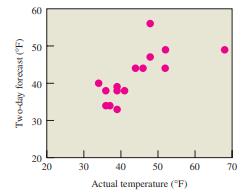
Two-Day Forecast. Figure 8 shows a scatterplot in which the actual high temperature for the day is compared with a forecast made two days in advance. Estimate the correlation coefficient and discuss what these data imply about weather forecasts. Do you think you would get similar results if you
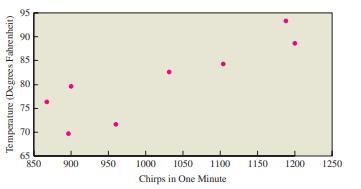
Crickets and Temperature. One classic application of correlation involves the association between the temperature and the number of times a cricket chirps in a minute. The scatterplot in Figure 7 shows the relationship for eight different pairs of temperature/chirps data. Estimate the correlation
golf Score/Prize money. Golf scores and prize money won by professional golfers For each pair, state whether you believe the two variables are correlated. If you believe they are correlated, state whether the correlation is positive or negative. Explain your reasoning.
height/SaT Score. The heights and SAT scores of randomly selected subjects who take the SAT For each pair, state whether you believe the two variables are correlated. If you believe they are correlated, state whether the correlation is positive or negative. Explain your reasoning.
altitude/Temperature. The outside air temperature and the altitude of aircraft For each pair, state whether you believe the two variables are correlated. If you believe they are correlated, state whether the correlation is positive or negative. Explain your reasoning.
Points and DJIa. The total number of points scored in Super Bowl football games and the changes in the Dow Jones Industrial stock index in the years following those games For each pair, state whether you believe the two variables are correlated. If you believe they are correlated, state whether the
Weight/Fuel Consumption. The total weights of airliners flying from New York to San Francisco and the total amounts of fuel that they consume For each pair, state whether you believe the two variables are correlated. If you believe they are correlated, state whether the correlation is positive or
Weight/Fuel Efficiency. The total weights of airliners flying from New York to San Francisco and the fuel efficiency as measured in miles per gallon For each pair, state whether you believe the two variables are correlated. If you believe they are correlated, state whether the correlation is
IQ/hat Size. The IQ scores and hat sizes of randomly selected adults For each pair, state whether you believe the two variables are correlated. If you believe they are correlated, state whether the correlation is positive or negative. Explain your reasoning.
Weight/Cost. The weights and costs of 50 different bags of apples For each pair, state whether you believe the two variables are correlated. If you believe they are correlated, state whether the correlation is positive or negative. Explain your reasoning.
Interpreting r. In investigating correlations between many different pairs of variables, in each case the correlation coefficient r must fall between-1 and 1.decide whether the statement makes sense (or is clearly true) or does not make sense (or is clearly false). Explain clearly; not all of these
Correlation. Two studies both found a correlation between low birth weight and weakened immune systems. The second study had a much larger sample size, so the correlation it found must be stronger.decide whether the statement makes sense (or is clearly true) or does not make sense (or is clearly
Positive Effect. An engineer for a car company finds that by reducing the weights of various cars, mileage (mi/gal)increases. Because this is a positive result, we say that there is a positive correlation.decide whether the statement makes sense (or is clearly true) or does not make sense (or is
Births. A study showed that for one town, as the stork population increased, the number of births in the town also increased. It therefore follows that the increase in the stork population caused the number of births to increase.decide whether the statement makes sense (or is clearly true) or does
Showing 1600 - 1700
of 5397
First
10
11
12
13
14
15
16
17
18
19
20
21
22
23
24
Last
Step by Step Answers