New Semester
Started
Get
50% OFF
Study Help!
--h --m --s
Claim Now
Question Answers
Textbooks
Find textbooks, questions and answers
Oops, something went wrong!
Change your search query and then try again
S
Books
FREE
Study Help
Expert Questions
Accounting
General Management
Mathematics
Finance
Organizational Behaviour
Law
Physics
Operating System
Management Leadership
Sociology
Programming
Marketing
Database
Computer Network
Economics
Textbooks Solutions
Accounting
Managerial Accounting
Management Leadership
Cost Accounting
Statistics
Business Law
Corporate Finance
Finance
Economics
Auditing
Tutors
Online Tutors
Find a Tutor
Hire a Tutor
Become a Tutor
AI Tutor
AI Study Planner
NEW
Sell Books
Search
Search
Sign In
Register
study help
business
nonparametric statistical inference
Statistical Reasoning For Everyday Life 4th Edition Jeffrey Bennett - Solutions
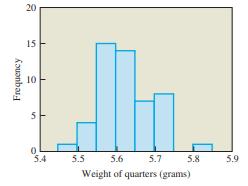
Quarter Weights. Figure 10 shows a histogram for the weights of 50 randomly selected quarters. The mean weight is 5.62 grams. Is this distribution close to normal? Should this variable have a normal distribution? Why or why not? Frequency 20 15 10 5. 0 5.4 5.5 5.6 5.7 Weight of quarters (grams) 5.8
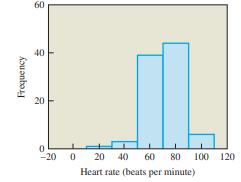
Pulse rates. Figure 9 shows a histogram for the pulse rates of 98 students. The mean pulse rate is 71.2 beats per minute. Is this distribution close to normal? Should this variable have a normal distribution? Why or why not? 20 Frequency 20 40 60 0 -20 0 20 40 60 80 100 120 Heart rate (beats per
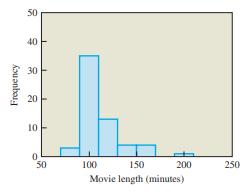
movie Lengths. Figure 8 shows a histogram for the lengths of 60 movies. The mean movie length is 110.5 minutes. Is this distribution close to normal? Should this variable have a normal distribution? Why or why not? 50 Frequency 40 10 30 20 20 10 0 50 100 150 200 250 Movie length (minutes)
Parking Ticket Fines. The amounts of the fines from parking tickets found on a random sample of 1,000 parked cars.state whether you would expect it to be normally distributed. Explain your reasoning.
Waiting Times. The waiting times at a bus stop if the bus comes once every 10 minutes and you arrive at random times.state whether you would expect it to be normally distributed. Explain your reasoning.
Flight Delays. The lengths of time that commercial aircraft are delayed before departing.state whether you would expect it to be normally distributed. Explain your reasoning.
White Blood Cell Counts. The measured white blood cell counts of 500 randomly selected adult women.state whether you would expect it to be normally distributed. Explain your reasoning.
saT scores. All of the SAT scores from last year.state whether you would expect it to be normally distributed. Explain your reasoning.
Lottery. The numbers selected in the Pennsylvania “Match 6” lottery, in which players attempt to match six randomly selected numbers between 1 and 49.state whether you would expect it to be normally distributed. Explain your reasoning.
Incomes. The incomes of randomly selected adults in the United States.state whether you would expect it to be normally distributed. Explain your reasoning.
Weights of Quarters. The exact weights of a random sample of quarters manufactured in 2012 by the U.S. Mint.state whether you would expect it to be normally distributed. Explain your reasoning.
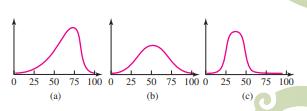
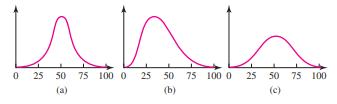
What Is Normal? Identify the distribution in Figure 7 that is not normal. Of the two normal distributions, which has the larger standard deviation? 0 25 50 75 100 0 25 50 75 100 0 25 50 75 100 () (b) ()
What Is Normal? Identify the distribution in Figure 6 that is not normal. Of the two normal distributions, which has the larger standard deviation? 0 25 50 75 100 0 25 50 75 100 0 25 50 75 100 () (b) ()
salaries. An economist plans to obtain the current salaries of all professional football players, and she predicts that those salaries will have a normal distribution.decide whether the statement makes sense (or is clearly true) or does not make sense (or is clearly false). Explain clearly; not all
IQ scores. The mean of a normally distributed set of IQ scores is 100, and 60% of the scores are over 105.decide whether the statement makes sense (or is clearly true) or does not make sense (or is clearly false). Explain clearly; not all of these have definitive answers, so your explanation is
Brains. As part of a study of the relationship between brain size and IQ, a random sample of 250 adult males is obtained and their brain volumes are measured and found to be normally distributed.decide whether the statement makes sense (or is clearly true) or does not make sense (or is clearly
heights of Women. A sample of 2,000 women is randomly selected, and it is found that the heights of the women are normally distributed with a mean of 63.6 in.decide whether the statement makes sense (or is clearly true) or does not make sense (or is clearly false). Explain clearly; not all of these
areas. Birth weights in the United States are normally distributed with a mean (in grams) of 3420 g and a standard deviation of 495 g. If you graph this normal distribution, the area to the right of 4000 g is 0.12. What is the area to the left of 4000 g?
random Digits. Many states have lotteries that involve the random selection of digits 0, 1, 2, …, 9.Is the distribution of those digits a normal distribution? Why or why not?
Normal Distribution. A normal distribution is informally and loosely described as a probability distribution that is“bell-shaped” when graphed. Draw a rough sketch of the bell shape that characterizes normal distributions.
Although economic data suggest that the vast majority of Americans are better off today than they were a few decades ago, the poorest Americans still live in difficult economic conditions. What do you think can or should be done to help improve the lives of the poor? Can your suggestion be
Overall, do you think the increase in income inequality has been a good or bad thing for the United States? Will it be good if the trend continues? Defend your opinion.
Do you agree that the Pareto criterion is a good way to evaluate the ethics of economic change? Why or why not?
For example, does one seem to indicate a larger change in income inequality than the other? Can you think of other possible ways to display income data that might give a different picture than those shown here?
Compare several different ways of looking at the data shown in Figure 18 and Figure
Create your own “portfolio” of 10 stocks that you’d like to own, and assume you own 100 shares of each.Calculate the total value of your portfolio today, and track price changes over the next month. At the end of the month, calculate the percent change in the value of your portfolio. How did
The 30 stocks in the DJIA represent a sample of the more than 10,000 actively traded stocks, but it is not a random sample because it is chosen by particular editors for particular reasons that may include personal biases. Suppose that you chose a random sample of 30 stocks and tracked their
The DJIA is only one of many different stock market indices in wide use today. Briefly look up a few other indices, such as the S&P 500, the Russell 2000, and the NASDAQ. How do these indices differ from the DJIA?Do you think that any of them should be considered more reliable indicators of the
The stock market is still considered a riskier investment than, say, bank savings accounts or bonds. Nevertheless, financial advisors almost universally recommend holding at least some stocks, which is quite different from the situation that prevailed a century ago. What role do you think the DJIA
Identify the components that constitute the five-number summary for a data set.
Find the standard deviation of these body temperatures (°F):98.2, 98.2, 98.2, 98.2, and 98.2.
Use the range rule of thumb to estimate the standard deviation of the pulse rates given in Exercise 1.How does the result compare to the actual standard deviation of 10.9?
A standard test for braking reaction time of drivers is designed so that the mean is 2.00 sec and the standard deviation is 0.25 sec. Based on the range rule of thumb, what are the likely low and high values?
Indicate whether the given statement could apply to a data set consisting of 1,000 values that are all different.a. The 20th percentile is greater than the 30th percentile.b. The median is greater than the first quartile.c. The third quartile is greater than the first quartile.d. The mean is equal
A histogram is constructed for a large set of pulse rates of adult males, and it is found that the distribution is symmetric and unimodal. What does this imply about the values of the mean and median?
The standard deviation of the pulse rates given in Exercise 1 is 10.9. What characteristic does that value measure?
What is the range of the pulse rates given in Exercise 1?
Find the median of the pulse rates given in Exercise 1.
When you add the pulse rates of 65, 74, 88, 77, and 92, then divide by the number of values, the result is 79.2.Which term best describes this value: average, mean, median, mode, or standard deviation?
a. What is the standard deviation for a sample of 50 values, all of which are the same?b. Which of the following two car batteries would you prefer to buy, and why?• One taken from a population with a mean life of 48 months and a standard deviation of 2 months• One taken from a population with
Combine the two samples from Review Exercise 1 and find the following:a. The percentile for the amount of 1.4 mgb. The mode
Nicotine in cigarettes. Listed below are the nicotine amounts (in mg per cigarette) for samples of filtered and non-filtered cigarettes. Do filters appear to be effective in reducing the amount of nicotine?Non@filtered: 1.1 1.7 1.7 1.1 1.1 1.4 1.1 1.4 1.0 1.2 Filtered: 0.4 1.0 1.2 0.8 0.8 1.0 1.1
Drug Testing and Athletes. Find a news report concerning drug testing of athletes. Summarize how the testing is being used, and discuss whether the testing is reliable.
Polygraphs. Find a recent article in which someone or some group proposes a polygraph test to determine whether a person is being truthful. In light of what you know about polygraph tests, do you think the results will be meaningful? Why or why not?
cancer Screening. Investigate recommendations concerning routine screening for some type of cancer (for example, breast cancer, prostate cancer, or colon cancer). Explain how the accuracy of the screening test is measured. How is the test useful? How can its results be misleading?
Drug Testing. Explore the issue of drug testing either in the workplace or in athletic competitions. Discuss the legality of drug testing in these settings and the accuracy of the tests that are commonly conducted.
Polygraph Arguments. Visit Web sites devoted to either opposing or supporting the use of polygraph tests.Summarize the arguments on both sides, specifically noting the role that false negative rates play in the discussion.
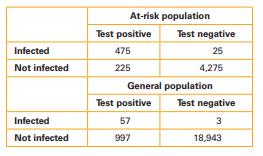
hIV risks. The New York State Department of Health estimates a 10% rate of HIV for the at-risk population and a 0.3% rate for the general population. Tests for HIV are 95% accurate in detecting both true negatives and true positives. Random selection and testing of 5,000 at-risk people and 20,000
Drug Trials. (This problem is based on an example from the“Ask Marilyn” column in Parade Magazine.) A company runs two trials of two treatments for an illness. In the first trial, Treatment A cures 20% of the cases (40 out of 200)and Treatment B cures 15% of the cases (30 out of 200).In the
hiring Statistics. (This problem is based on an example in“Ask Marilyn” column in Parade Magazine.) A company decided to expand, so it opened a factory, generating 455 jobs. For the 70 white-collar positions, 200 males and 200 females applied. Of the females who applied, 20%were hired, while
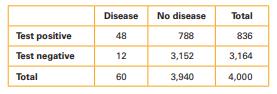
Disease Test. Suppose a test for a disease is 80% accurate for those who have the disease (true positives) and 80%accurate for those who do not have the disease (true negatives). Within a sample of 4,000 patients, the incidence rate of the disease matches the national average, which is 1.5%.a. Of
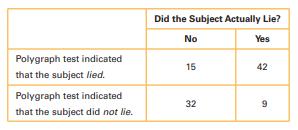
Polygraph Test. The results in the table below are from experiments conducted by researchers Charles R.Honts (Boise State University) and Gordon H. Barland(Department of Defense Polygraph Institute). In each case, it was known whether the subject lied, so the table indicates when the polygraph test
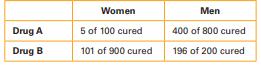
better Drug. Two drugs, A and B, were tested on a total of 2,000 patients, half of whom were women and half of whom were men. Drug A was given to 900 patients and Drug B to 1,100 patients. The results appear in the table below.a. Give numerical evidence to support the claim that Drug B is more
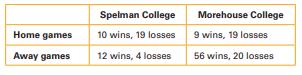
basketball records. Consider the following (hypothetical)basketball records for Spelman and Morehouse Colleges.a. Give numerical evidence to support the claim that Spelman College has a better team than Morehouse College.b. Give numerical evidence to support the claim that Morehouse College has a
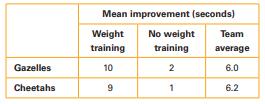
Weight Training. Two cross-country running teams participated in a (hypothetical) study in which a fraction of each team used weight training to supplement a running workout. The remaining runners did not use weight training. At the end of the season, the mean improvement in race times(in seconds)
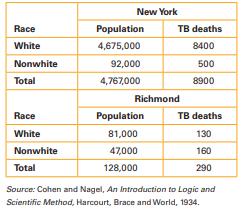
Tuberculosis Deaths. The following table shows deaths due to tuberculosis (TB) in New York City and Richmond, Virginia, in 1910.a. Compute the death rates for whites, nonwhites, and all residents in New York City.b. Compute the death rates for whites, nonwhites, and all residents in Richmond.c.
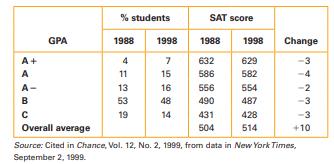
Test Scores. Consider the following table comparing the grade point averages (GPAs) and mathematics SAT scores of high school students in 1988 and 1998 (before the SAT test format was revised).a. In general terms, how did the SAT scores of the students in the five grade categories change between
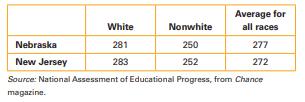
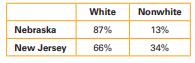
Test Scores. The table below shows eighth-grade mathematics test scores in Nebraska and New Jersey. The scores are separated according to the race of the student. Also shown are the state averages for all races.a. Which state had the higher scores in both racial categories? Which state had the
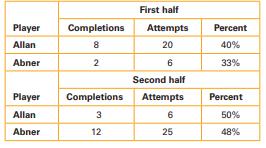
Passing Percentages. The table below shows the passing records of two rival quarterbacks in the first half and second half of a football game.Who had the higher completion percentage in the first half?Who had the higher completion percentage in the second half? Who had the higher overall completion
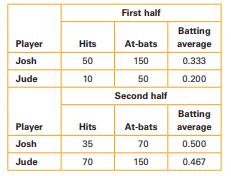
batting Percentages. The table below shows the batting records of two baseball players in the first half (first 81 games) and last half of a season.Who had the higher batting average in the first half of the season? Who had the higher batting average in the second half? Who had the higher overall
Test Accuracy. If a drug test is 90% accurate, it follows that 90% of those who test positive are actual drug users.decide whether the statement makes sense (or is clearly true) or does not make sense (or is clearly false). Explain clearly; not all of these statements have definitive answers, so
Test results. After taking a test for the presence of a disease, a patient is happy because the physician announces that the test results are positive.decide whether the statement makes sense (or is clearly true) or does not make sense (or is clearly false). Explain clearly; not all of these
batting Average. Ann’s batting average for the first half of the softball season is higher than Bret’s, and Ann’s batting average for the second half of the season is higher than Bret’s. It follows that Ann’s batting average for the entire season is higher than Bret’s.decide whether the
course Average. Ann and Bret are taking the same statistics course, in which the final grade is determined by assignments and exams. Ann’s mean score on the assignments is higher than Bret’s, and Ann’s mean score on the exams is higher than Bret’s. It follows that Ann’s overall mean score
better in Each half, Worse overall. When the Giants and Patriots football teams play each other, can one of the quarterbacks have a higher passing percentage in each half while having a lower passing percentage for the entire game?
Test result. If you apply a test for the presence of alcohol, what is the result called if the test correctly indicates that the subject has not consumed alcohol?
Positive Test result. Jennifer is given a pregnancy test.What does it mean when she is told that the result is positive?
False Positive and False Negative. A baseball player is given a test for banned substances. For this test, what is a false positive? What is a false negative? What is a true positive? What is a true negative?
Summarizing a News Data Set. Find an example of a data distribution given in the form of a table in a recent news report. Make a five-number summary and a boxplot for the distribution.
ranges in the News. Find two examples of data distributions in recent news reports; they may be given either as tables or as graphs. In each case, state the range of the distribution and explain its meaning in the context of the news report. Estimate the standard deviation by applying the range
Measuring Variation. The range and standard deviation use different approaches to measure variation in a data set.Construct two different data sets configured so that the range of the first set is greater than the range of the second set (suggesting that the first set has more variation) but the
Kids and the Media. A recent study by the Kaiser Family Foundation looked at the role of media (for example, television, books, computers) in the lives of children. The report, which is on the Kaiser Family Foundation Web site, gives many data distributions concerning, for example, how much time
Secondhand Smoke. At the Web sites of the American Lung Association and the U.S. Environmental Protection Agency, find statistical data concerning the health effects of secondhand (passive) smoke. Write a short summary of your findings and your opinions about whether and how this health issue
batting Standard Deviation. For the past 100 years, the mean batting average in the major leagues has remained fairly constant at about 0.260. However, the standard deviation of batting averages has decreased from about 0.049 in the 1870s to 0.031 in the present. What does this tell us about the
Portfolio Standard Deviation. The book Investments, by Zvi Bodie, Alex Kane, and Alan Marcus, claims that the annual percentage returns for investment portfolios with a single stock have a standard deviation of 0.55, while the annual percentage returns for portfolios with 32 stocks have a standard
Managing complaints. You manage a small ice cream shop in which your employees scoop the ice cream by hand. Each night, you total your sales and the total volume of ice cream sold. You find that on nights when an employee named Ben is working, the mean price of the ice cream sold is $1.75 per pint
Manufacturing. You are in charge of a manufacturing process that produces car batteries that are supposed to provide 12 volts of power. Manufacturing occurs at two different sites. The first site produces batteries with a mean of 12.1 volts and a standard deviation of 0.5 volt, while the second
The following data sets give the approximate lengths of Beethoven’s nine symphonies and Mahler’s nine symphonies (in minutes).Beethoven:28 36 50 33 30 40 38 26 68 Mahler:52 85 94 50 72 72 80 90 80 do the following:a. Find the mean, median, and range for each of the two data sets.b. Give the
The following data sets show the ages of the first seven U.S. Presidents (Washington through Jackson) and seven recent U.S. Presidents (Ford through Obama) at the time of inauguration.First 7:57 61 57 57 58 57 61 Last 7:61 52 69 64 46 54 47 do the following:a. Find the mean, median, and range for
The following data sets give the driving speeds in miles per hour of the first nine cars to pass through a school zone and the first nine cars to pass through a downtown intersection.School:20 18 23 21 19 18 17 24 25 Downtown:29 31 35 24 31 26 36 31 28 do the following:a. Find the mean, median, and
The following data sets give the ages in years of a sample of cars in a faculty parking lot and a student parking lot at the College of Portland.Faculty:2 3 1 0 1 2 4 3 3 2 1 Student:5 6 8 2 7 10 1 4 6 10 9 do the following:a. Find the mean, median, and range for each of the two data sets.b. Give
understanding Standard Deviation. The following four sets of 7 numbers all have a mean of 6.{6, 6, 6, 6, 6, 6, 6}, {5, 5, 6, 6, 6, 7, 7}{5, 5, 5, 6, 7, 7, 7}, {3, 3, 3, 6, 9, 9, 9}a. Make a histogram for each set.b. Give the five-number summary and draw a boxplot for each set.c. Compute the
understanding Standard Deviation. The following four sets of 7 numbers all have a mean of 9.{9, 9, 9, 9, 9, 9, 9,} {8, 8, 9, 9, 9, 10, 10}{8, 8, 8, 9, 10, 10, 10} {6, 6, 6, 9, 12, 12, 12}a. Make a histogram for each set.b. Give the five-number summary and draw a boxplot for each set.c. Compute the
calculating Percentiles. A data set consists of the 85 ages of women at the time that they won an Oscar in the category of best actress.a. One of the actresses was 40 years of age, and she was older than 63 of the other actresses at the time that they won Oscars. What is the percentile of the age
calculating Percentiles. A statistics professor with too much time on his hands weighed each M&M candy in a bag of 465 plain M&M candies.a. One of the M&Ms weighed 0.776 gram and it was heavier than 25 of the other M&Ms. What is the percentile of this particular value?b. One of the M&Ms weighed
Treatment Effect. Researchers at Pennsylvania State University conducted experiments with poplar trees. Listed below are weights (in kilograms) of poplar trees given no treatment and poplar trees treated with fertilizer and irrigation. Does there appear to be a difference between the two standard
Weather Forecast Accuracy. In an analysis of the accuracy of weather forecasts, the actual high temperatures are compared with the high temperatures predicted one day earlier and the high temperatures predicted five days earlier. Listed below are the errors between the predicted temperatures and
bMI for Miss America. The trend of thinner Miss America winners has generated charges that the contest encourages unhealthy diet habits among young women. Listed below are body mass indexes (BMI) for Miss America winners from two different time periods. Does there appear to be a difference in
It’s raining cats. Statistics are sometimes used to compare or identify authors of different works. The lengths of the first 20 words in the foreword by Tennessee Williams in Cat on a Hot Tin Roof are listed along with the lengths of the first 20 words in The Cat in the Hat by Dr. Seuss. Does
Quarters. Weights (in grams) of quarters in circulation:5.60 5.63 5.58 5.56 5.66 5.58 5.57 5.59 5.67 5.61 5.84 5.73 5.53 5.58 5.52 5.65 5.57 5.71 5.59 5.53 5.63 5.68 each list a set of numbers. In each case, find the range and standard deviation. (The same sets of numbers were used in Exercises
Weights of M&Ms. Weights (in grams) of randomly selected M&M plain candies:0.957 0.912 0.842 0.925 0.939 0.886 0.914 0.913 0.958 0.947 0.920 each list a set of numbers. In each case, find the range and standard deviation. (The same sets of numbers were used in Exercises 13–20 in Section 1.)
old Faithful geyser. Time intervals (in minutes)between eruptions of Old Faithful geyser in Yellowstone National Park:98 92 95 87 96 90 65 92 95 93 98 94 each list a set of numbers. In each case, find the range and standard deviation. (The same sets of numbers were used in Exercises 13–20 in
blood Alcohol. Blood alcohol concentrations of drivers involved in fatal crashes and then given jail sentences (based on data from the U.S. Department of Justice):0.27 0.17 0.17 0.16 0.13 0.24 0.29 0.24 0.14 0.16 0.12 0.16 each list a set of numbers. In each case, find the range and standard
body Temperatures. Body temperatures (in degrees Fahrenheit) of randomly selected normal and healthy adults:98.6 98.6 98.0 98.0 99.0 98.4 98.4 98.4 98.4 98.6 each list a set of numbers. In each case, find the range and standard deviation. (The same sets of numbers were used in Exercises 13–20 in
Perception of Time. Actual times(in seconds) recorded when statistics students participated in an experiment to test their ability to determine when one minute (60 seconds)had passed:53 52 75 62 68 58 49 49 each list a set of numbers. In each case, find the range and standard deviation. (The same
Space Shuttle Flights. Listed below are the durations (in hours) of a sample of all flights of NASA’s Space Transport System (space shuttle):73 95 235 192 165 262 191 376 259 235 381 331 221 244 0 each list a set of numbers. In each case, find the range and standard deviation. (The same sets of
Number of Words. Pages from Merriam-Webster’s Collegiate Dictionary, 11th edition, were randomly selected.Here are the numbers of words defined on those pages:51 63 36 43 34 62 73 39 53 79 each list a set of numbers. In each case, find the range and standard deviation. (The same sets of numbers
baseball Salaries. If the range of salaries paid to baseball players in the American League is less than the range of salaries paid to baseball players in the National League, then the American League salaries must have a smaller standard deviation than the National League salaries.decide whether
baseball Salaries. For a recent year, the 817 salaries paid to professional baseball players have a median of$1,152,000 and a second quartile with the same value of$1,152,000.decide whether the statement makes sense (or is clearly true) or does not make sense (or is clearly false). Explain clearly;
lengths. The house key lengths of 15 statistics students are measured and rounded to the nearest centimeter, and all 15 values are the same, so the standard deviation is 0 cm.decide whether the statement makes sense (or is clearly true) or does not make sense (or is clearly false). Explain clearly;
Showing 2000 - 2100
of 5397
First
14
15
16
17
18
19
20
21
22
23
24
25
26
27
28
Last
Step by Step Answers