New Semester
Started
Get
50% OFF
Study Help!
--h --m --s
Claim Now
Question Answers
Textbooks
Find textbooks, questions and answers
Oops, something went wrong!
Change your search query and then try again
S
Books
FREE
Study Help
Expert Questions
Accounting
General Management
Mathematics
Finance
Organizational Behaviour
Law
Physics
Operating System
Management Leadership
Sociology
Programming
Marketing
Database
Computer Network
Economics
Textbooks Solutions
Accounting
Managerial Accounting
Management Leadership
Cost Accounting
Statistics
Business Law
Corporate Finance
Finance
Economics
Auditing
Tutors
Online Tutors
Find a Tutor
Hire a Tutor
Become a Tutor
AI Tutor
AI Study Planner
NEW
Sell Books
Search
Search
Sign In
Register
study help
business
operations management 6th
Operations Management Providing Value In Goods And Services 3rd Edition Dilworth, James B - Solutions
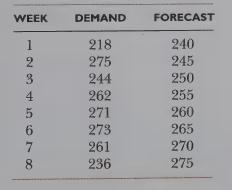
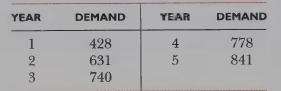
1. Here is a series of weekly demand data, covering 8 weeks, that the Forever Young Cos- metic Company collected on one of its products and forecasts for the corresponding weeks, made by forecast model 1, which the cosmetic company is testing.a. Compute the mean absolute deviation based on all 8
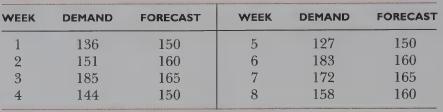
2. The Forever Young Cosmetics Company used forecast model 2 to forecast demand for a different product. Eight weeks of actual data and forecast data are shown below.a. Calculate the MAD based on these 8 weeks of data.b. Calculate the MSE based on these 8 weeks of data. WEEK DEMAND FORECAST WEEK
3. On the basis of the mean absolute percentage error, does it appear that the fore- cast model in problem 1 or the model in problem 2 does the better job of fore- casting? If you worked the two previous problems, discuss the MADs for the two forecast models.
4. Given below is a series of weekly demand for outpatient care at an ambulatory center. Also shown are forecasts of demand calculated by two forecasting methods that are under consideration.a. Compute the MAD for each forecast model.b. Compute the RSFE for each forecast model.c. Indicate which
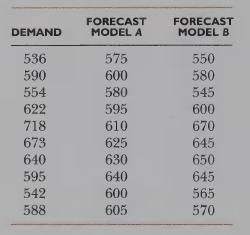
5. Given below are the actual demand and the forecasts made by two forecast models.a. Compute the MAD for both forecast models.b. Compute the RSFE for both forecast models.c. Indicate which model you think is better and why. ACTUAL DEMAND FORECAST MODEL A MODEL B FORECAST 3,189 3,700 3,480 4,038
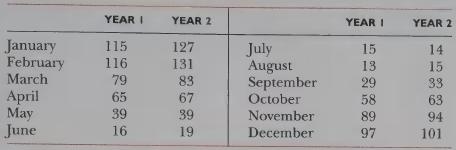
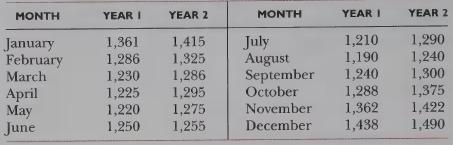
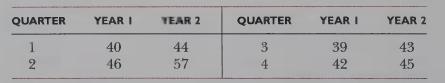
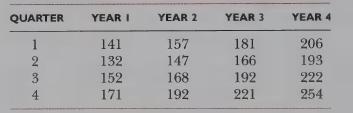
6. Here are 2 years' worth of monthly demand data for fleece jackets at a large sporting goods store:a. Calculate the 3-month moving averages for the data.b. Calculate the 6-month moving averages for the data.c. Which seems to be more stable? Why? YEAR I YEAR 2 YEAR I YEAR 2 January 115 127 July 15
7. Given below are data on the monthly demand for a product.a. Compute the 3-month moving average of this demand. Does this series still show seasonal variation?b. Compute the 12-month moving average of this demand. Does this series of aver- ages still show seasonal variation?c. Plot the original
8. The Olde Favorite Ice Cream Shoppe has recorded the demand for a particular fla- vor during the past 6 weeks, as shown below.a. Calculate a 3-week moving average for the data to forecast demand for the next week. (Three weeks of data are used for each forecast, so you can make only three
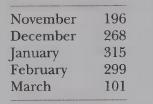
9. Demand for a certain model of snowboard during the past 5 months is shown below:a. Compute the forecast demand for each month from November through March, us- ing single exponential smoothing with a = 0.2. Assume that the forecast for No- vember was 212.b. Compute the MAD for this forecasting
10.a. Repeat problem 9 with a = 0.4.b. Compute the MAD for this forecast model based on the data for December, Janu- ary, February, and March.c. Which appears to be the better value ofa, 0.2 or 0.4?
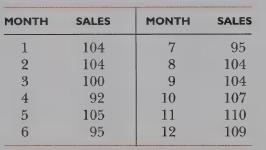
11. The following table represents monthly sales data for a particular model of racing tires for motorcycles.a. Calculate the single exponentially smoothed forecast, using an a of 0.20 and an initial forecast of 100.0.b. Calculate the single exponentially smoothed forecast, using an of 0.40 and an
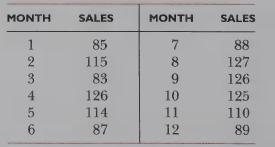
12. The following table represents sales data for pounds of butter (in hundreds) sold by a supermarket.a. Use single exponential smoothing to forecast demand, with an of 0.20 and an initial forecast of 100.0.b. Calculate the single exponential smoothed forecast, using an a of 0.30 and an initial
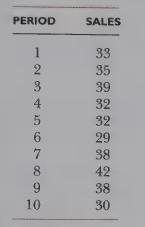
13.a. Use double exponential smoothing to forecast sales through period 11 for the following data. Use an a of 0.30, a B of 0.50, an initial base of 29.0, and a trend of 1.0.b. Also calculate the tracking signal. PERIOD SALES 1 33 284 35 3 39 32 5 32 6 29 7 38 8 42 9 38 10 30
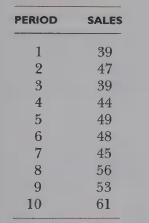
14.a. Use double exponential smoothing to forecast sales using an a of 0.20, a B of 0.50, an initial base of*38.0, and a trend of 2.0.b. Extend the forecasts through period 15. PERIOD SALES 1 39 2 47 3 39 4 44 5198 49 6 48 7 45 56 9 53 10 61
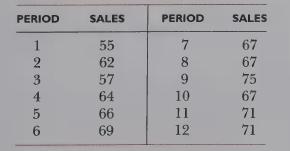
15.a. Use double exponential smoothing to forecast sales with an a of 0.20, a B of 0.40, an initial base of 59.0, and a trend of 1.0.b. At each period calculate the MAD based on the data available up to and including that period.c. At each period, calculate the tracking signal based on data up to
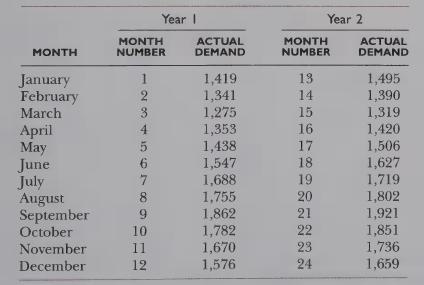
16. The Deadweight Anchor Company has experienced the following demand for a particular model of boat anchor during the past 2 years:a. Compute and plot the 4month moving average for these data.b. Compute a 12-month average for the first 12 months and the last 12 months. Plot these points, and draw
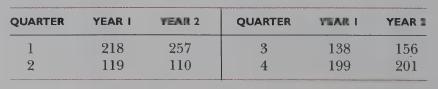
18. Given below are 2 years of quarterly demand data for a particular model of personal computer from a local computer store.a. Deseasonalize the data with a moving average, and compute a linear regression equation for the trend in demand.b. Compute an average multiplicative index for each of the
19. Here are 2 years of quarterly data on demand for rucksacks from an outdoor retailer:a. Deseasonalize the data with a moving average and compute a regression equation for the trend in demand.b. Compute the average multiplicative index for each of the 4 quarters of a year.c. Using the trend and
20.Given below are 2 years of quarterly data on demand for a particular model of electric blender at a mail-order warehouse.a. Deseasonalize the data with a moving average and compute a regression equation for the trend in demand.b. Compute the average multiplicative index for each of the four
Assume that the trend line equation for the data of problem 16 is Yr = 1,244 +4.53X, where X is each month in the series of data beginning with 1, 2, 3, etc.a. Compute the average multiplicative seasonal index for each month of the year.b. Compute the trend value for each of the next 6 months, and
A linear equation for the trend in demand data was found to be Yr = 1,524 + 5.2X, where X is the number of the month as designated in the table that follows.a. Project the trend values for each month and determine the multiplicative index for each of the 24 months.b. Determine the additive index
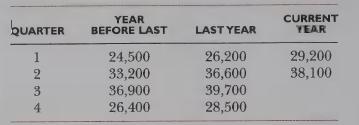
23. The owners of a beer distributorship want to forecast the level of sales for the next 2 years, so they can determine the requirements for resources such as storage space, refrigerated storage, trucks, workers, and capital. The quarterly sales for the past 2 years and the first half of this year
24. An established photo processing laboratory has experienced a consistent decline in business, owing primarily to the spread of 1-hour photo processing minilaboratories. The following data represent quarterly sales (in thousands of dollars) for the past 2 years.a. Average the first year's sales
25.a. Calculate the five four-quarter moving averages that can be found from the data in problem 24. Determine the linear regression equation for these points, and com- pare it with the line determined by using just the two endpoints.b. What is the danger in using only two endpoints to estimate the
26. The sales manager of a local building material supply chain suspects that the sales of roofing materials are correlated with the amount of framing lumber sold 1 or 2 months earlier. Use the data given below (in units sold) to see if the correlation is highest between lumber sales and roofing
27.a. Using the sales data in problem 26, develop a regression equation to express the number of units of roofing that you would expect to sell as a function of the num- ber of units of lumber sold the month before.b. Forecast the expected roofing sales for the month following a month in which 125
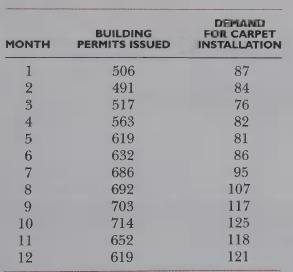
28. Soft Touch Carpet Installers is trying to select a forecasting model to determine the number of carpet installers the company will require each month. A relationship is thought to exist between the demand for carpet installation and the number of building permits issued some months prior to the
a. Using the data in problem 28, develop a regression model to express demand for carpet installation as a function of the building permits issued 3 months prior to the demand. (Use the first 8 months of building permit data.)b. Forecast the demand for carpet installation 3 months following a month
30. A bank in a rapidly growing city is outgrowing its facility. The bank officers feel that the operations (proof, transit, computer, bookkeeping) part of the bank should be moved. They are looking for an existing building to lease or buy or for a site on which to build an operations center. They
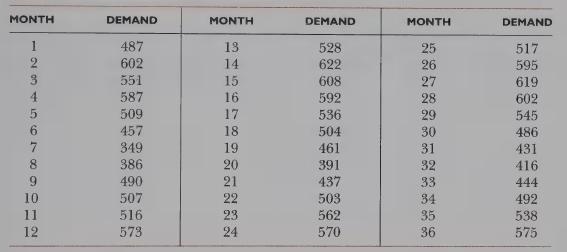
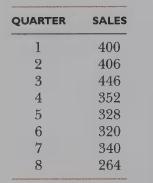
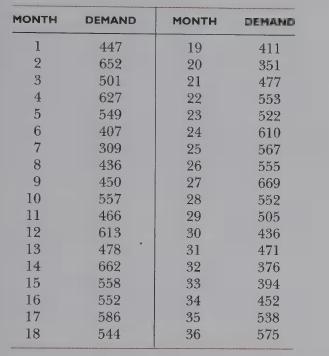
1. Use the 36 successive values of demand data given in problem 2 to determine the number of periods to include in a moving average so that the MAD is minimized. You can construct a spreadsheet with columns for month number, demand, sum of n months, forecast, deviation, and absolute deviation. Sum
2. Given below are 36 months of sales data from Redwood Rummage Company. Construct a spreadsheet to calculate an exponential smoothing forecast for each month, using a forecast of 450 for the first month. Use a column for each of the following: month number, demand, forecast, error, a X error,
3. Repeat problem 2, but select the forecast model that minimizes the mean square error.Why might the model (value ofa) that minimizes the MSE be different from the one that minimized the MAD?
4. Use a spreadsheet template to see how long it takes for the effects of an initial forecast to “wash out.” You can develop another template, or you can use the one developed for problem 2, but you will not need all the columns. Use an a of 0.3 and an initial forecast of 350 (your instructor
5. Repeat problem 4 using an a of 0.5.
1. United Parcel Service is the world’s largest package distribution company. With more than 500 aircraft, 157,000 trucks, and 1,700 facilities worldwide, UPS delivers as many as 3 billion packages to customers per year. Assume the role of a UPS manager, and visit the UPS Web site at www.ups.com
2. Nordstrom is a fashion retailer with 99 stores in 22 states, as well as a mail-order catalog and an on-line store. Imagine that you are doing market research on whether it would be profitable for the company to open a store in a location near you. Visit Nordstrom’s Web site at
17. A Midwest distributor has handled a particular brand of two-cycle motor oil for the past 5 years. The demand data for the product during those years are given below.a. Plot the data. Should the first year’s data be included in computing a linear regression model to estimate the trend in
1. Why should location decisions be considered from a broad systems view?
2. Why can location seldom be selected on the basis of tangible cost alone?
3. What three major categories of factors influence operations location?
4. How may tangible costs and intangible factors be compared to arrive at a location decision?
5. Why do various organizations emphasize different location factors?
6. What trade-off is made as the area serviced by a distribution center is expanded?
7. When should profit be considered in location analysis? Discuss the usefulness of costprofit-volume analysis in locating a service operation.
8. What are the steps in solving the location problem?
9. Is monetary cost or profit always the appropriate criterion for location decisions?Why?
10. Which of the factors discussed in the chapter are most important in determining the location of the following? Briefly explain the reason for your answer.a. A garment plantb. A paper millc. An automobile repair shopd. A distribution warehouse
11.a. What factors would lead a company to be market-oriented rather than materialsoriented in selecting its location?b. What factors favor a materials orientation?
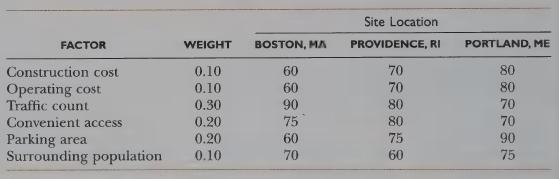
1. Pueblo, a southwestern chain of stores that sells decorative accessories for the home, is considering opening a store in New England. Three potential sites are being evaluated for the new store. Each factor used in evaluating these sites has been assigned a weight to represent its relative
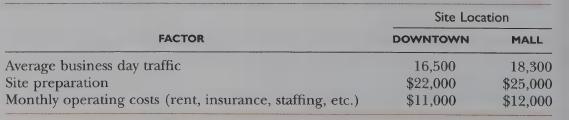
2. Marie Hartwell is comparing two sites for her clothing boutique, which she has decided to relocate from a tiny strip mall that has had declining business over the past 2 years.Marie’s casual clothing generally appeals to younger customers, and both sites will be more visible to these
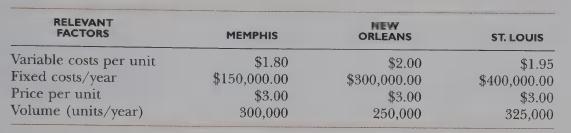
3. Your company is considering expanding into the Sun Belt. Your industry is heavily dependent on water transportation, so the preliminary research has narrowed the location to three sites near port facilities in Memphis, New Orleans, and St. Louis. On the basis of the following data, which site is
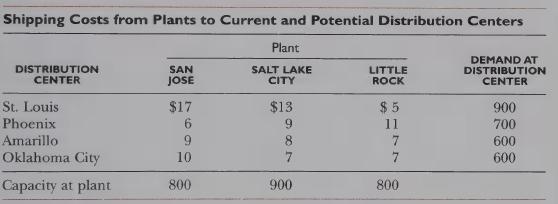
4. The Michael Corporation has plants in three cities. It distributes products from these plants to some customers and to two distribution centers. The company is planning to open a third distribution center in either Oklahoma City or Amarillo. The costs of shipping products from the company’s
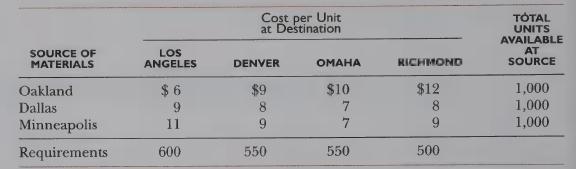
5. Nancy Andrews is president of the Andrews Electronic Company, which assembles pocket calculators and minicomputers. The company currently has plants in Los Angeles, California, and Richmond, Virginia. Ms. Andrews is evaluating the merits of opening a third plant in a more central part of the
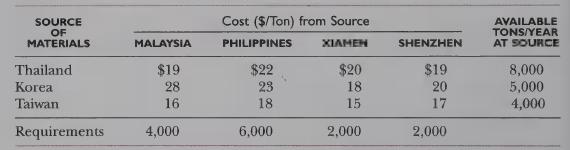
6. The Hi Sun Chemical Division of a Taiwanese trading company is evaluating potential sites for an additional factory so it can better access the low labor costs and high potential demand of mainland China. The company currently operates factories in the Philippines and Malaysia. Hi Sun has
7. The Theodore Corporation supplies its entire market from its location in Kansas City. Orders of sufficient size are shipped by rail where rail service is available at the destination.Mr. Theodore is considering a revision in the way smaller orders are transported. All smaller orders (about
8. A company is performing a simplified analysis to determine approximately how far apart it should locate its warehouses. The company estimates that the fixed costs of operating a warehouse are $400,000 per year. It wants to determine how large an area to serve with the warehouse. The company
1. Malden Mills, manufacturers of the Polarfleece and Polartec fabrics that are so popular for outerwear, suffered a catastrophe in the mid-1990s. Three of its main buildings burned to the ground at its Lawrence, Massachusetts, plant one winter night, causing many people to believe that the company
2. Citicorp is located in 98 countries and territories around the world. Visit the Web site for Citibank, which is part of Citicorp, at www.citibank.com/about, and browse through the sites that deal with the company’s global presence (you may concentrate either on Citibank or on Citicorp as a
3. Assume the role of a consultant to a major retailer—say, Macy’s, Home Depot (or Lowe’s), Target, Crate and Barrel, or the like. You’ve been hired to research the potential profitability of a new retail store near your college. Visit not only the Web site for the retailer you’ve chosen
A job has been time-studied for 20 observations. The mean actual time was 5.83 minutes, and the standard deviation of the times is estimated to be 2.04 minutes.How many total observations should be taken for 95 percent confidence that the mean actual time has been determined within 10 percent?
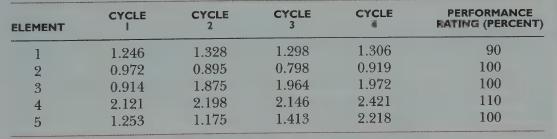
An analyst has observed a job long enough to become familiar with it and has divided it into five elements. The element times for the first four cycles and a performance rating for each element are given in the following table.(a) Do any of the times look like “outliers,” that is, probable
1. What is a work standard? State two ways that standards may be expressed.
2. What are four basic criteria for determining jobs most suitable for measurement?
3. What are the steps in performing a stopwatch time study?
4. What factors should be considered in the determination of a standard?
5. Why do time-study analysts break jobs into elements?
6. Distinguish between actual time, normal time, and standard time.
7. What are predetermined motion times?
8. Distinguish between work sampling and time study.
9. How can historical records be used in the development of standards?
10.a. What are standard data?b. What are some advantages of using standard data?
11. What are some of the characteristics that differentiate office work from factory work?
1. A job has been time-studied for 30 observations. The mean actual time was 3.66 minutes, and the coefficient of variation (CV) was found to be 20 percent (CV = 0.20).How many total observations should be taken for 95 percent confidence that the mean actual time has been determined within 5
2. A job has been time-studied for several cycles, and the mean actual time was found to be 1.84 minutes. The standard deviation of the actual times was estimated to be 0.38 minute. How many observations should be taken to estimate the true actual time within 10 percent with 95 percent confidence?
3. Time-study observations of a job have been completed, and the mean actual time was found to be 6.28 minutes. The analyst estimated that the observed worker had a performance rating of 110 percent during the study. Personal and fatigue allowances of 13 percent are appropriate for the job, and
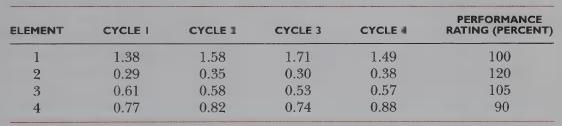
4. An analyst has become familiar with a job and has divided it into four elements. The element times for the first four cycles are given in the table below with a performance rating for each element.a. On the basis of the times observed through four cycles, determine the normal time for the job.b.
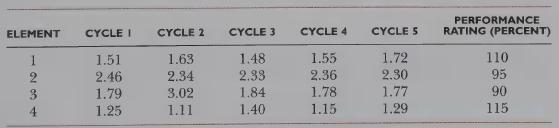
5. An analyst has observed a job long enough to become familiar with it and has divided it into four elements. The element times for the first five cycles are shown in the following table with a performance rating for each element.a. Compute an estimated normal time for the job based on the data
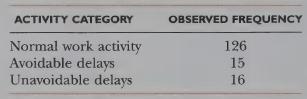
6. The analyst in problem 4 performed a work-sampling study for the same task and recorded the counts shown in the following table for three categories of activities.What allowance should be made for unavoidable delays? ACTIVITY CATEGORY Normal work activity Avoidable delays Unavoidable delays
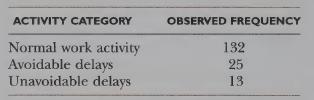
7. The analyst in problem 5 performed a work-sampling study for the same task and recorded the counts shown in the following table for three categories of activities.What allowance should be made for unavoidable delays? ACTIVITY CATEGORY Normal work activity Avoidable delays Unavoidable delays
8. Ajax Car Rental Service has attempted to streamline the process of completing a rental contract so that customers may obtain cars with minimum delay. The manager has timed 20 transactions from the time the agent begins talking with the customer until the customer is handed the keys and a
9. Arrow Airlines has attempted to streamline the process of booking flight reservations in order to service the maximum number of on-site customers. The manager has timed 40 transactions from the time the agent begins talking with the customer until tickets are prepared and paid for and luggage is
10. The Donnelly Company owns 100 machines for lease by the day to customers. Randomly selected records of 30 days show that on average 44 machines are rented each day. How many records should be observed to estimate the utilization of these machines within 10 percent accuracy and with 95 percent
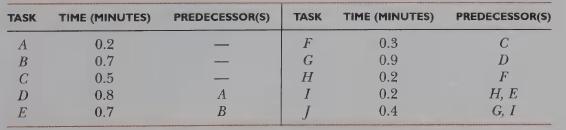
A production line is to be established to produce 300 modems per day (460 minutes).The production tasks, their times, and their precedence requirements are shown in the table below.(a) Using a heuristic that assigns the longest available task that will fit within the remaining work station time,
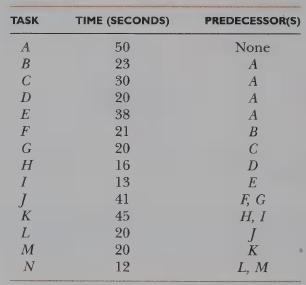
1. The Techno Toy Company is considering producing a handheld computer “pet” that children will have to “care for” by pressing certain keys when the pet produces audio or visual signals requesting to be “fed” or “walked.” Operations managers will be developing an assembly line that
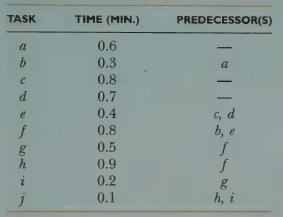
2. The table below shows the tasks, times, and precedence requirements for the work required to assemble a hair dryer. The company wants to produce 360 units in a 460-minute shift.a. Draw a diagram that shows the precedence requirements, listing the times with the tasks. |b. Balance the line by
4, The Dreamhouse Company is a small toy manufacturer that produces exclusive dollhouses.The company is going to manufacture a new, deluxe model with working electric lights and will be assigning three people to its assembly.a. Develop a three-station assembly line for the tasks shown above.b. What
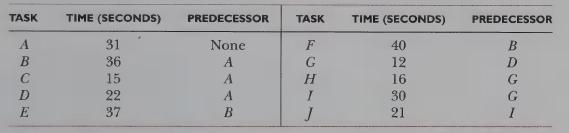
5. The Vroom Vacuum Company is installing an assembly line to produce a new model of vacuum cleaner, and as the operations manager, your job is to balance the line. The tasks that need to be performed are listed below, along with the time required to perform each task and its immediate
7. Arrange six square departments in a grid like the one shown, so as to meet the objectives listed:Department A near E A near D A near G Bnear C B near D F near D E near F
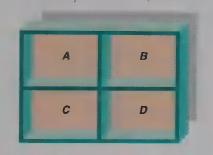
8. The grid shown here is an initial layout of four square departments within a square office building. The number of moves each week between departments is as follows:A—B = 200, A-C = 300, A—D = 400, B—C = 200, B—D = 500, C—D = 100. All movements are assumed to occur from the center of
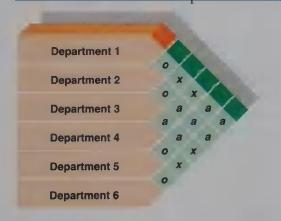
9. Arrange six square departments | through 6 in a 2 X 3 grid like the figure in problem 7 so that the nearness priorities shown in the matrix below are satisfied.a = absolutely necessaryé = very important) = important o = OK, ordinary importance u = unimportant x = undesirable Department 1
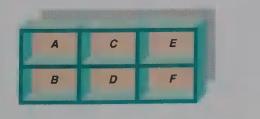
10. Draw the resulting layout for each possible pairwise interchange of departments that can be made in the departmental arrangement shown. A C E B D F
11. A factory with four major departments is to be arranged so that the cost of moving materials between the departments will be at or near the minimum. The product mix for the next 2 years has been forecasted and the number of trips that will result between departments has been estimated. Based on
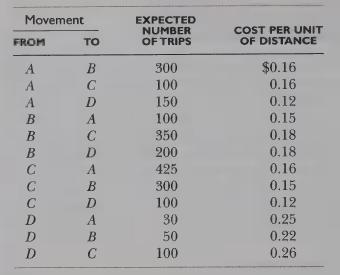
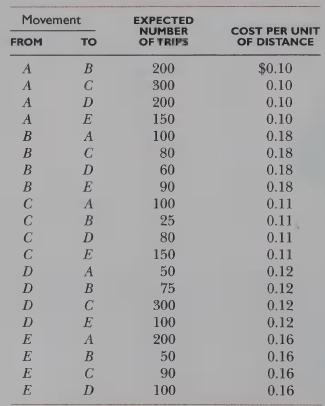
You are called in as a consultant for a firm that produces sporting goods. The manager wants you to arrange the plant to minimize transportation. The number of trips between departments and the cost per unit of distance for the typical load are given in the table below. Develop the nearness
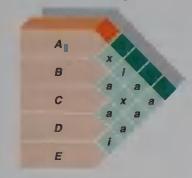
13. Departments A, C, D, and Eshould be 40 X 40 feet. Department B should be 40 X 80 feet. Arrange these five departments in a space 80 X 120 feet so that the layout meets the conditions specified in the matrix.a = absolutely necessary i = important x = undesirable A B C D E a
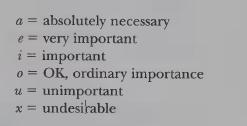
14. Locate nine square departments 1 through 9 in a 3 X 3 grid so that the priorities in the matrix are satisfied. a = absolutely necessary e= i = u very important important OK, ordinary importance unimportant x = undesirable
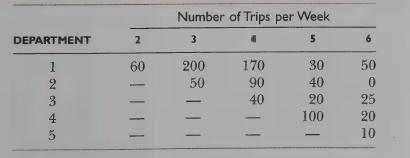
15. The X-Calibre Company wishes to rearrange its six departments within a recently enlarged 160 X 240 foot building. The departments are to be equal in size, 80 X 80 feet, and arranged in a 2 X 3 grid. Assume that the average move distance between two departments is equal to the straight-line
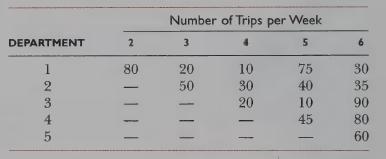
The Spruce It Up furniture plant wishes to rearrange its six departments within a recently enlarged 200 X 300 foot building. The departments are to be equal in size, 100 X 100 feet, and arranged in a 2 X 3 grid. Assume that the average move distance between two departments is equal to the
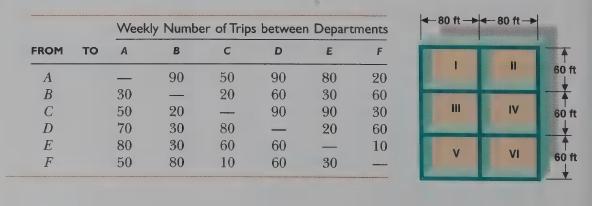
17. Six equal-size rectangular departments are to be placed in locations I through VI in the building sketched below. Aisles and corridors will be parallel to the exterior walls so that no diagonal travel will occur, and it is assumed that all travel will be from the center of one department to the
6. Using the same target cycle time, task times, and precedence requirements given in the previous problem, assign tasks to work sections by choosing the shortest task that can be assigned to each opportunity, then compute the efficiency of the line as assigned in part b of that problem. Which line
3. Refer to the table in problem 2.a. Using the same figures, balance the line by selecting the shortest time that will fit in a work station.b. Which line is more efficient—the one computed in problem 2 or the one computed here?
Showing 2000 - 2100
of 5048
First
14
15
16
17
18
19
20
21
22
23
24
25
26
27
28
Last
Step by Step Answers