New Semester Started
Get
50% OFF
Study Help!
--h --m --s
Claim Now
Question Answers
Textbooks
Find textbooks, questions and answers
Oops, something went wrong!
Change your search query and then try again
S
Books
FREE
Study Help
Expert Questions
Accounting
General Management
Mathematics
Finance
Organizational Behaviour
Law
Physics
Operating System
Management Leadership
Sociology
Programming
Marketing
Database
Computer Network
Economics
Textbooks Solutions
Accounting
Managerial Accounting
Management Leadership
Cost Accounting
Statistics
Business Law
Corporate Finance
Finance
Economics
Auditing
Tutors
Online Tutors
Find a Tutor
Hire a Tutor
Become a Tutor
AI Tutor
AI Study Planner
NEW
Sell Books
Search
Search
Sign In
Register
study help
business
probability statistics
Statistics For The Behavioral Sciences 4th Edition Gregory J Privitera - Solutions
When we compute many correlations in a single study, we can report each correlation coefficient in a table called aa. scatterplotb. linear summaryc. correlation matrix
To summarize correlations, we report the strength, the direction, the degrees of freedom, and the p value for each correlation coefficient.a. Trueb. False
How many participants were observed in this study?a. 4b. 165c. The sample size is not given in the output table.
What is the p value and decision for the phi correlation?a. p = .211; fail to reject the null hypothesis.b. p = .007; reject the null hypothesis.c. The p value is not given; a decision cannot be made.
To compute the phi correlation coefficient using SPSS, we compute a ______. [Fill in the blank]a. Pearson correlation coefficientb. Spearman correlation coefficientc. point-biserial correlation coefficient
If χ2= 3.84 and n = 36, then what is the value of rϕ?a. .11b. .16c. .33d. .36
A researcher computes the following phi correlation coefficient: rϕ = .42. If the sample size was 20, then what is the decision for this correlation test?a. Fail to reject the null hypothesis.b. Reject the null hypothesis.
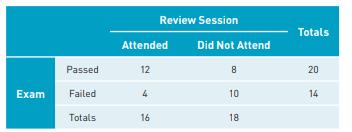
To determine whether an exam review session was effective, an instructor held an exam review session and recorded whether each student attended the review session and whether they passed the exam. Based on the frequencies for each nominal category given below, what is the value of the phi
The ______ is a measure of the strength and direction of the linear relationship between two factors in which the data for each factor is dichotomous or on a nominal scale of measurement. [Fill in the blank]a. Pearson correlation coefficientb. Spearman correlation coefficientc. point-biserial
What is the value of the point-biserial correlation coefficient?a. .215b. .253c. 15
What is the p value and decision for the point-biserial correlation?a. p = .215; fail to reject the null hypothesis.b. p = .253; fail to reject the null hypothesis.c. The p value is not given; a decision cannot be made.
To compute a point-biserial correlation coefficient using SPSS, we first ______, then compute the ______. [Fill in the blanks]a. code the dichotomous factor; Pearson correlation coefficient.b. code the ordinal factor; Pearson correlation coefficient.c. code the continuous factor; Pearson
The proportion of variance for the two-independent-sample t test (η2) and the coefficient of determination (r2) for the point-biserial correlation coefficient are equal.a. True.b. False.
A researcher measures the correlation between type of school attended (private, public)and student aptitude scores from 0 to 100 among 20 participants. If rpb = .49, then what is the decision for this correlation test?a. Fail to reject the null hypothesis.b. Reject the null hypothesis
A researcher measures the correlation between self-esteem (high, low) and physical fitness scores among school athletes. In the study, 12 participants reported high selfesteem and 12 reported low self-esteem. If sY= 9.06 and MY1– MY2= 11, then what is the value of the correlation coefficient?a.
The ______ is a measure of the strength and direction of the linear relationship between two factors in which the data for one factor is continuous (on an interval or ratio scale of measurement) and for a second factor is dichotomous (on a nominal scale of measurement). [Fill in the blank]a.
What is the value of the Spearman correlation coefficient?a. 550b. 034c. 15
What is the p value and decision for the Spearman correlation?a. p = .550; fail to reject the null hypothesis.b. p = .034; reject the null hypothesis.c. The p value is not given; a decision cannot be made.
Using SPSS, which options in the menu bar do you select to compute the Spearman correlation coefficient?a. Analyze, then Compare Means and Means.b. Analyze, then Correlate and Bivariate.c. Analyze, then General Linear Model and Univariate.
A researcher measures the correlation of the time it take participants to complete two tasks purported to measure the same cognitive skill. Participant times are converted to ranks from fastest to slowest. If ΣD2= 165 and n = 20, then what is the decision for this correlation test?a. Fail to
Ten employees have their performance ranked by a peer and by management. If we know that ΣD2= 21.50, then what is the value of rs for this example?a. .800b. 825c. 870
The ______ is a measure of the strength and direction of the linear relationship between two factors in which the data for each factor is ranked or on an ordinal scale of measurement. [Fill in the blank]a. Pearson correlation coefficientb. Spearman correlation coefficientc. point-biserial
A researcher measures a correlation for values ranging from 2 to 10 points and draws conclusions about the full range of values in the population from 0 to 21 points. Which limitation for correctly interpreting a correlation coefficient did the researcher violate?a. reverse causalityb. restriction
Outliers can change the ______ of a correlation. [Fill in the blank]a. strengthb. directionc. sign (+, −)d. All of these (a,b, andc) are correct.
A researcher reports a significant positive correlation and concludes that spending more time writing a research paper will cause a better grade on the paper. Is this conclusion appropriate?a. Yes, because the result was significant.b. No, because a correlation cannot demonstrate causality.
What is the value of the Pearson correlation coefficient?a. 632b. 027c. 12
What is the p value and decision for the Pearson correlation?a. p = .027; reject the null hypothesisb. p = .632; fail to reject the null hypothesisc. The p value is not given; a decision cannot be made.
Using SPSS, which options in the menu bar do you select to compute the Pearson correlation coefficient?a. Analyze, then Compare Means and Means.b. Analyze, then Correlate and Bivariate.c. Analyze, then General Linear Model and Univariate.
A researcher measures the following correlation: r = −.21. What is the value of the coefficient of determination?a. .04b. −.04c. .42d. −.42e. more negative
Which of the following is true about the coefficient of determination?a. It is equal to the correlation coefficient, squared.b. It is mathematically equivalent to eta-squared, η2c. It is a measure of effect size for the correlation coefficient, r.d. All of these are true.
A professor conducts a study with 12 students to determine the extent to which the number of voluntary online quizzes completed was related to final course grades. If the correlation coefficient is r = +.584, then what is the decision for a two-tailed test at a .05 level of significance?a. Fail to
A study is conducted with 100 students to compute a Pearson correlation. In this study, what are the degrees of freedom for the Pearson correlation coefficient?a. df = 98b. df = 99c. df =100
A researcher measures the relationship between narcissism (X) and willingness to help (Y). If SSXY = −53, SSX = 58, SSY = 255.20, then what is the value of the correlation coefficient?a. r = −.003b. r = −.436c. r = −.500
The ______ is a measure of the strength and direction of the linear relationship between two factors in which the data for each factor is on an interval or ratio scale of measurement. [Fill in the blank]a. Pearson correlation coefficientb. Spearman correlation coefficientc. point-biserial
What is the problem with the following data for computing a correlation?a. The correlation coefficient will equal 1.0 because it violates the assumption of normality.b. The correlation coefficient will be negative because it violates the assumption of normality.c. The correlation coefficient will
Which of the following is the assumption that the best way to describe the pattern of data is using a straight line?a. normalityb. linearityc. homoscedasticity
The assumption that there is an equal variance or scatter of data points dispersed along the regression line is referred to as ______. [Fill in the blank]a. normalityb. linearityc. homoscedasticity
The covariance is placed in the ____ of the test statistic for the correlation coefficient.[Fill in the blank]a. numeratorb. denominator
The closer data points fall to the regression line, the ____ the covariance between those two factors. [Fill in the blank]a. smallerb. largerc. more negative
____ is a measure for the extent to which values of two factors (X and Y) vary together.[Fill in the blank]a. Covarianceb. Independent variancec. Residual variance
The closer a set of data points falls to the regression line in a scatterplot, the ____ the correlation. [Fill in the blank]a. strongerb. weaker
A correlation of r = −.90 is stronger than a correlation of r = +.90.a. True, a positive correlation is always stronger than a negative correlation.b. False, a negative correlation is always stronger than a positive correlation.c. False, the strength of these correlations is the same.
An instructor reports that student scores on in-class quizzes increase as the number of student interruptions during class decreases. What type of correlation is described in this example?a. a zero correlationb. a positive correlationc. a negative correlation
A researcher reports that the farther college students are from their parents, the more often they communicate with their parents (either by phone or by email). What type of correlation is described in this example?a. a zero correlationb. a positive correlationc. a negative correlation
A researcher measures the relationship between cell phone use and happiness in a sample of college students. Which design is appropriate for measuring the relationship between these two factors?a. the between-subjects designb. the experimental designc. the correlational design
The following is a summary of a significant main effect for a two-way between-subjects ANOVA: F(1, 42) = 4.07, p = .05. Which of the following values is missing for this summary to be in correct APA format?a. The p value.b. The critical values.c. The estimate of effect size.
The following is a summary of a significant interaction for a two-way between-subjects ANOVA: F(2, 36) = 2.04, η2= .15. Which of the following values is missing for this summary to be in correct APA format?a. The p value.b. The critical values.c. The estimate of effect size.
What is the value of omega-squared for the ANOVA as a whole (i.e., for all the betweengroups variability) in this two-way between-subjects ANOVA?Answer: ____[enter number exactly as shown in the table]
Which of the following statements correctly summarizes the results of this two-way between-subjects ANOVA?a. The results demonstrate a main effect of delivery (DM, email) only.b. The results show that students visited the gym significantly more often when the“reminders” were sent via DM
What is the value of the test statistic for the significant hypothesis test in this two-way between-subjects ANOVA?Answer: ____[enter number exactly as shown in the table]
Which value is the denominator for each hypothesis test in this two-way between-subjects ANOVA?Answer: ____[enter number exactly as shown in the table]
Which of the following statements correctly summarizes the results of this two-way between-subjects ANOVA?a. Th e results demonstrate a main eff ect of setting only.b. Th e results show that participants scored signifi cantly higher when they studied in the same (compared to a diff erent) room
What is the value of eta-squared for the ANOVA as a whole (i.e., for all the betweengroups variability) in this two-way between-subjects ANOVA?Answer: ____[enter number exactly as shown in the table]
Which value is the denominator for each hypothesis test in this two-way between-subjects ANOVA?Answer: ____[enter number exactly as shown in the table]
What is the value of the test statistic for the signifi cant hypothesis test in this two-way between-subjects ANOVA?Answer: ____[enter number exactly as shown in the table]
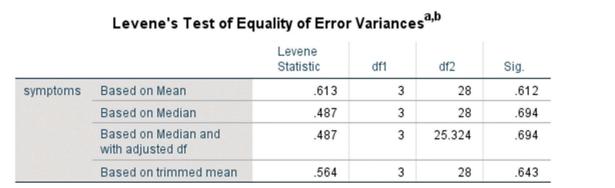
Th e SPSS output for the test for homogeneity of variance is shown in the following image for these data at a .05 level of signifi cance. Which of the following statements is true regarding this test?a. Fail to reject the null hypothesis; thus the assumption for homogeneity of variance is met.b.
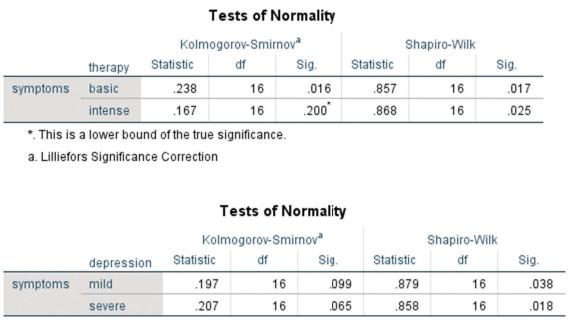
Th e SPSS output for the tests for normality are shown in the following image for these data at a .05 level of signifi cance. Which of the following statements is true regarding these tests?a. Th e data for both levels of therapy violate assumptions for normality.b. Th e data for both levels of
For the eff ects of a two-way between-subjects ANOVA, which values must be known to compute eff ect size for the main eff ects and the interaction using ω2?a. the mean square errorb. the degrees of freedom for each factorc. the sum of squares for each factor and totald. All of these must be known.
For the effects of a two-way between-subjects ANOVA, which values must be known to compute effect size for the main effects and the interaction using η2?a. the mean square errorb. the sum of squares for each factor and totalc. the degrees of freedom for each factor and totald. All of these must be
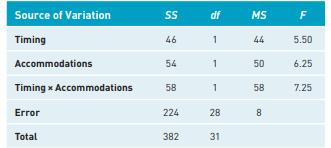
What is the effect size for the interaction using omega-squared, ω2? Source of Variation SS df MS F Timing 46 1 44 5.50 Accommodations 54 1 50 6.25 Timing Accommodations 58 1 58 7.25 Error Total 224 28 8 382 31
What is the effect size for the main effect of timing using eta-squared, η2? Source of Variation SS df MS F Timing 46 1 44 5.50 Accommodations 54 1 50 6.25 Timing Accommodations 58 1 58 7.25 Error Total 224 28 8 382 31
Which of the following hypothesis tests led to a decision to reject the null hypothesis?a. The main effect of Factor A only.b. The main effect of Factor A and the main effect of Factor B.c. The main effect of B and the A × B interaction.d. All of the hypothesis tests led to a decision to reject
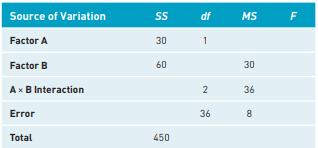
How many total participants (N) were observed in this study? Source of Variation SS df MS F Factor A 30 1 Factor B 60 60 30 Ax B Interaction Error 2 36 36 8 Total 450
How many total groups were observed in this study? Source of Variation SS df MS F Factor A 30 1 Factor B 60 60 30 Ax B Interaction Error 2 36 36 8 Total 450
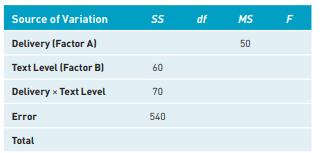
Which of the following hypothesis tests led to a decision to reject the null hypothesis?a. The main effect of delivery only.b. The main effect of delivery and the main effect of text level.c. The main effect of delivery and the delivery × text level interaction.d. None of the hypothesis tests led
What are the degrees of freedom for the delivery × text level interaction? Source of Variation SS df MS F Delivery (Factor A) Text Level (Factor B) Delivery Text Level Error Total 60 70 540 50
What is the value of the denominator of each test statistic? Source of Variation SS df MS F Delivery (Factor A) Text Level (Factor B) Delivery Text Level Error Total 60 70 540 50
In a study evaluating performance on a cognitive task that varied in delay (1, 3, or 5 second delay between prompts) and delivery (visual or auditory prompt delivered), a researcher reports that optimal performance depended on the delay between prompts; no other significant differences were evident.
In a study evaluating performance among scholarship and non-scholarship athletes on a low-stakes or high-stakes assessment, a researcher reports that optimal performance among scholarship and non-scholarship athletes depended on whether the assessment was low-stakes or high-stakes; no other
Given the results of this two-way between-subjects ANOVA, which of the following is the appropriate next steps?a. Conduct post hoc tests to analyze the significant main effects.b. Conduct simple main effect tests to analyze the significant interaction effect.c. Interpret the results of the ANOVA;
Which of the following correctly summarizes the results of the two-way between-subjects ANOVA?a. Only a significant main effect of type of test was evident.b. Only a significant main effect of class level was evident.c. Only a significant Test Type × Class Level interaction was evident.d. Both
In the calculations for the two-way between-subjects ANOVA, what is the value of the sum of squares for all the between-subjects variability: SSBetween-Groups?Answer: ____[enter whole number]
In the calculations for the two-way between-subjects ANOVA, what is the value of the sum of squares for all the Factor A (Type of Test) variability: SSA?Answer: ____[enter whole number]
For next steps, compute simple main effect tests for Gender at each level of Pricing. Which of the following statements aligns with the results obtained from these simple main effect tests?a. Women spent significantly more than men to purchase the fruits and vegetables when low energy dense foods
Which of the following correctly summarizes the results of the two-way between-subjects ANOVA?a. Only a significant main effect of gender was evident.b. Only a significant main effect of gender was evident.c. Only a significant Gender × Pricing interaction was evident.d. A significant main effect
In the calculations for the two-way between-subjects ANOVA, what is the value of the sum of squares for all the Factor B (Gender) variability: SSB?Answer: ____[enter whole number]
In the calculations for the two-way between-subjects ANOVA, what is the value of the sum of squares for all the between-subjects variability: SSBetween-Groups?Answer: ____[enter whole number]
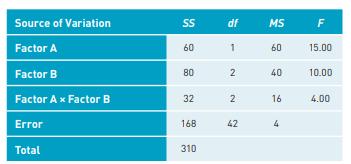
Identify the critical value at a .05 level of significance for the A × B interaction. Source of Variation SS df MS F Factor A 60 60 1 60 15.00 Factor B 80 2 40 10.00 Factor Ax Factor B 32 2 16 4.00 Error 168 42 Total 310
Identify the critical value at a .05 level of significance for the main effect of Factor A. Source of Variation SS df MS F Factor A 60 60 1 60 15.00 Factor B 80 2 40 10.00 Factor Ax Factor B 32 2 16 4.00 Error 168 42 Total 310
What is the degrees of freedom denominator for this example?
What is the degrees of freedom numerator for the interaction in this example?
Which assumption for the two-way between-subjects ANOVA states that the variance in each population is equal to that in the others?a. normalityb. homogeneity of variancec. Both a and b are correct
To compute a two-way between-subjects ANOVA, which of the following statistical assumptions should be evaluated for this test?a. normalityb. homogeneity of variancec. Both a and b are correct.
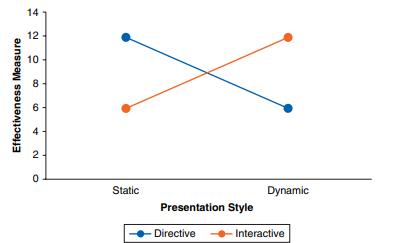
A researcher evaluates the effectiveness of an outreach program that varied based on style of presentation (static, dynamic) and engagement (directive, interactive). Which of the following statements correctly describes the results based on the following graphical summary of this study?a. The graph
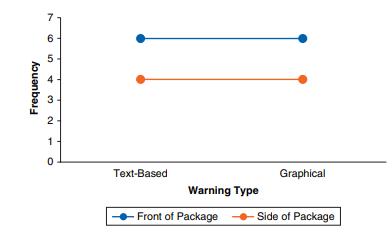
A researcher has participants rate the effectiveness of a warning placed on nicotine products to bring awareness to the dangers of smoking. Warnings varied by type (textbased, graphical) and placement (front of package, side of package). Which of the following statements correctly describes the
Which set of means in the table represent the means compared to analyze the A × B interaction?a. 4 and 6b. 3 and 7c. 2, 4, 6, and 8
Which set of means in the table represent the means compared to analyze the main effect of Factor B?a. 4 and 6b. 3 and 7c. 2, 4, 6, and 8
Which set of means in the table represent the means compared to analyze the main effect of Factor A?a. 4 and 6b. 3 and 7c. 2, 4, 6, and 8
A researcher reports that the resilience of first-responders in emergency and nonemergency situations depended on their level of certification training?
A researcher reports that health outcomes were significantly different for veterans who served in combat vs. non-combat, independent of their branch of service.
Using a two-way between-subjects ANOVA, which sources of variation is placed in the denominator of the test statistic?a. The between-groups source of variation.b. The interaction source of variation.c. The within-groups source of variation.
Using a two-way between-subjects ANOVA, how many between-groups sources of variation are computed?Answer: ____[enter whole number]
The sample size assuming this study is a mixed factorial design in which the second factor is a within-subjects factor.Answer: ____[enter whole number]
The sample size assuming this study is a mixed factorial design in which the first factor is a within-subjects factor.
The sample size assuming this study is a between-subjects factorial design.
The sample size assuming this study is a within-subjects factorial design.
A researcher asks a group of participants to watch each of two marketing commercials(Factor A: commercials) for each of two products (Factor B: products), and rate the effectiveness of each of the four advertisements.
A researcher randomly assigns a sample of consumers to taste test a product that either includes branding or has no branding (Factor A: branding); all participants give three ratings: one for each flavor of the product (Factor B: flavors).
A researcher records the responsiveness of children randomly assigned to watch either educational or non-educational programming (Factor A: programming) that was cast with real actors or cartoon characters (Factor B: casting).
A social scientist asks a sample of students who attend church weekly or not at all to read a vignette describing an immoral act for reasons of preservation, protection, or selfgain. Moral reasoning is measured in this study. Which of the following uses the proper terminology and notation for this
Showing 3900 - 4000
of 8686
First
33
34
35
36
37
38
39
40
41
42
43
44
45
46
47
Last
Step by Step Answers