New Semester Started
Get
50% OFF
Study Help!
--h --m --s
Claim Now
Question Answers
Textbooks
Find textbooks, questions and answers
Oops, something went wrong!
Change your search query and then try again
S
Books
FREE
Study Help
Expert Questions
Accounting
General Management
Mathematics
Finance
Organizational Behaviour
Law
Physics
Operating System
Management Leadership
Sociology
Programming
Marketing
Database
Computer Network
Economics
Textbooks Solutions
Accounting
Managerial Accounting
Management Leadership
Cost Accounting
Statistics
Business Law
Corporate Finance
Finance
Economics
Auditing
Tutors
Online Tutors
Find a Tutor
Hire a Tutor
Become a Tutor
AI Tutor
AI Study Planner
NEW
Sell Books
Search
Search
Sign In
Register
study help
business
probability statistics
Statistics For The Behavioral Sciences 4th Edition Gregory J Privitera - Solutions
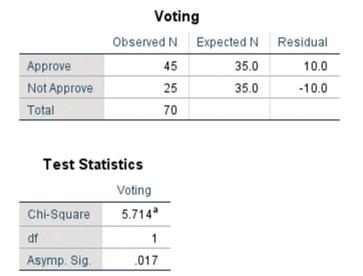
What is the p value for this chi-square goodness-of-fi t test?Answer: ____[enter number exactly as shown in the table]
For this analysis, what is the value of the chi-square (χ2) test statistic?Answer: ____[enter number exactly as shown in the table]
How many comparisons are made to evaluate a significant chi-square goodness-of-fit test?a. 1 comparisonb. 2 comparisonsc. N comparisonsd. k comparisons
For a chi-square goodness-of-fit test we compare the discrepancy between observed and expected frequencies ____ of the categorical variable.a. at each levelb. across the levels
For this analysis, what is the value of the chi-square (χ2) test statistic?Answer: ____[enter number to the hundredths place: 0.00]
What is the decision for this chi-square goodness-of-fit test?a. Fail to reject the null hypothesis; the children did not show a preference for either type of color.b. Reject the null hypothesis; the children showed a preference for dark colorsc. Reject the null hypothesis; the children showed a
What is the decision for this chi-square goodness-of-fit test?a. Fail to reject the null hypothesis; the production of the premium lagers matches with the observed consumer preferences.b. Reject the null hypothesis; production of the premium lagers does not match with the consumer preferences.
For this analysis, what is the value of the chi-square (χ2) test statistic?Answer: ____[enter number to the hundredths place: 0.00]
Using a chi-square goodness-of-fit test, what is the scale of measurement of the data?a. nominalb. ordinalc. interval or ratio
Using the chi-square goodness-of-fit test, which of the following is the statistical assumption that must be met?a. The number of levels of the categorical variable is at least k = 5.b. The frequency expected is at least f e= 5 at each level of the categorical variable.c. The sample size is at
A study conducted at a .05 level of significance in a sample of 24 potential voters asked to choose which of three opposing policies they would support.Answer: ____[enter value exactly as shown in the table]
A study conducted at a .05 level of significance with a sample of 20 students asked to choose one of two newly proposed courses for their major.Answer: ____[enter value exactly as shown in the table]
The degrees of freedom for a study in which the critical value = 7.81 for a test at α = .05.Answer: ____[enter whole number]
The degrees of freedom for a study in which the critical value = 3.84 for a test at a .05 level of significance.Answer: ____[enter whole number]
In the formula of the test statistic for a chi-square test, where do we account for the“relative size of a discrepancy” in each category or at each level of the categorical variable:in the numerator or in the denominator? Answer N for numerator or D for denominator.Answer: ____[enter N or D]
In the formula of the test statistic for a chi-square test, where do we compute the“discrepancy” or the squared difference between the frequency observed and the frequency expected: in the numerator or in the denominator? Answer N for numerator or D for denominator.Answer: ____[enter N or D]
What is the expected frequency for those choosing to obtain their news mostly from other news sources?Answer: ____[enter whole number]
Using a chi-square goodness-of-fit test, we compare the discrepancy between the observed and expected frequencies across ____ level(s) of the one categorical variable. [Fill in the blank]a. 1b. 2c. 2 or more
How many nominal variables are tested using a chi-square goodness-of-fit test?a. 1b. 2c. 2 or more
Which of the following is true about the chi-square test?a. It is a nonparametric test.b. It is used to evaluate the count or frequency at each level of one or two nominal variables.c. Both a and b are correct.
Using statistical tests for nominal data, the “data” area. the count or frequency at each level of the nominal variable.b. the mean scores recorded at each level of the nominal variable.c. the variance of scores recorded at each level of the nominal variable.
The observed frequencies for a chi-square test can be summarized in a figure or a table or in the main text.a. Trueb. False
To summarize the chi-square goodness-of-fit test, which of the following is reported?a. test statisticb. p valuec. degree of freedomd. All of these are reported.
Was the assumption of minimum expected frequency met for this test?a. No, 0% of cells have an expected count less than 5.b. Yes, 0% of cells have an expected count less than 5.c. It is not possible to know this based on the SPSS output table alone.
Which of the following is the decision for the chi-square test for independence?a. Fail to reject the null hypothesis, χ2(1) = 2,836, p = .092.b. Reject the null hypothesis, χ2(1) = 2.836, p = .092.
Using SPSS, which options in the menu bar do you select to compute the chi-square test for independence?a. Analyze, then Compare Means and Means.b. Analyze, then Descriptive statistics and Crosstabs.c. Analyze, then Nonparametric tests, then Legacy Dialogs, and Chi-square.
A researcher computes a 4 × 4 chi-square test for independence and computes the following effect size: V = .32. This effect size is ______. [Fill in the blank]a. smallb. mediumc. large
A researcher computes a 3 × 4 chi-square test for independence with a sample of 80 participants, with χ2= 9.76. What is the value of Cramer’s V?a. .061b. .247c. .349
Which of the following measures of effect size can be reported with a 3 × 4 chi-square test for independence?a. proportion of varianceb. the phi coefficientc. Cramer’s Vd. All of these can be reported.
The phi correlation coefficient and the chi-square test statistic are related, in that we can use the value of one to compute the other.a. Trueb. False
A researcher selects a sample of 110 participants and computes the following phi correlation coefficient: rϕ = .31. What is the value of χ2?a. 3.84b. 10.57c. 34.10
The interpretation of a 2 × 2 chi-square test for independence is similar to what other type of statistical test?a. goodness-of-fit chi-square testb. 2 × 2 analysis of variancec. phi correlation coefficient
What is the decision using a chi-square test for independence?a. Fail to reject the null hypothesis.b. Reject the null hypothesis.
Computing a chi-square test for independence, what is the value of the test statistic?a. 1.00b. 1.47c. 2.22
A researcher conducts a 2 × 3 chi-square test for independence. What are the degrees of freedom for this test?a. 2b. 3c. 6
When computing a chi-square test, the frequency expected in a given cell should never be less thana. the sample size.b. the frequency observed.c. five.
If two categorical variables are dependent, then they area. relatedb. correlatedc. Both a and b are correct.
Two categorical variables are independent when we ____ the null hypothesis; they are related when we ____ the null hypothesis. [Fill in the blanks]a. reject; fail to rejectb. fail to reject; reject
The chi-square test for independence is interpreted similar to aa. t testb. ANOVAc. correlation
Which of the following is the decision for the chi-square goodness-of-fit test?a. Fail to reject the null hypothesis, χ2(1) = 5.714, p = .017.b. Reject the null hypothesis, χ2(1) = 5.714, p = .017.
Based on the expected frequency given in the table, what was the null hypothesis?a. H0= p = .40 for the approve category and p = .60 for the not approve category.b. H0= p = .35 for the approve category and p = .35 for the not approve category.c. H0= p = .50 in each voting category Voting Observed N
Using SPSS, which options in the menu bar do you select to compute the chi-square goodness-of-fit test?a. Analyze, then Compare Means and Meansb. Analyze, then Descriptive statistics and Crosstabsc. Analyze, then Nonparametric tests, then Legacy Dialogs, and Chi-square
The chi-square goodness-of-fit test is one of the few hypothesis tests that can intentionally be used to confirm that a null hypothesis is correct.a. Trueb. False
To appropriately interpret the chi-square goodness-of-fit test, it is necessary to compare differencesa. at each level of the categorical variable.b. across the levels of the categorical variable.c. within and between expected frequencies.
What is the decision using a chi-square goodness-of-fit test?a. Fail to reject the null hypothesis.b. Reject the null hypothesis.
Computing a chi-square goodness-of-fit test, what is the value of the test statistic?a. 9.50b. 10.42c. 12.10
When observed frequencies are a “good fit” with expected frequencies, what decision do we make using the chi-square goodness-of-fit test?a. Fail to reject the null hypothesis.b. Reject the null hypothesis.
Which of the following is a statistical assumption for the chi-square goodness-of-fit test?a. independenceb. minimum expected frequency of at least 5 in each categoryc. Both a and b are correct.
A researcher compares the frequency of students participating in three academic clubs that compete in a competition each year. If a chi-square goodness-of-fit test were conducted on these data, what would the degrees of freedom be for this test?a. 2b. 3c. 4
A chi-square goodness-of-fit test shows that the frequencies observed equal those that were expected. Hence, the value of the test statistic is ______. [Fill in the blank]a. equal to 0b. less than 0c. greater than 0
The test statistic measures the ____ size of the discrepancy in each category or at each level of the categorical variable. [Fill in the blank].a. actualb. relativec. absolute
Assuming equal proportions expected for each professor, what are the expected frequencies for each professor?a. 6b. 8c. 12
How many students were counted in this study?a. 5b. 7c. 12d. 24
The ____ is a nonparametric statistical procedure used to test hypotheses about the discrepancy between the observed and expected frequencies for the levels of a single categorical variable or two categorical variables observed together. [Fill in the blank]a. chi-square testb. χ2 testc. Both a and
For data that are counts or frequencies at each level of a nominal, categorical variable, we require hypothesis tests that use test statistics thata. analyze the variance of the data.b. do not analyze the variance of the data.c. are not used to test for the significance of an effect.
To report the results of an analysis of regression using APA format, which value is typically reported for a multiple regression analysis but not often reported for a linear regression analysis with one predictor variable?a. coefficientb. degrees of freedomc. estimate of effect size
Which factor, when added to the regression equation, did not significantly improve predictions of employee turnover? Enter F for the fairness factor and C for the collaboration factor.
Which factor, when added to the regression equation, significantly improved predictions of employee turnover? Enter F for the fairness factor and C for the collaboration factor.
Using the values given in the table, identify the value of the value of the test statistic for the analysis of multiple regression.Answer: ____ [enter number exactly as shown in the table]
The standardized beta coefficient accounts fora. the standard distance that data points fall from the regression line.b. the extent to which each predictor variable can explain the residual variation.c. the combined contribution of all predictor variables, including any overlap with other predictor
For linear regression with one predictor variable, β will ____ r. [Fill in the blank]a. equalb. be less thanc. be greater thand. be more accurate than
To standardize the beta coefficients, we firsta. analyze the significance of each data point.b. analyze the residual variation.c. convert the original data to standardized z scores.d. compute the standard error of estimate.
What is the value of the sum of squares for the total variance in Y (SSY)?Answer: ____ [enter whole number]
What is the decision for this test?a. Fail to reject the null hypothesis.b. Reject the null hypothesis.
Compute the relative contribution of the number of social relationships (X2) on mental well-being (Y). Which of the following conclusions is correct?a. Fail to reject the null hypothesis; adding the number of social relationships (X2) to the regression equation does not significantly improve
Compute the relative contribution of time spent with family (X1) on mental well-being(Y). Which of the following conclusions is correct?a. Fail to reject the null hypothesis; adding time spent with family (X1) to the regression equation does not significantly improve predictions of mental
What is the value of the sum of squares for the total variance in Y (SSY)?Answer: ____ [enter whole number]
What is the decision for this analysis of multiple regression?a. Fail to reject the null hypothesis.b. Reject the null hypothesis.
Compute the relative contribution of attitudes toward the importance of education (X2)on a child’s academic success (Y). Which of the following conclusions is correct?a. Fail to reject the null hypothesis; adding attitudes toward the importance of education (X2) to the regression equation does
Compute the relative contribution of parental involvement (X1) on a child’s academic success (Y). Which of the following conclusions is correct?a. Fail to reject the null hypothesis; adding parental involvement (X1) to the regression equation does not significantly improve predictions of academic
What is the decision for this analysis of multiple regression?a. Fail to reject the null hypothesis.b. Reject the null hypothesis.
What is the value of the sum of squares for the total variance in Y (SSY)?Answer: ____ [enter whole number]
Which of the following is a statistical assumption only when multiple predictor variables are analyzed using regression?a. multicollinearityb. normality of errorsc. homoscedasticityd. linearity
Which of the following is a statistical assumption for multiple regression that can be evaluated using the variance infl ation factor?a. linearityb. homoscedasticityc. multicollinearityd. normality of errors
A key advantage for including multiple predictor variables in the equation of a regression line is that it allows you toa. detect mean diff erences between groups for each criterion variable.b. show cause-and-eff ect because many predictor variables are added.c. detect the extent to which two or
Multiple regression is a statistical method that includes ______ predictor variable(s) in the equation of the regression line. [Fill in the blank]a. zerob. onec. twod. two or more
What is the decision for this test?a. Fail to reject the null hypothesis; sleep quality does not predict changes in life satisfaction.b. Reject the null hypothesis; a healthier sleep quality predicts a higher life satisfaction.c. Reject the null hypothesis; a healthier sleep quality predicts a
Using the values given in the table, identify the value of the test statistic for this analysis of regression.Answer: ____ [enter number exactly as shown in the table]
Using the values given in the table, identify the value of the coeffi cient of determination for this analysis.Answer: ____ [enter number exactly as shown in the table]
A researcher computes a perfect positive correlation in which each data point falls exactly on the regression line. In this example, the value of the standard error of estimate will be ______.a. equal to 0b. less than 0c. greater than 0
What is the value of the standard error of estimate?
What is the decision for this test?a. Fail to reject the null hypothesis.b. Reject the null hypothesis.
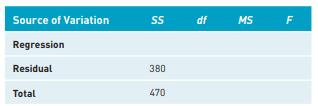
What is the decision for this test?a. Fail to reject the null hypothesis.b. Reject the null hypothesis. Source of Variation SS df MS F Regression Residual Total 380 470
What is the value of mean square error (MSE) in this table? Source of Variation SS df MS F Regression Residual Total 380 470
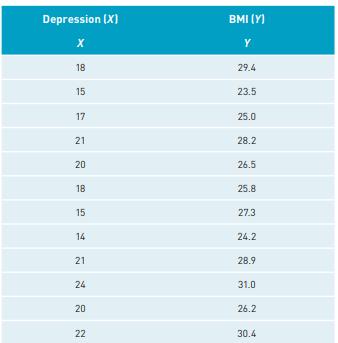
What is the decision for this analysis of regression?a. Fail to reject the null hypothesis; Depression levels do not predict changes in BMI(obesity).b. Reject the null hypothesis; Higher levels of depression predict lower levels of BMI(obesity).c. Reject the null hypothesis; Higher levels of
What is the value of the variance in the criterion variable (SSY)? Depression (X) BMI (Y) Y 18 29.4 15 23.5 17 25.0 21 28.2 20 26.5 18 25.8 15 27.3 14 24.2 21 28.9 24 31.0 20 26.2 22 30.4
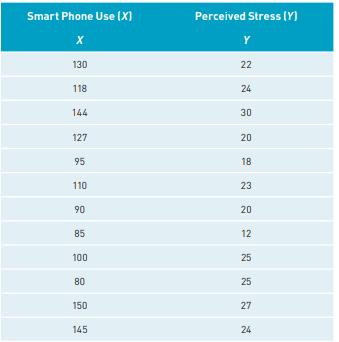
What is the decision for this analysis of regression?a. Fail to reject the null hypothesis; Smartphone use does not predict perceived stress among students.b. Reject the null hypothesis; Greater smartphone use predicts lower perceived stress among students.c. Reject the null hypothesis; Greater
What is the value of the variance in the criterion variable (SSY)?
Which assumption for an analysis of regression can be tested using the Durbin-Watson statistic?a. linearityb. homoscedasticityc. independence of errorsd. the normality of errors
Pertaining to the assumptions for an analysis of regression, as sample size increases, conclusions regarding ____ tend to be more definitive?a. linearityb. homoscedasticityc. the normality of errorsd. All of these.
Using an analysis of regression, which source of variation measures the variance in Y that is associated with error?a. The regression variation.b. The residual variation.c. The coefficient of determination.
Using an analysis of regression, which source of variation measures the variance in Y that is related to or predicted by changes in X?a. The regression variation.b. The residual variation.c. The coefficient of determination.
The variability measure by the residual variation, measures variation in Answer: ____ [enter X or Y]
The variability measured by the regression variation, measures variation in Answer: ____ [enter X or Y]
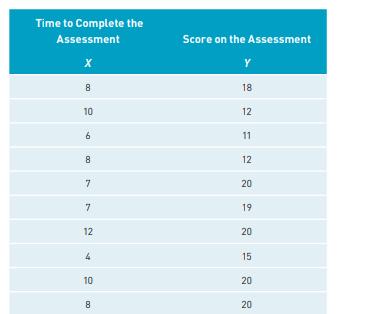
If a student takes the average time of 8 minutes (X = 8) on complete their assessment, then what do we predict will be their score on the assessment? Hint: Use the regression equation to find your answer.
What is the value of the y-intercept (a) for the equation of the regression line? Time to Complete the Assessment 8 Score on the Assessment 18 10 12 6 11 8 12 7 20 20 7 19 12 20 20 10 8 15 20 52 20 20
What is the value of the slope (b) for the equation of the regression line? Time to Complete the Assessment 8 Score on the Assessment 18 10 12 6 11 8 12 7 20 20 7 19 12 20 20 10 8 15 20 52 20 20
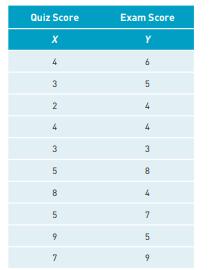
If a student scores a 7 (X = 7) on their quiz, then what do we predict will be their score on the exam? Quiz Score Exam Score X Y 5 3 5 8 5 7 5 7
What is the value of the y-intercept (a) for the equation of the regression line?Answer: ____ [enter number to the hundredths place: .00] Quiz Score Exam Score X Y 5 3 5 8 5 7 5 7
What is the value of the slope (b) for the equation of the regression line?Answer: ____ [enter number to the hundredths place: .00] Quiz Score Exam Score X Y 5 3 5 8 5 7 5 7
Showing 3700 - 3800
of 8686
First
31
32
33
34
35
36
37
38
39
40
41
42
43
44
45
Last
Step by Step Answers