New Semester Started
Get
50% OFF
Study Help!
--h --m --s
Claim Now
Question Answers
Textbooks
Find textbooks, questions and answers
Oops, something went wrong!
Change your search query and then try again
S
Books
FREE
Study Help
Expert Questions
Accounting
General Management
Mathematics
Finance
Organizational Behaviour
Law
Physics
Operating System
Management Leadership
Sociology
Programming
Marketing
Database
Computer Network
Economics
Textbooks Solutions
Accounting
Managerial Accounting
Management Leadership
Cost Accounting
Statistics
Business Law
Corporate Finance
Finance
Economics
Auditing
Tutors
Online Tutors
Find a Tutor
Hire a Tutor
Become a Tutor
AI Tutor
AI Study Planner
NEW
Sell Books
Search
Search
Sign In
Register
study help
business
probability statistics
Statistics For The Behavioral Sciences 4th Edition Gregory J Privitera - Solutions
What is the value of the test statistic, χR 2?Answer: ____ [enter number exactly as shown in the table]
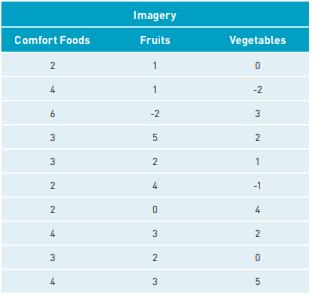
Which of the following is the decision for the Friedman test at a .05 level of significance?a. Fail to reject the null hypothesis.b. Reject the null hypothesis. Comfort Foods 2 Imagery Fruits Vegetables 1 0 4 1 -2 6 -2 3 3 3 5 2 2 1 2 -1 2 0 3 2 3 2 0 4 3 5
Which of the following is the null hypothesis for the Friedman test?a. The mean difference between groups is equal to 0.b. The ranks between two groups are equally dispersed.c. The sum of ranks in each group does not differ.
Which nonparametric test can be used as an alternative to the one-way within-subjects ANOVA?a. the Kruskal-Wallis H testb. the Mann-Whitney U testc. the Wilcoxon signed-ranks T testd. the Friedman test
What is the decision for this Kruskal-Wallis H test?a. Fail to reject the null hypothesis.b. Reject the null hypothesis.
What is the value of the test statistic, H?Answer: ____ [enter number exactly as shown in the table]
Which of the following is the decision for the Kruskal-Wallis H test at a .05 level of signifi cance?a. Fail to reject the null hypothesis; streaming did not signifi cantly improve productivity.b. Reject the null hypothesis; streaming signifi cantly improved productivity.
Compute a Kruskal-Wallis H test on these data. What is the value of the test statistic, H?Answer: ____[enter number to hundredths place: 0.00]
Which of the following is the null hypothesis for the Kruskal-Wallis H test?a. Th e ranks between two groups are equally dispersed.b. Th e mean diff erence between groups is equal to 0.c. Th e sum of ranks in each group does not diff er.
Which nonparametric test can be used as an alternative to the one-way between-subjects ANOVA?a. the Friedman testb. the Wilcoxon signed-ranks T testc. the Mann-Whitney U testd. the Kruskal-Wallis H test
What is the decision for this Mann-Whitney U test?a. Fail to reject the null hypothesis; grade changes were not diff erent for children based on their parent’s level of involvement in their education.b. Reject the null hypothesis; student grades were signifi cantly better if their parents were
What is the value of the test statistic, U?Answer: ____ [enter number exactly as shown in the table]
A researcher computes a Mann-Whitney U test in which U = 182, nA = 21, and nB = 22.What is the decision for this test for a two-tailed test at a .05 level of significance?a. Fail to reject the null hypothesis.b. Reject the null hypothesis.
A researcher computes a Mann-Whitney U test in which U = 64, nA = 20, and nB = 18.What is the decision for this test for a two-tailed test at a .05 level of significance?a. Fail to reject the null hypothesis.b. Reject the null hypothesis.
Which of the following is the decision for the Mann-Whitney U test for a two-tailed test at a .05 level of significance?a. Fail to reject the null hypothesis; student scores did not differ between the presentation groups.b. Reject the null hypothesis; students scored higher with the multimedia
Compute a Mann-Whitney U test on these data. What is the value of the test statistic, U?Answer: ____ [enter whole number]
Which of the following is the null hypothesis for the Mann-Whitney U test?a. Th e ranks between two groups are equally dispersed.b. Th e mean diff erence between groups is equal to 0.c. An equal number of scores fall above and below the median.
Which nonparametric test can be used as an alternative to the two-independent-sample t test?a. the Friedman testb. the Kruskal-Wallis H testc. the Mann-Whitney U testd. the Wilcoxon signed-ranks T test
What is the decision for this Wilcoxon signed-ranks T test?a. Fail to reject the null hypothesis; there is no diff erence in bolded versus regular font key terms recalled.b. Reject the null hypothesis; students recalled signifi cantly more key terms in bold type than in regular font.c. Reject the
What is the value of the test statistic, T, for the smaller sum of ranks?
A researcher computes a Wilcoxon signed-ranks T test in a sample of 28 participants with T = 362. What is the value of the test statistic, z, for the normal approximation?Answer: ____[enter number to the hundredths place: .00]
A researcher computes a Wilcoxon signed-ranks T test in a sample of 32 participants with T = 400. What is the value of the test statistic, z, for the normal approximation?Answer: ____[enter number to the hundredths place: .00]
Which of the following is the decision for the Wilcoxon signed-ranks T test for a twotailed test at a .05 level of significance?a. Fail to reject the null hypothesis; consumers are not willing to spend more on a generic compared to a brand name product.b. Reject the null hypothesis; consumers are
Compute a Wilcoxon signed-ranks T test on these data. What is the value of the test statistic, T?Answer: ____ [enter whole number]
Which of the following is the null hypothesis for the Wilcoxon signed-ranks T test?a. Th e mean diff erence between groups is equal to 0.b. Th ere is no diff erence in ranks between groups.c. An equal number of scores fall above and below the median.
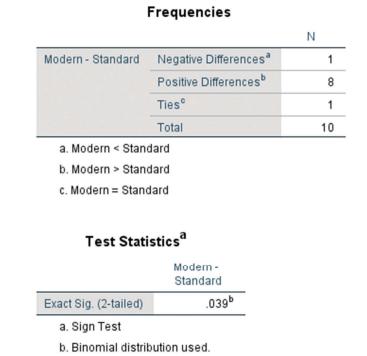
What is the decision for this related-samples sign test?a. Fail to reject the null hypothesis.b. Reject the null hypothesis.
What is the value of the test statistic, x, for the number of positive diff erences?Answer: ____ [enter number exactly as shown in the table]
A researcher computes a related-samples sign test in a sample of 100 participants with x = 68. Given that p = .50, as stated in the null hypothesis, what is the value of the test statistic, z, for the normal approximation?
A researcher computes a related-samples sign test in a sample of 25 participants with x = 16. Given that p = .50, as stated in the null hypothesis, what is the value of the test statistic, z, for the normal approximation?Answer: ____[enter number to hundredths place: 0.00]
Which of the following is the decision for the related-samples sign test for a two-tailed test at a .05 level of significance?a. Fail to reject the null hypothesis; participants scores were not significantly different when visual versus auditory cues were added.b. Reject the null hypothesis;
Compute a related-samples sign test on these data. What is the value of the test statistic, x, for the number of plusses?Answer: ____[enter whole number]
Which of the following is the null hypothesis for the related-samples sign test?a. The mean difference between groups is equal to 0.b. There is an equal number of positive and negative difference scores.c. An equal number of scores fall above and below the median.
Which nonparametric test can be used as an alternative to the related-samples t test?a. the Friedman testb. the Kruskal-Wallis H testc. the Mann-Whitney U testd. the related-samples sign test
Which of the following is the decision for this one-sample sign test at a .05 level of significance (two-tailed test)?a. Fail to reject the null hypothesis; scores in this sample did not significantly differ from the median score in the population.b. Reject the null hypothesis; scores in this
What is the value of the test statistic, x, for the number of minuses?Answer: ____ [enter whole number]
Which of the following is the null hypothesis for the one-sample sign test?a. The mean score in the population is equal to 0.b. An equal number of scores fall above and below the mean.c. An equal number of scores fall above and below the median.
Which nonparametric test can be used as an alternative to the one-sample t test?a. the one-sample sign testb. the Mann-Whitney U testc. the Kruskal-Wallis H testd. the Friedman test
When tied ranks are present in an ordinal data set, this can ____ the decision to reject or fail to reject the null hypothesis. [Fill in the blank]a. biasb. validatec. strengthen
Particularly with larger sample sizes, tests for ordinal data can increase the power to detect an effect when data area. symmetrically distributed.b. normally distributed.c. skewed with outliers.
Which of the following explains why the test statistic for a parametric test is inappropriate for ordinal data?a. Ordinal data meaningfully convey distance; therefore, ordinal data require test statistics that include measures of variance.b. Ordinal data do not meaningfully convey distance;
Tests for ordinal data are often used when one or more of the ____ of parametric testing are violated. [Fill in the blank]a. statistical assumptionsb. methodological assumptionsc. scales of measurement
When a nonparametric test statistic has a normal approximation option, the test statistic for the normal approximation, or z score, can be reported.a. Trueb. False
To summarize any nonparametric test, we report which of the following?a. p valueb. test statisticc. degrees of freedom (if applicable)d. All of these are reported.
The image below shows the SPSS output table for the Friedman test for the time(in hours) that 10 college students spent browsing (times: 3, 2, 3, 4, 2, 3, 4, 1, 3, 1), shopping online (corresponding times: 3, 1, 3, 1, 3, 2, 2, 3, 4, 3), and using social media(corresponding times: 4, 3, 5, 5, 4, 6,
Using SPSS, which options in the menu bar do you select to compute the Friedman test?a. Analyze, Nonparametric Tests, then Legacy Dialogs, and Chi-Square.b. Analyze, Nonparametric Tests, then Legacy Dialogs, and 2 Related Samples.c. Analyze, Nonparametric Tests, then Legacy Dialogs, and K Related
A researcher compares changes in gambling behavior at four different gambling tables(k = 4), with the same participants observed at each table. The researcher computes a Friedman test and obtains a test statistic value of = 8.02. What is the decision for this test at a .05 level of significance?a.
When the null hypothesis is true and the number of participants per group is at least n =5, the test statistic χR 2approximates what kind of distribution?a. normal distributionb. chi-square distributionc. negatively skewed distribution
The Friedman test is a nonparametric alternative to thea. related-samples t test.b. two-independent-sample t test.c. one-way between-subjects ANOVA.d. one-way within-subjects ANOVA.
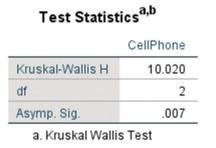
The image below shows the SPSS output table for the Kruskal-Wallis H test for the time (in minutes) that participants stayed on task while studying with a friend (times:25, 26, 28, 21, 14, 18, 22, 20, 18, 24), with a stranger (times: 25, 34, 35, 28, 20, 36, 18, 22, 35, 27), or alone (times: 28, 26,
Using SPSS, which options in the menu bar do you select to compute the Kruskal-Wallis H test?a. Analyze, Nonparametric Tests, then Legacy Dialogs, and 2 Independent Samples.b. Analyze, Nonparametric Tests, then Legacy Dialogs, and K Independent Samples.c. Analyze, Nonparametric Tests, then Legacy
A researcher compares differences in spending habits in five groups (k = 5), with different participants observed in each group. The researcher computes a KruskalWallis H test and obtains a test statistic value of H = 10.77. What is the decision for this test at a .05 level of significance?a. Fail
When the null hypothesis is true and the number of participants per group is at least n =5, the test statistic H approximates what kind of distribution?a. normal distributionb. negatively skewed distributionc. chi-square distribution
The Kruskal-Wallis H test is a nonparametric alternative to thea. related-samples t test.b. two-independent-sample t test.c. one-way between-subjects ANOVA.d. one-way within-subjects ANOVA.
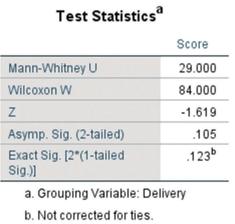
The image below shows the SPSS output table for the Mann-Whitney U test for the following 10 scores on a standardized assessment delivered either in print (scores: 5, 4, 6, 5, 5, 3, 4, 4, 7, 8) or electronically (scores: 7, 6, 7, 8, 5, 7, 6, 4, 5, 6). [Please feel free to enter these data in SPSS
Using SPSS, which options in the menu bar do you select to compute the Mann-Whitney U test?a. Analyze, Nonparametric Tests, then Legacy Dialogs, and K Independent Samples.b. Analyze, Nonparametric Tests, then Legacy Dialogs, and 2 Independent Samples.c. Analyze, Nonparametric Tests, then Legacy
A researcher selects a sample of 25 participants and records U = 100. What is the value of the normal approximation for this Mann-Whitney U test at a .05 level of significance?a. z = 4.12b. z = −4.12
Suppose a researcher selects a sample of 14 participants (n = 7 per group) and records a test statistic value of U = 8 for a Mann-Whitney U test. What is the decision for this test at a .05 level of significance?a. Fail to reject the null hypothesis.b. Reject the null hypothesis.
Smaller values of U are ____ likely to occur if the null hypothesis is true. [Fill in the blank]a. lessb. morec. equally
The Mann-Whitney U test is a nonparametric alternative to thea. one-sample t test.b. related-samples t test.c. two-independent-sample t test.
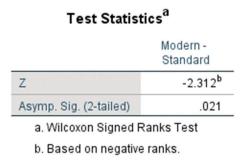
The image below shows the SPSS output table for a Wilcoxon signed-ranks T test for the time (in minutes per hour) spent on task among 10 students in a standard classroom(times: 45, 46, 48, 41, 34, 38, 42, 40, 38, 44) and in a modern classroom (corresponding times: 45, 54, 55, 48, 40, 56, 38, 42,
Using SPSS, which options in the menu bar do you select to compute the Wilcoxon signed-ranks T test?a. Analyze, Nonparametric Tests, then Legacy Dialogs, and 2 Related Samples.b. Analyze, Nonparametric Tests, then Legacy Dialogs, and K Related Samples.c. Analyze, Nonparametric Tests, then Legacy
A researcher selects a sample of 15 participants and records T = 25. What is the value of the normal approximation for this Wilcoxon signed-ranks T test at a .05 level of significance?a. z = 1.988b. z = −1.988
Suppose a researcher selects a sample of 11 participants and records a test statistic value of T = 15 for a Wilcoxon signed-ranks T test. What is the decision for this test at a.05 level of significance?a. Fail to reject the null hypothesis.b. Reject the null hypothesis.
Using the Wilcoxon signed-ranks T test, the larger the value of the test statistic, T, the more likely we are to reject the null hypothesis.a. Trueb. False, smaller values for the test statistic make it more likely that we will reject the null hypothesis.
The Wilcoxon signed-ranks T test is a nonparametric alternative to thea. one-sample t test.b. related-samples t test.c. two-independent-sample t test.
The image below shows the SPSS output table for a related-samples sign test for the time(in minutes per hour) spent on task among 10 students in a standard classroom (times:45, 46, 48, 41, 34, 38, 42, 40, 38, 44) and in a modern classroom (corresponding times: 45, 54, 55, 48, 40, 56, 38, 42, 55,
Using SPSS, which options in the menu bar do you select to compute the relatedsamples sign test?a. Analyze, then Compare Means and Means.b. Analyze, Nonparametric Tests, then Legacy Dialogs, and Binomial.c. Analyze, Nonparametric Tests, then Legacy Dialogs, and 2 Related Samples.
A researcher selects a sample of 30 participants and records x = 24. What is the value of the normal approximation for this sign test at a .05 level of significance?a. z = 3.286b. z = −3.286c. A normal approximation for the sign test cannot be computed.
Suppose a researcher selects a sample of 16 participants and records a test statistic value of x = 12 for a sign test. What is the decision for this test at a .05 level of significance?a. Fail to reject the null hypothesis.b. Reject the null hypothesis.
Using the one-sample sign test, scores above the median are recorded with a ____ sign, and scores below the median are recorded with a ____ sign. [Fill in the blanks]a. minus; plusb. plus; minus
The sign test is a nonparametric alternative to thea. one-sample t test.b. related-samples t test.c. Both a and b are correct.
Test for ordinal data can increase the power to detect an effect when data are skewed with outliers, especially with larger sample sizes.a. Trueb. False
Tests for ordinal data meaningfully convey information regardinga. varianceb. differencesc. ratios
An advantage of using nonparametric tests is that these tests generally require ______ assumptions about the data in a population. [Fill in the blank]a. substantially moreb. no or very limitedc. ignoring or disregarding
Which of the following is a correct summary of a chi-square test using APA style?a. χ2(1)= 4.25, p < .05.b. χ2= 3.92, p > .05.c. χ2(1)= 4.77, V = .12.
A researcher reports the following fi ndings for a chi-square test: χ2= 4.25, p < .05. Which value in the report is missing for using proper APA style?a. the value of the test statisticb. the degrees of freedomc. the p value
Based on the pattern of the data, which of the following is the most appropriate conclusion for these data?a. Students do not show a preference for reading electronic and print books for the purpose of pleasure or for research.b. Students show a preference for using a print book for the purpose of
What is the p value for this chi-square test for independence?Answer: ____[enter number exactly as shown in the table]
For this analysis, what is the value of the chi-square (χ2) test statistic?Answer: ____[enter number exactly as shown in the table]
A researcher selects a sample of 100 participants and computes χ2= 6.25. What is the effect size for this test using the phi coefficient?Answer: ____[enter number the hundredths place: .00]
A researcher selects a sample of 50 participants and computes the following phi correlation coefficient: rϕ = .30. What is the value of χ2?Answer: ____[enter number the hundredths place: 0.00]
A researcher selects a sample of 100 participants and computes the following phi correlation coefficient: rϕ = .25. What is the value of χ2?Answer: ____[enter number the hundredths place: 0.00]
The interpretation of a 2 × 2 chi-square test for independence is similar to what other type of statistical test?a. the chi-square goodness-of-fit testb. the 2 × 2 factorial ANOVAc. the phi correlation coefficient
Which of the following correctly summarizes the effect size for this test, using Cramer’s V as the measure of effect size?a. The route of persuasion used (central, peripheral) accounts for 20% of the total variance in choices made for a product that differed by cost.b. The route of persuasion
What is the decision for this chi-square goodness-of-fit test?a. Fail to reject the null hypothesis; routes of persuasion and product cost are independent.b. Fail to reject the null hypothesis; routes of persuasion are related to product cost.c. Reject the null hypothesis; routes of persuasion and
For this analysis, what is the value of the chi-square (χ2) test statistic?Answer: ____[enter whole number]
Which of the following correctly summarizes the effect size for this test, using Cramer’s V as the measure of effect size?a. The consumer concerns for the environment (serious, modest) accounts for about 7% of the total variance in choices made based on how the product was labeled.b. The consumer
What is the decision for this chi-square goodness-of-fit test?a. Fail to reject the null hypothesis; consumer concerns for the environment are independent of their choice based on how the product was labeled.b. Fail to reject the null hypothesis; consumer concerns for the environment are related to
For this analysis, what is the value of the chi-square (χ2) test statistic?Answer: ____[enter whole number]
Using a chi-square test for independence, what is the scale of measurement of the data?a. nominalb. ordinalc. interval or ratio
The statistical assumption for the chi-square test for independence is the same as that for which statistical test?a. related-samples t testb. Pearson correlation coefficientc. chi-square goodness-of-fit test
A researcher evaluates the relationship between leadership level (foreman, supervisor, manager) and productivity (below standards, meets standards, exceeds standards) using a chi-square test for independence. What are the degrees of freedom for this test?Answer: ____[enter whole number]
A researcher evaluates the relationship between cell phone use (occasionally, often) and stress levels (low, moderate, high) using a chi-square test for independence. What are the degrees of freedom for this test?Answer: ____[enter whole number]
What is the expected frequency for students not attending the study session and failing the exam?Answer: ____[enter whole number]
What is the expected frequency for students attending the study session and passing the exam?Answer: ____[enter whole number]
A researcher computes a chi-square test for independence and decides to reject the null hypothesis. Thus, the decision is thata. two categorical variables are related.b. two categorical variables are independent.
Which decision for a chi-square test for independence is a decision that two categorical variables are independent?a. Fail to reject the null hypothesis.b. Reject the null hypothesis.
A researcher computes a 2 × 3 chi-square test for independence. How many total groups are observed in this study?Answer: ____[enter whole number]
A researcher computes a chi-square test for independence with 4 groups. Which of the following gives the correct notation for this study?a. 2 × 2 chi-square test for independenceb. 4 × 4 chi-square test for independencec. 4-way chi-square test for independence
If the health psychologist were to give the goalkeeper advice based on these data, which of the following is the best advice that the psychologist could give them?a. It does not matter which direction you jump to block a penalty kick because players do not show a preference for where they kick the
Showing 3600 - 3700
of 8686
First
30
31
32
33
34
35
36
37
38
39
40
41
42
43
44
Last
Step by Step Answers