New Semester Started
Get
50% OFF
Study Help!
--h --m --s
Claim Now
Question Answers
Textbooks
Find textbooks, questions and answers
Oops, something went wrong!
Change your search query and then try again
S
Books
FREE
Study Help
Expert Questions
Accounting
General Management
Mathematics
Finance
Organizational Behaviour
Law
Physics
Operating System
Management Leadership
Sociology
Programming
Marketing
Database
Computer Network
Economics
Textbooks Solutions
Accounting
Managerial Accounting
Management Leadership
Cost Accounting
Statistics
Business Law
Corporate Finance
Finance
Economics
Auditing
Tutors
Online Tutors
Find a Tutor
Hire a Tutor
Become a Tutor
AI Tutor
AI Study Planner
NEW
Sell Books
Search
Search
Sign In
Register
study help
business
probability statistics
Statistics For The Behavioral Sciences 4th Edition Gregory J Privitera - Solutions
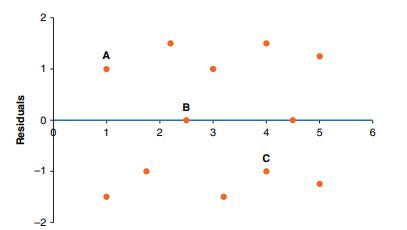
Which data point will have a negative residual value? Residuals -2 -1 1 2 2 B 3 5 6
Which data point will have a positive residual value? Residuals -2 -1 1 2 2 B 3 5 6
Which data point will have a residual value equal to 0? Residuals -2 -1 1 2 2 B 3 5 6
What is the regression line used for?a. It is used to balance a set of data.b. It is used to make prediction of Y given known values of X.c. It is used to split the data so that data can be grouped later for analysis.
The regression line is determined as the line thata. cancels out the distance that data points fall above and below the line.b. makes the sum of the differences of scores from the line equal to 0.c. Both a and b are correct.
The analysis used to answer the question: Are the predictions made from this equation significant?Answer: ____ [enter M or A]
The analysis used to answer the question: Which equation of a straight line can best describe this pattern?Answer: ____ [enter M or A]
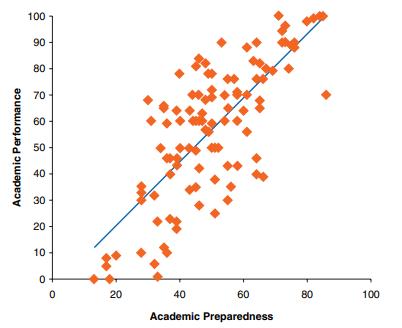
Which variable is academic performance (plotted on the y-axis)? 100 Academic Performance 30 40 90 T T 20 20 50 50 60 70 70 gg 80 90 T - T T - T 10 0 0 20 40 60 80 100 Academic Preparedness
Which variable is academic preparedness (plotted on the x-axis)? 100 Academic Performance 30 40 90 T T 20 20 50 50 60 70 70 gg 80 90 T - T T - T 10 0 0 20 40 60 80 100 Academic Preparedness
Applying the structure of linear regression, we cana. determine group differences.b. predict changes in a criterion variable.c. compare differences across the levels of a categorical variable.
Which of the following is a fundamental reason for using linear regression to analyze data?a. To demonstrate cause-and-effect relationships.b. To determine which groups differ for a given dependent variable.c. To identify predictive relationships between two or more variables.
The scores or data points for a regression analysis are typically reported in a ____. [Fill in the blank]a. scatter plotb. bar chartc. pie chart
For a multiple regression analysis, we typically report which value that is not often reported for a linear regression analysis with one predictor variable?a. effect sizeb. the β coefficientc. p valued. F statistic
Which of the following is the correct summary for the results of the tests for the relative contribution of each predictor variable?a. Education (β = 0.265, p = .283), but not experience (β = −0.585, p = .031), significantly contributed to predictions made with both factors included in the
Which of the following predictor variables significantly increased the prediction of a salary offer compared to that predicted by the other predictor alone?a. educationb. experience
Which of the following is the correct summary for the results for this study?a. An analysis of multiple regression showed that a salary offer (in dollars) is significantly predicted with experience and education as predictor variables, F(2, 10) = 4.505, p = .040.b. An analysis of multiple
The same options in the menu bar are selected to compute an analysis of regression and a multiple regression analysis.a. True.b. False.
Which of the following is the computation to convert the F statistic to a t statistic?a. F2b. √_ Fc. F × t
When we evaluate the relative contribution of each of two predictor variables, we area. determining the significance of the multiple regression analysis.b. determining whether x1 contributes to predicting variance in y beyond that already predicted by x2.c. determining whether X2 contributes to
For linear regression with one predictor variable, β will equal r.a. Trueb. False
For multiple regression, β is usually (but not always) smaller than r because the ability of each predictor variable to predict values of Y usually ____. [Fill in the blank]a. growsb. overlapsc. regresses
Using multiple regression, which coefficients can most accurately identify whether one of the predictor variables is a better predictor?a. the standardized beta coefficientsb. the unstandardized beta coefficients
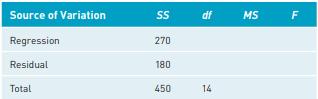
What is the decision for this analysis of regression?a. Fail to reject the null hypothesis, F(1, 13) = 9.78.b. Reject the null hypothesis, F(1, 13) = 9.78.c. Fail to reject the null hypothesis, F(2, 12) = 9.00.d. Reject the null hypothesis, F(2, 12) = 9.00. Source of Variation SS df MS F Regression
What is the value of dfregression?a. 1b. 2c. 12 Source of Variation SS df MS F Regression 270 Residual 180 Total 450 14
For an analysis of regression, when we sum the value of SSregression and SSresidual, what value do we obtain?a. the value of ssxb. the value of ssyc. the total sample size
Which of the following is a statistical assumption only for a regression analysis with multiple predictor variables?a. linearityb. normality of errorsc. multicollinearityd. independence of errors
Which of the following identifies a key advantage of adding multiple predictor variables in a regression equation?a. We can calculate the correlation coefficient and the coefficient of determination.b. We can determine the unique contribution of each of the predictors.c. We can identify the extent
What two values are added to the regression equation for each new predictor variable that is added to the regression equation?a. b and Xb. a and bc. X and Y
______ is a statistical procedure used to determine the extent to which known values for two or more predictor variables in the equation of a regression line are predictive of changes in a criterion variable. [Fill in the blank]a. Correlationb. Regressionc. Multiple regression
Which of the following statements is true?a. Larger values of the standard error of estimate will lead to more accurate predictions of Y given known values of X.b. Smaller values of the standard error of estimate will lead to more accurate predictions of Y given known values of X.
If the MSresidual is 64, then what is the value of the standard error of estimate?a. 8b. 16c. 64
What measure is used to describe the accuracy of predictions made by the equation of a regression line?a. mean square regressionb. mean square residualc. the standard error of estimate
What is the decision for this analysis of regression?a. Fail to reject the null hypothesis, F(1, 10) = 3.04, p > .05.b. Reject the null hypothesis, F(1, 10) = 3.04, p < .05.
What is the value of MSresidual?a. 46b. 140c. 460
For an analysis of regression, when we sum the value of SSregression and SSresidual, what value do we obtain?a. the value of ssxb. the value of ssyc. the total sample size A college administrator measures the SAT scores and high school GPAs of 12 college applicants and computes an analysis of
Which of the following lists the statistical assumptions for an analysis of regression?a. linearity, homoscedasticity, normality of errors, and independence of errorsb. linearity, homoscedasticity, random sampling, and independence of errorsc. linearity, homoscedasticity, normality of errors, and
What is the equation of the regression line for these data points?a. ˆY = −1X + 4.0b. ˆY = 1X + 4.0c. ˆY = −1X + 2.0d. ˆY = 1X + 2.0
What is the y-intercept for these data points?a. a = 2.0 − [(−1.0)(−2.0)] = 0b. a = 2.0 − [(−1.0)(2.0)] = 2.0c. a = 2.0 − [(−1.0)(2.0)] = 4.0
What is the slope for these data points?a. 0b. 1.0c. −1.0
The sum of squares for XY is also calleda. residual variationb. the sum of productsc. the y-intercept The following are three data points. Assuming these data point have a linear pattern, use the method of least squares to answer Questions 2–4:X Y 1 3 2 2 3 1
The y-intercept is the value of Y when X equals ____. [Fill in the blank]a. 0b. 1.0c. ∞
The values of one factor increase as the values of a second factor decrease. This sentence describes a line with aa. positive slopeb. negative slope
Which of the following is the equation for a straight line?a. X = bY + ab. Y = bX + ac. Y = X + ba
Plotting the residuals can help to evaluatea. whether a straight line is the best way to describe the data.b. whether the data points are similarly scattered around the regression line as you move along the x-axis.c. Both a and b are correct.
If a data point falls exactly on the regression line, then what will be the value of the residual for that data point?a. 0b. 1.0c. It depends where on the regression line the data point falls.
The ____ is the best-fitting straight line to a set of data points. [Fill in the blank]a. correlationb. regression linec. straightest line
Which of the following questions is answered using an analysis of regression?a. Is a linear pattern evident in a set of data points?b. Which equation of a straight line can best describe this pattern?c. Are the predictions made from this equation significant?
What is the relationship between the predictor variable and the criterion variable using linear regression?a. The predictor variable is a known value that is used to predict the value of a criterion variable.b. The criterion variable is a known value that is used to predict the value of a predictor
The equation of the regression line can be used to ____ values of one factor, given known values of a second factor. [Fill in the blank]a. removeb. createc. predict
When is a correlation matrix used to summarize correlational data?a. When a single correlation is reported.b. When multiple correlations are reported.c. When the results of a correlation are complicated.
In addition to the value of r and the p value, which of the following should also be reported with a correlation?a. degrees of freedomb. critical valuesc. the original data
Which of the following is reported to summarize the results of a correlation using APA style?a. the strength of a correlationb. the direction of a correlationc. the significance of a correlationd. All of these are reported.
What is the decision for this phi correlation at a .05 level of significance?a. Fail to reject the null hypothesis; eco-consciousness and recycling behavior are not related.b. Reject the null hypothesis; being highly eco-conscious is associated with rarely recycling.c. Reject the null hypothesis;
What is the value of the phi correlation coefficient test statistic?Answer: ____[enter number exactly as shown in the table]
What is the decision for this phi correlation at a .05 level of signifi cance?a. Fail to reject the null hypothesis; education programs and recidivism are not related.b. Reject the null hypothesis; participation in education programs is associated with lower recidivism.c. Reject the null
What is the value of the phi correlation coeffi cient test statistic?Answer: ____[enter number to the hundredths place: .00]
Which of the following is an assumption for the phi correlation coeffi cient?a. independenceb. a minimum expected frequency of at least 5c. Both a and b are assumptions for the phi correlation coeffi cient.
Th e phi correlation coeffi cient is an appropriate test statistic for data on what scale of measurement?a. Both factors are interval or ratio data.b. Both factors are ranked or ordinal data.c. Both factors are dichotomous (nominal) data.d. One factor is dichotomous or nominal variable, and a
We convert r to a χ2 statistic to evaluate signifi cance for which of the following correlation tests?a. Pearsonb. Spearmanc. point-biseriald. phi
We convert r to a t statistic to evaluate signifi cance for which of the following correlation tests?a. Pearsonb. Spearmanc. point-biseriald. phi
What is the decision for this point-biserial correlation at a .05 level of signifi cance?a. Fail to reject the null hypothesis; being in lively compared to a dull waiting room is not related to perceived quality of care.b. Reject the null hypothesis; patients perceive a higher quality of care when
What is the value of the point-biserial correlation coeffi cient test statistic?Answer: ____[enter number exactly as shown in the table]
What is the decision for this point-biserial correlation at a .05 level of significance?a. Fail to reject the null hypothesis; being in an office or being a telecommuter is not related to productivity.b. Reject the null hypothesis; working in an office is associated with greater productivity
What is the value of the sum of squares for Y (SSY) in the calculation of point-biserial correlation coefficient?Answer: ____[enter number to the hundredths place: 00.00]
Which of the following is an assumption for the point-biserial correlation coeffi cient?a. Normality for the continuous factor.b. Equal variances across the levels of the dichotomous variable.c. Both a and b are assumptions for the point-biserial correlation coeffi cient.
Th e point-biserial correlation coeffi cient is an appropriate test statistic for data on what scale of measurement?a. Both factors are interval or ratio data.b. Both factors are ranked or ordinal data.c. Both factors are dichotomous or nominal data.d. One factor is a dichotomous or nominal
What is the decision for this Spearman correlation at a .05 level of signifi cance?a. Fail to reject the null hypothesis; employee satisfaction rankings and customer service satisfaction rankings are not related.b. Reject the null hypothesis; higher employee satisfaction rankings is associated with
What is the p value for this Spearman correlation?Answer: ____[enter number exactly as shown in the table]
What is the value of the Spearman correlation coeffi cient test statistic?Answer: ____[enter number exactly as shown in the table]
What is the value of the Spearman correlation coefficient test statistic?
What is the decision for this Spearman correlation at a .05 level of significance?a. Fail to reject the null hypothesis; the academic standing of freshman and the academic standing of those same students in their senior year are not related.b. Reject the null hypothesis; higher the academic
What is the decision for this Spearman correlation at a .05 level of significance?a. Fail to reject the null hypothesis; academic rankings and athletic rankings at these local colleges are not related.b. Reject the null hypothesis; higher academic rankings is associated with higher athletic
What is the value of the Spearman correlation coefficient test statistic?Answer: ____[enter number to the hundredths place: .00]
Which of the following is an assumption for the Spearman correlation coefficient?a. normalityb. homoscedasticityc. A monotonic relationship exists between the two variables.
The Spearman correlation coefficient is an appropriate test statistic for data on what scale of measurement?a. ordinalb. nominalc. interval or ratio
A researcher reports a significant positive correlation between an individual’s activity level in sports and their income level—and concludes that greater participation in sports causes greater financial rewards. What is the mistake that this researcher made with this conclusion?a. The
A researcher records the relationship between housing prices and square footage of the homes and reports a strong correlation but identifies outliers in the data. What impact can the outliers have on the data?a. The outliers can change the strength of the correlation.b. The outliers can change the
A researcher measures data ranging from 12 to 20 points and draws conclusions about the full range of data in the population from 0 to 50 points. Which limitation for appropriately interpreting a correlation coeffi cient did the researcher violate?a. Th e researcher did not account for reverse
What is the decision for this Pearson correlation at a .05 level of signifi cance?a. Fail to reject the null hypothesis; student engagement and FYE student satisfaction are not related.b. Reject the null hypothesis; greater student engagement is associated with lower FYE student satisfaction.c.
What is the p value for this Pearson correlation?Answer: ____[enter number exactly as shown in the table]
What is the value of the Pearson correlation coeffi cient test statistic?Answer: ____[enter number exactly as shown in the table]
Th e coeffi cient of determination is mathematically equivalent toa. ω2.b. η2.c. ω2 and η2
The coefficient of determination isa. a measure of effect size.b. mathematically equivalent to η2
A researcher reports the following Pearson correlation between consumer confidence and consumer spending: r = .60. What is the value of the coefficient of determination?Answer: ____[enter number to the hundredths place: .00]
What is the value of the coefficient of determination for this test?a. .548b. .628c. .741
What is the value of the numerator for the Pearson correlation coefficient test statistic?Answer: ____[enter number to the hundredths place: .00]
What is the value of the Pearson correlation coefficient test statistic?
What is the decision for this Pearson correlation at a .05 level of significance?a. Fail to reject the null hypothesis; credit card debt and marital stress are not related.b. Reject the null hypothesis; greater credit card debt is associated with lower marital stress.c. Reject the null hypothesis;
What is the decision for this Pearson correlation at a .05 level of significance?a. Fail to reject the null hypothesis; social media use and mood are not related.b. Reject the null hypothesis; greater social media use is associated with worse mood.c. Reject the null hypothesis; greater social media
What is the value of the Pearson correlation coefficient test statistic?Answer: _____[enter number to the hundredths place: .00]
Th e Pearson correlation coeffi cient is an appropriate test statistic for data on what scale of measurement?a. ordinalb. nominalc. interval or ratio
A researcher reports that low levels of stress are associated with poor health outcomes;moderate levels of stress are associated with positive health outcomes; and high levels of stress are again associated with poor health outcomes. Considering the shape of this distribution is low, then high, the
A researcher reports that at low levels of depression, there is very little variability between two factors, but at high levels of depression there is substantial variability between the factors. Considering the change in variability from low to high levels, which of the following assumptions for a
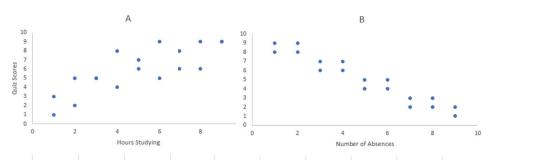
Which fi gure displays a stronger correlation? 4 6 2 Hours Studying B 4 Number of Absences 10
Which fi gure displays a positive correlation? 4 6 2 Hours Studying B 4 Number of Absences 10
Th e denominator of the Pearson correlation coeffi cient is a measure of the extent to which two variablesa. covaryb. are signifi cantc. vary independently
The numerator of the Pearson correlation coefficient is a measure of the extent to which two variablesa. covaryb. are significantc. vary independently
The correlation coefficient, r, is used to measure the ____ and ____ of the linear relationship between two factors. [Fill in the blanks]a. strength, directionb. mean, variancec. significance, effect size
Using a correlational design, we treat each factor like a dependent variable and identify the extent to which two variables area. causalb. relatedc. numeric
Select the description below that identifies the following correlation: r(50) = −.68, p < .001.a. The correlation is positive.b. The correlation is statistically significant.c. The coefficient of determination is .68.
Showing 3800 - 3900
of 8686
First
32
33
34
35
36
37
38
39
40
41
42
43
44
45
46
Last
Step by Step Answers