New Semester
Started
Get
50% OFF
Study Help!
--h --m --s
Claim Now
Question Answers
Textbooks
Find textbooks, questions and answers
Oops, something went wrong!
Change your search query and then try again
S
Books
FREE
Study Help
Expert Questions
Accounting
General Management
Mathematics
Finance
Organizational Behaviour
Law
Physics
Operating System
Management Leadership
Sociology
Programming
Marketing
Database
Computer Network
Economics
Textbooks Solutions
Accounting
Managerial Accounting
Management Leadership
Cost Accounting
Statistics
Business Law
Corporate Finance
Finance
Economics
Auditing
Tutors
Online Tutors
Find a Tutor
Hire a Tutor
Become a Tutor
AI Tutor
AI Study Planner
NEW
Sell Books
Search
Search
Sign In
Register
study help
business
statistics alive
Statistics The Art And Science Of Learning From Data 4th Global Edition Alan Agresti, Christine A. Franklin, Bernhard Klingenberg - Solutions
10.99 CI versus test Consider the results from the previous exercise.a. Construct a 95% confidence interval to compare the population means.b. Explain what you learn from the confidence interval that you do not learn from the significance test.
10.100 Breast augmentation and self-esteem A researcher in the College of Nursing, University of Florida, hypothesized that women who undergo breast augmentation surgery would gain an increase in self-esteem.The article about the study15 indicated that for the 84 subjects who volunteered for the
10.101 Internet use As part of her class project in a statistics course, a student decided to study ways in which her fellow students use the Internet. She randomly sampled 5 of the 165 students in her course and asked them, “In the past week, how many days did you use the Internet to (a) read
10.85 Sex roles A study of the effect of the gender of the tester on sex-role differentiation scores13 in Manhattan gave a random sample of preschool children the Occupational Preference Test. Children were asked to give three choices of what they wanted to be when they grew up. Each occupation was
10.84 Test—CI connection In the previous exercise, explain how the result of the 95% confidence interval in part b corresponds to the result of the decision using significance level 0.05 in part c.
10.83 Time spent on Internet In 2014, the General Social Survey asked about the number of hours a week spent on the World Wide Web (variable denoted WWWHR).Some results are as follows:a. Identify the response variable and explanatory variable.Indicate whether each variable is quantitative or
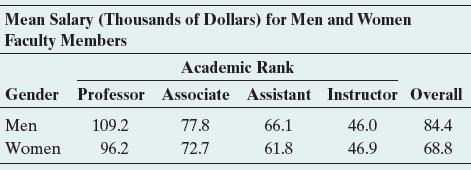
10.68 Teacher salary, gender, and academic rank The American Association of University Professors (AAUP)reports yearly on faculty salaries for all types of higher education institutions across the United States. The following table lists the mean salary, in thousands of dollars, of full-time
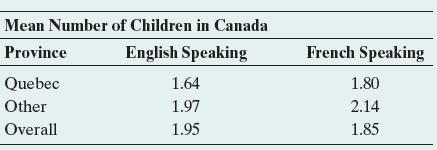
10.69 Family size in Canada The table shows the mean number of children in Canadian families, classified by whether the family was English speaking or French speaking and by whether the family lived in Quebec or in another province.a. Overall, compare the mean number of children for
10.70 Heart disease and age In the United States, the median age of residents is lowest in Utah. At each age level, the death rate from heart disease is higher in Utah than in Colorado. Overall, the death rate from heart disease is lower in Utah than Colorado. Are there any contradictions here, or
10.71 Breast cancer over time The percentage of women who get breast cancer sometime during their lifetime is higher now than in 1900. Suppose that breast cancer incidence tends to increase with age, and suppose that women tend to live longer now than in 1900. Explain why a comparison of breast
10.73 Public versus scientists’ opinions on fracking A Pew Research Center survey of 2002 U.S. adults in August 2014 and a survey of 3748 scientists connected to the American Association for the Advancement of Science(AAAS) in September 2014 both asked the following question: "Do you favor or
10.74 BMI then and now The Centers for Disease Control(www.cdc.gov) periodically administers large randomized surveys to track health of Americans. In a survey of 4431 adults in 2003/2004, 66% were overweight (body mass index BMI Ú 25). In the most recently available survey of 5181 adults in
10.75 Marijuana and gender In a survey conducted by Wright State University, senior high school students were asked if they had ever used marijuana. The table shows results of one analysis, where X is the count who said yes. Assuming these observations can be treated as a random sample from a
10.76 Gender and belief in afterlife The table shows results from the 2014 General Social Survey on gender and whether one believes in an afterlife.Belief in Afterlife Gender Yes No Total Female 1026 207 1233 Male 757 252 1009a. Denote the population proportion who believe in an afterlife by p1 for
10.77 Belief depend on gender? Refer to the previous exercise.a. Find the standard error of 1pn 1 - pn 22 for a test of H0: p1 = p2.b. For a two-sided test, find the test statistic and P-value and make a decision using significance level 0.05.Interpret.c. Suppose that actually p1 = 0.81 and p2 =
10.78 Females or males have more close friends? A recent GSS reported that the 486 surveyed females had a mean of 8.3 close friends 1s = 15.62 and the 354 surveyed males had a mean of 8.9 close friends 1s = 15.52.a. Estimate the difference between the population means for males and females.b. The
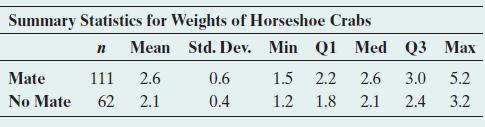
10.79 Heavier horseshoe crabs more likely to mate? A study of a sample of horseshoe crabs on a Florida island (J.Brockmann, Ethology, vol. 102, 1996, pp. 1–21) investigated the factors that were associated with whether female crabs had a male crab mate. Basic statistics, including the five-number
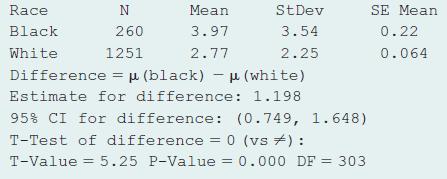
10.80 TV watching and race The 2014 GSS asked about the number of hours you watch TV per day. An analysis that evaluates this by race shows the results (note the codes:1 = Black and 2 = White):a. Do you believe that TV watching has a normal distribution for each race? Why or why not? What effect
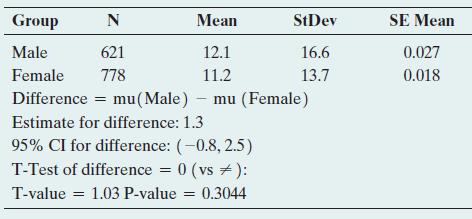
10.81 Test TV watching by race Refer to the previous exercise.a. Specify the hypotheses that are tested in the output shown.b. Report the value of the test statistic and the P-value.Interpret.c. Make a decision, using the 0.05 significance level.d. Explain the connection between the result of this
10.82 Ibuprofen and lifespan Geneticists hypothesized that one reason for a prolonged lifespan observed in yeast cells treated with the common drug ibuprofen stems from inhibiting the uptake of certain amino acids. In an experiment, they compared levels of amino acids in cells treated with
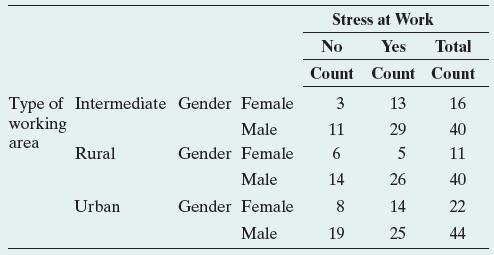
10.67 Stress at work A study performed in Austria in 2015 addressed the problem of workplace stress by the gender of the worker. Researchers also used the type of working area as a control variable to shed more light on the association between the variables. The data shown in the following table
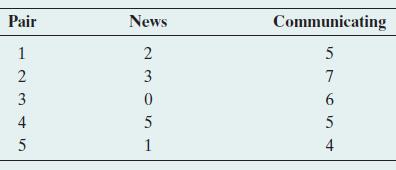
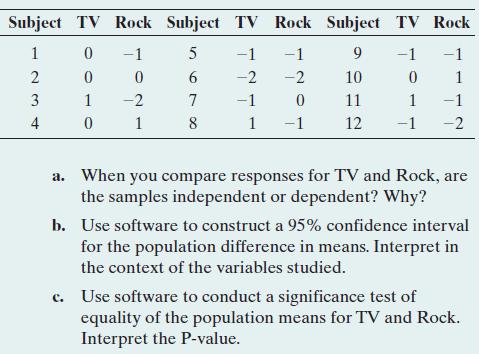
10.102 TV or rock music a worse influence? In a recent General Social Survey, subjects were asked to respond to the following: “Children are exposed to many influences in their daily lives. What kind of influence does each of the following have on children? 1. Programs on network television, 2.
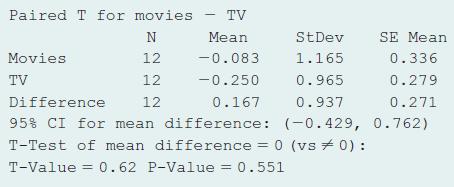
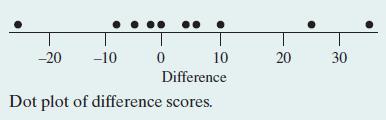
10.103 Influence of TV and movies Refer to the previous exercise. The GSS also asked about the influence of movies. The responses for these 12 subjects were-1, 1, 0, 2, 0,-2, -1, 0,-1, 1, 1, -1. The results of using MINITAB to compare the influence of movies and TV are shown below. Explain how to
10.122 Guessing on a test A test consists of 100 true-false questions.Joe did not study, and on each question he randomly guesses the correct response. Jane studied a little and has a 0.60 chance of a correct response for each question.a. Approximate the probability that Jane’s score is
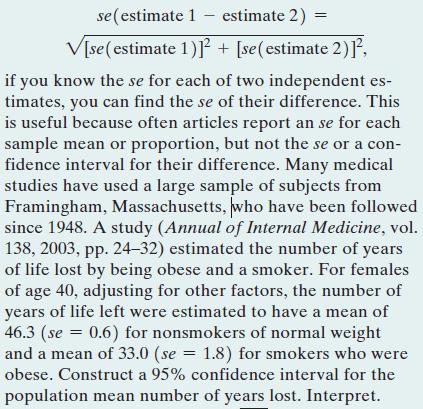
10.123 Standard error of difference From the box formula for the standard error at the end of Section 10.1, se (estimate 1 estimate 2) = V[se (estimate 1)] + [se (estimate 2)], if you know the se for each of two independent es- timates, you can find the se of their difference. This is useful
10.124 Gap between rich and poor: 32>n margina. For comparisons of groups in which n1 = n2, with common value denoted by n, use the fact that the largest possible value of pn 11 - pn 2 occurs at pn = 0.5 to show that the margin of error for a large-sample 95% confidence interval for 1p1 - p22 can
10.125 Small-sample CI The small-sample confidence interval for comparing two proportions is a simple adjustment of the large-sample one. Recall that for a small-sample confidence interval for a single proportion, we used the ordinary formula after adding four observations, two of each type (see
10.126 Symmetry of permutation distribution Refer to Example 12, which compared two groups of seven dogs each in terms of their time interacting with their owners.Figure 10.10 showed the sampling distribution by considering all possible permutations. When n1 = n2, as here, explain why the
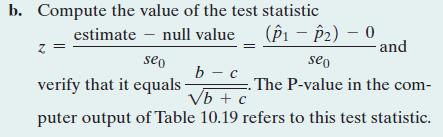
10.127 Null standard error for matched pairs Under the null hypothesis H0: p1 = p2 of equal population proportions, the standard error for the difference in the two sample proportions mentioned in the previous exercise reduces to se0: = 31b + c2 >n2, where b and c are the off-diagonal elements
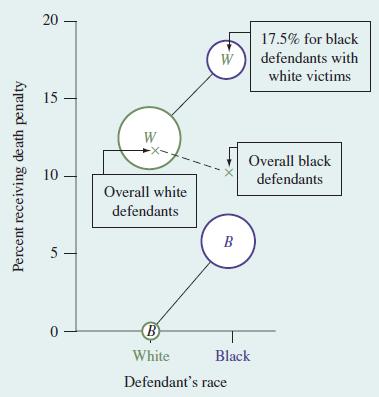
10.128 Graphing Simpson’s paradox The figure illustrates Simpson’s paradox for Example 18 on the death penalty.For each defendant’s race, the figure plots the percentage receiving the death penalty. Each percentage is labeled by a letter symbol giving the category of the victim’s race.
Reading the medical literature Refer to Activity 2,which follows, about reading an article in a medical journal. Your instructor will pick a recent article at the website for the British Medical Journal. Prepare a short report in which you summarize the main conclusions of the article and explain
What was the objective of the study?Medical research makes frequent use of statistical methods shown in this chapter. At British Medical Journal (BMJ) bmj.com on the Internet, pull up the April 19, 2003, issue. Browse through the article titled “Behavioural counseling to increase consumption of
Was the study experimental or observational? Summarize the design and the subjects used in the study.Medical research makes frequent use of statistical methods shown in this chapter. At British Medical Journal (BMJ) bmj.com on the Internet, pull up the April 19, 2003, issue. Browse through the
Identify response and explanatory variables.Medical research makes frequent use of statistical methods shown in this chapter. At British Medical Journal (BMJ) bmj.com on the Internet, pull up the April 19, 2003, issue. Browse through the article titled “Behavioural counseling to increase
According to Table 2 in the article, the 135 subjects in the nutrition counseling group had a baseline mean of 3.67 and standard deviation of 2.00 for the number of portions per day they ate of fruits and vegetables. Over the 12 months of the study, the mean increased by 0.99. Report the 95%
j Adjusted for confounding variables, the difference between the change in the mean for the behavioral counseling group and the nutrition counseling group was 0.62. Report and interpret the 95% confidence interval for the true difference and report the P-value for testing that the difference was
According to Table 2, at the baseline for the nutrition counseling group, the proportion of subjects who ate at least five portions a day of fruits and vegetables was 0.267, and this increased by 0.287 over the 12 months. Report and interpret the 95% confidence interval for the change in the true
What were the primary conclusions of the study?Medical research makes frequent use of statistical methods shown in this chapter. At British Medical Journal (BMJ) bmj.com on the Internet, pull up the April 19, 2003, issue. Browse through the article titled “Behavioural counseling to increase
10.121 True or false: Control for clinic Suppose there is a higher percentage of successes with Treatment A than with Treatment B at a clinic in Rochester, and there is a higher percentage of successes with Treatment A than with Treatment B at a clinic in Syracuse. For the overall sample (combining
10.120 True or false: Afford food? A 2013 survey by the Pew Research Center asked whether there have been times in the past year the respondent has been unable to afford food. Of advanced economies, the country with the second highest response was the United States, 24%.Worldwide, the highest
10.119 True or false: Positive values in CI If a 95% confidence interval for 1m1 - m22 contains only positive numbers, then we can conclude that both m1 and m2 are positive.
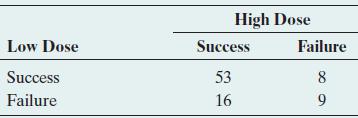
10.104 Crossover study The table summarizes results of a crossover study to compare results of low-dose and high-dose analgesics for relief of menstrual bleeding(B. Jones and M. Kenward, Statistics in Medicine, vol. 6, 1987, pp. 555–564).a. Find the sample proportion of successes for each dose of
10.105 Belief in ghosts and in astrology A poll by Louis Harris and Associates of 1249 Americans indicated that 36% believe in ghosts and 37% believe in astrology.a. Is it valid to compare the proportions using inferential methods for independent samples? Explain.b. Do you have enough information
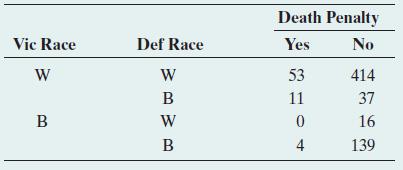
10.106 Death penalty paradox Exercise 3.58 showed results of another study about the death penalty and race. The data are repeated here.a. Treating victim’s race as the control variable, show that Simpson’s paradox occurs.b. Explain what causes the paradox to happen. Death Penalty Vic Race Def
10.107 Death rate paradoxes The crude death rate is the number of deaths in a year, per size of the population, multiplied by 1000.a. According to the U.S. Bureau of the Census, in 1995 Mexico had a crude death rate of 4.6 (i.e., 4.6 deaths per 1000 population) while the United States had a crude
10.108 Income and gender For a particular Big Ten university, the mean income for male faculty is $8000 higher than the mean income for female faculty. Explain how this difference could disappear:a. Controlling for number of years since received highest degree. (Hint: What if relatively few female
10.109 Student survey Refer to the FL Student Survey data file on the book’s website. Using software, prepare a short report summarizing the use of confidence intervals and significance tests (including checking assumptions)to compare males and females in terms of opinions about whether there is
10.110 Review the medical literature Your instructor will pick a medical topic of interest to the class. Find a recent article of a medical journal that reports results of a research study on that topic. Describe the statistical analyses that were used in that article. Did the article use (a)
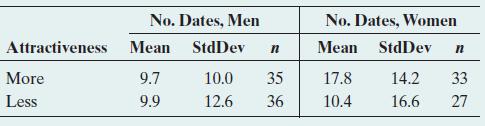
10.111 Attractiveness and getting dates The results in the table are from a study of physical attractiveness and subjective well-being (E. Diener et al., Journal of Personality and Social Psychology, vol. 69, 1995, pp. 120–129). As part of the study, college students in a sample were rated by a
10.112 Pay discrimination against women? A Time Magazine article titled “Wal-Mart’s Gender Gap” (July 5, 2004)stated that in 2001 women managers at Wal-Mart earned $14,500 less than their male counterparts.a. If these data are based on a random sample of managers at Wal-Mart, what more would
10.113 Mean of permutation distribution Refer to Example 11, which compared two doses of a medication in terms of the number of symptom-free days, using a permutation approach. Table 10.13 and Figure 10.9 showed the sampling distribution of the difference in sample means between the two doses. If
10.114 Treating math anxiety Two new programs were recently proposed at the University of Florida for treating students who suffer from math anxiety. Program A provides counseling sessions, one session a week for six weeks. Program B supplements the counseling sessions with short quizzes that are
10.115 Obesity and earnings An AP story (April 9, 2005) with headline Study: Attractive People Make More stated that “A study concerning weight showed that women who were obese earned 17 percent lower wages than women of average weight.”a. Identify the two variables stated to have an
10.116 Multiple choice: Alcoholism and gender Suppose that a 99% confidence interval for the difference p1 - p2 between the proportions of men and women in California who are alcoholics equals (0.02, 0.09). Choose the best correct choice.a. We are 99% confident that the proportion of alcoholics is
10.117 Multiple choice: Comparing mean incomes A study compares the population mean annual incomes for Hispanics 1m12 and for whites 1m22 having jobs in construction, using a 95% confidence interval for m1 - m2.Choose the best correct choice.a. If the confidence interval is 1 -6000, -30002, then at
10.118 Multiple choice: Sample size and significance If the sample proportions in Example 4 comparing cancer death rates for aspirin and placebo had sample sizes of only 1000 each, rather than about 11,000 each, then the 95% confidence interval for 1p1 - p22 would be 1 -0.007, 0.0212 rather than
10.129 Describe two limitations of the study, as explained in the sections titled “Representativeness of the sample” and“Limitations of the study.”Medical research makes frequent use of statistical methods shown in this chapter. At British Medical Journal (BMJ) bmj.com on the Internet, pull
10.1 Categorical Response:Comparing Two Proportions
10.15 Address global warming You would like to determine what students at your school would be willing to do to help address global warming and the development of alternatively fueled vehicles. To do this, you take a random sample of 100 students. One question you ask them is, “How high of a tax
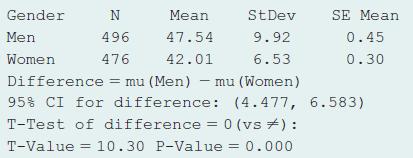
10.16 Housework for women and men Do women tend to spend more time on housework than men? If so, how much more? Based on data from the National Survey of Families and Households, one study reported the results in the table for the number of hours spent in housework per week. (Source: Data from A.
10.17 More confident about housework Refer to part c in the previous exercise.a. Show that a 99% confidence interval is (10.0, 16.2).b. Explain why this interval is wider than the 95% confidence interval.
10.18 Employment by gender The study described in Exercise 10.16 also evaluated the weekly time spent in employment.This sample comprises men and women with a high level of labor force attachment. Software shows the results.a. Does it seem plausible that employment has a normal distribution for
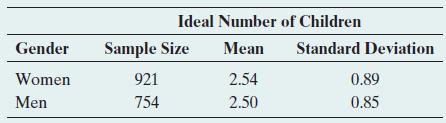
10.19 Ideal number of children In 2014, the GSS asked, “What is the ideal number of children for a family to have?” For those giving a numerical response (and treating the response“7 or more” as 7), the following table shows summary statistics. (You can reproduce these data by typing
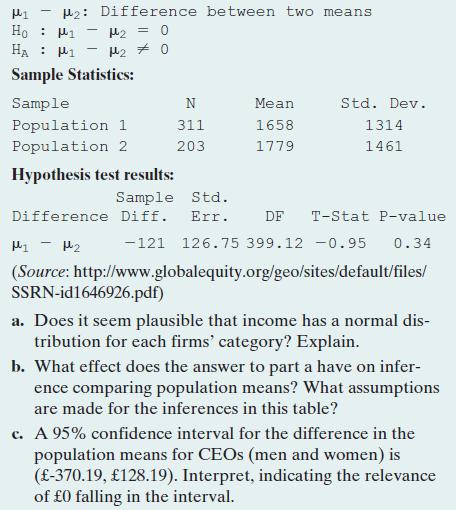
10.20 Annual income of CEOs A study analyzes the total annual pay of CEOs (in pounds) for a sample of UK companies over the period 2003–2006 categorized according to the number of compensation consultants employed. The sample included 311 firms having one consultant and 203 firms having two
10.21 Bulimia CI A study of bulimia among college women(J. Kern and T. Hastings, Journal of Clinical Psychology, vol. 51, 1995, p. 499) studied the connection between childhood sexual abuse and a measure of family cohesion(the higher the score, the greater the cohesion). The sample mean on the
10.22 Empagliflozin and renal function over time A study published in June 2016 in New England Journal of Medicine wanted to determine the long-term renal effects (measured by eGFR: estimated glomerular filtration rate)of empagliflozin in patients with type 2 Diabetes. 7020 patients with type 2
10.23 Nicotine dependence A study on nicotine dependence for teenage smokers obtained a random sample of seventh graders. The response variable was constructed from a questionnaire called the Hooked on Nicotine Checklist(HONC). This is a list of ten questions such as, “Have you ever tried to quit
10.24 Inhaling affect HONC? Refer to the previous exercise.a. Show that the test statistic for H0: m1 = m2 equals t = 11.7. If the population means were equal, explain why it would be nearly impossible by random variation to observe this large a test statistic.b. What decision would you make about
10.25 Females or males more nicotine dependent? Refer to Exercise 10.23 about studying nicotine dependence using a random sample of teenagers. Of those seventh graders in the study who had tried tobacco, the mean HONC score was 2.8 1s = 3.62 for the 150 females and 1.6 1s = 2.92 for the 182
10.26 Female and male monthly smokers Refer to the previous exercise. A subject was called a monthly smoker if he or she had smoked cigarettes over an extended period of time.The 74 female monthly smokers had a mean HONC score of 5.4 1s = 3.52, and the 71 male monthly smokers had a mean HONC score
10.27 Kuwaiti men versus Swedish men The following descriptive statistics were obtained from a study (Saud al-Obaidi et al., Journal of Rehabilitation Research and Development, vol. 40, 2003) that aimed to compare the weight of Kuwaiti men with Swedish men between the ages of 20 to 29 years.Group
10.28 Kidnapping in southern and eastern European countries The following data on kidnapping offences in countries of east and south Europe in 2014 were obtained from https://data.unodc.org.(Crime and Criminal Justice –> Crime –> Kidnapping –>Filter by Region and Sub Region as
10.29 Study time A graduate teaching assistant for Introduction to Statistics (STA 2023) at the University of Florida collected data from students in one of her classes in spring 2007 to investigate whether study time per week(average number of hours) differed between students in the class who
10.14 Energy drinks: health risks and toxicity A study was carried out in Saudi Arabia in which 31 male university students (18 overweight/obese and 13 having normal weight) were enrolled from December 2013 to December 2014 (www.annsaudimed.net). The heart rate variability was significantly less in
10.13 Prevalence of allergen-specific IgE antibodies in school children A study was conducted in Japan to estimate the prevalence of allergen-specific IgE antibodies in children. A group of school children between the ages of 9 and 15 years were surveyed in 2001 and in 1996 (retrospectively).The
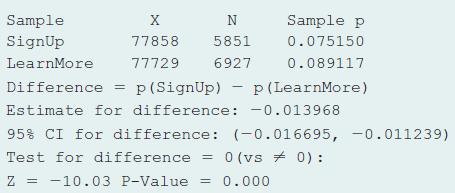
10.12 Obama A/B testing To increase Barack Obama’s visibility and to raise money for the campaign leading up to the 2008 presidential election, Obama’s analytics team conducted an A/B test with his website. In the original version, the button to join the campaign read “Sign Up”.In an
10.2 Quantitative Response:Comparing Two Means
10.3 Other Ways of Comparing Means, Including a Permutation Test
10.4 Analyzing Dependent Samples
10.5 Adjusting for the Effects of Other Variables
10.1 Unemployment rate According to the Bureau of Labor Statistics, the official unemployment rate was 10.4%among blacks and 4.7% among whites as of February 2015. (www.bls.gov/).a. Identify the response variable and the explanatory variable.b. Identify the two groups that are the categories of the
10.2 Sampling sleep The 2011 Bedroom Sleep poll of a random sample of 1500 adults reported that respondents slept an average of 6.5 hours on weekdays and 7.2 hours on weekends, and that 21% of respondents got eight or more hours of sleep on weekdays, whereas 44% got eight or more hours of sleep on
10.3 Basic life support knowledge In 2015, a survey of firstyear university students in Brazil was conducted to determine if they knew how to activate the Mobile Emergency Attendance Service (MEAS). Of the 1038 respondents(59.5% studying biological sciences, 11.6% physical sciences, and 28.6%
10.4 Smoking and lung obstruction A National Center for Health Statistics data brief published in 2015 (Nr. 181)looked at the association between lung obstruction and smoking status in adults 40 to 79 years old. In a random sample of 6927 adults without any lung obstruction, 54.1% never smoked. In
10.5 Risky behaviors among HIV positive female sex workers In 2014, questionnaire surveys were administrated among 181 female sex workers in the Yunnan province of China who confirmed themselves to be HIV positive (www.ncbi.nlm.gov/pubmed/26833008). The participants were divided into two age
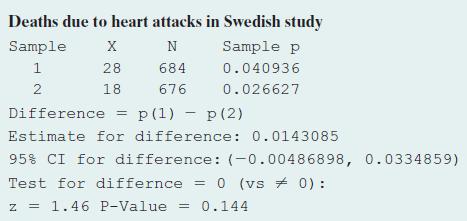
10.6 Aspirin and heart attacks in Sweden A Swedish study used 1360 patients who had suffered a stroke. The study randomly assigned each subject to an aspirin treatment or a placebo treatment.3 The table shows MINITAB output, where X is the number of deaths due to heart attack during a follow-up
10.7 Swedish study test Refer to the previous exercise.a. State the hypotheses that were tested.b. Explain how to interpret the P-value for the test.c. Even though the difference between the sample proportions was larger than in the Physicians Health Study(Examples 2–4), the P-value is larger
10.8 Significance test for aspirin and cancer deaths study In the study for cancer death rates, consider the null hypothesis that the population proportion of cancer deaths p1 for placebo is the same as the population proportion p2 for aspirin. The sample proportions were pn 1 = 347>11535 = 0.0301
10.9 Basic life support knowledge and willingness to enroll in a first-aid course. In the study of basic life support knowledge mentioned in Exercise 10.3, 51.1% students from nonbiological subjects said they would enroll in a first-aid course versus 74.7% of students from biological subjects. Is
10.10 Comparing marketing commercials Two TV commercials are developed for marketing a new product. A volunteer test sample of 200 people is randomly split into two groups of 100 each. In a controlled setting, Group A watches commercial A and Group B watches commercial B. In Group A, 25 say they
10.11 Hormone therapy for menopause The Women’s Health Initiative conducted a randomized experiment to see whether hormone therapy was helpful for postmenopausal women. The women were randomly assigned to receive the estrogen plus progestin hormone therapy or a placebo.After five years, 107 of
10.30 Gum flavor longevity In a test to determine the flavor longevity of a chewing gum, clients entering a store were asked to participate in an activity. The activity consisted of chewing a certain brand of gum and recording how long the gum flavor lasted in minutes. Records from groups of males
10.31 Time spent on social networks As part of a class exercise, an instructor at a major university asks her students how many hours per week they spend on social networks. She wants to investigate whether time spent on social networks differs for male and female students at this university. The
10.32 More time on social networks In the previous exercise, plot the data. Do you see any outliers that could influence the results? Remove the most extreme observation from each group and redo the analyses. Compare results and summarize the influence of the extreme observations.
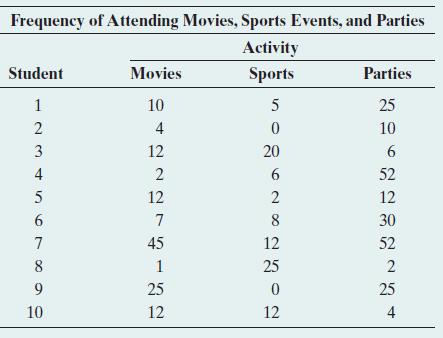
10.51 Social activities for students As part of her class project, a student at the University of Florida randomly sampled 10 fellow students to investigate their most common social activities.As part of the study, she asked the students to state how many times they had done each of the following
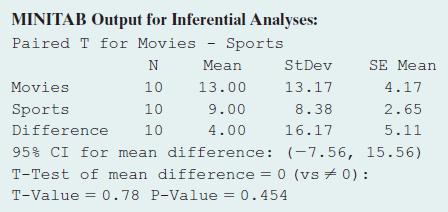
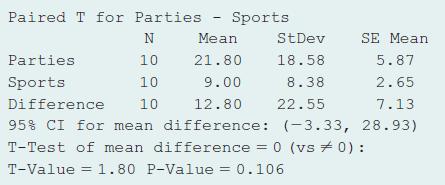
10.52 More social activities Refer to the previous exercise.The output shows the result of comparing the mean responses on parties and sports.a. Explain how to interpret the reported 95% confidence interval.b. State the hypotheses to which the P-value refers and interpret its value.c. Explain the
10.53 Movies versus parties Refer to the previous two exercises.Using software, compare the responses on movies and parties using (a) all steps of a significance test and (b) a 95%confidence interval. Interpret results in context.
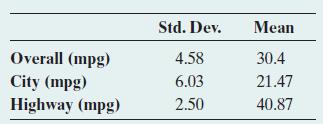
10.54 Mileage of midsized cars The following table lists the fuel economy of 15 midsized cars when driven in the city and when driven on the highway, along with their overall mileage. Their performance in miles per gallon (mpg) in each test was recorded and the means and standard deviations of
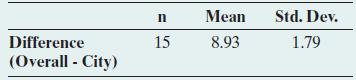
10.55 Midsized cars’ gas mileage change Refer to the previous exercise. Statistics of the change in the overall performance and the city performance are summarized in the following table:a. Explain how this standard deviation could be so much less than the standard deviations for the miles per
10.56 Internet book prices Anna’s project for her introductory statistics course was to compare the selling prices of textbooks at two Internet bookstores. She first took a random sample of 10 textbooks used that term in courses at her college, based on the list of texts compiled by the college
Showing 1300 - 1400
of 6613
First
7
8
9
10
11
12
13
14
15
16
17
18
19
20
21
Last
Step by Step Answers