New Semester
Started
Get
50% OFF
Study Help!
--h --m --s
Claim Now
Question Answers
Textbooks
Find textbooks, questions and answers
Oops, something went wrong!
Change your search query and then try again
S
Books
FREE
Study Help
Expert Questions
Accounting
General Management
Mathematics
Finance
Organizational Behaviour
Law
Physics
Operating System
Management Leadership
Sociology
Programming
Marketing
Database
Computer Network
Economics
Textbooks Solutions
Accounting
Managerial Accounting
Management Leadership
Cost Accounting
Statistics
Business Law
Corporate Finance
Finance
Economics
Auditing
Tutors
Online Tutors
Find a Tutor
Hire a Tutor
Become a Tutor
AI Tutor
AI Study Planner
NEW
Sell Books
Search
Search
Sign In
Register
study help
business
statistics alive
Introduction To Probability And Statistics 15th Edition William Mendenhall Iii , Robert Beaver , Barbara Beaver - Solutions
2. Select n520 people from a population of size N 52000 for a political opinion poll. use the random number table to identify the experimental units to be included in a simple random sample
1. Select n520 experimental units from a population of size N 5500. (hint: Since you need to use threedigit numbers, you can assign 2 three-digit numbers to each of the experimental units. For example, unit 1 would correspond to random numbers 001 and 501, unit 2 would correspond to 002 and 502,
A research chemist is testing a new method for measuring the amount of titanium (Ti) in ore samples. She chooses 10 ore samples of the same weight for her experiment. Five of the samples will be measured using a standard method, and the other five using the new method.Use random numbers to assign
A computer database at a downtown law firm contains files for N 51000 clients. The firm wants to select n55 files for review. Select a simple random sample of five files from this database.
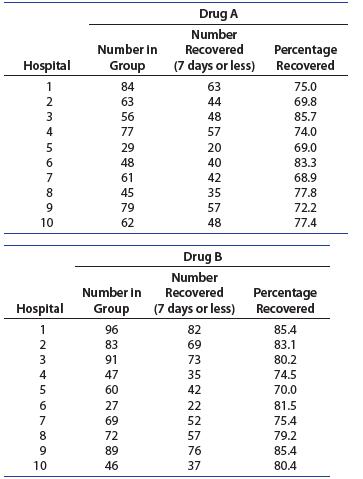
13. Recovery Rates Clinical data concerning the effectiveness of two drugs in treating a particular condition (as measured by recovery in 7 days or less) were collected from 10 hospitals. You want to know whether the data present sufficient evidence to indicate a higher recovery rate for one of the
The data given result from experiments run in completely randomized designs. Use the Kruskal–Wallis H statistic to determine whether there are significant differences between at least two of the treatment groups at the 5%level of significance. You can use a computer program if one is available.
6. Legos® The time required for kindergarten children to assemble a specific Lego creation was measured for children who had been instructed for four different lengths of time. Five children were randomly assigned to each instructional group. The length of time (in minutes) to assemble the Lego
7. Swampy Sites II In Exercise 11 (Section 11.2), we presented a study of the rates of growth of vegetation at four swampy sites. Six plants were randomly selected at each of the four sites and the mean leaf length per plant (in centimeters) for a random sample of 10 leaves per plant was
8. Heart Rate and Exercise In Exercise 18 (Section 11.3), we presented data on the heart rates for samples of 10 men randomly selected from each of four age groups. Each man walked a treadmill at a fixed grade for a period of 12 minutes, and the increase in heart rate (the difference before and
9. pH Levels in Water A sampling of the acidity of rain for 10 randomly selected rainfalls was recorded at three different locations in the United States, with the pH readings shown in the table.(note: pH readings range from 0 to 14; 0 is acid, 14 is alkaline. Pure water falling through clean air
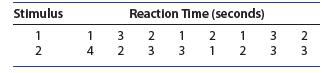
Suppose you wish to compare the reaction times of people exposed to six different stimuli.To eliminate the person-to-person variation in reaction time, four persons participated in the experiment and each person’s reaction time (in seconds) was measured for each of the six stimuli. The data are
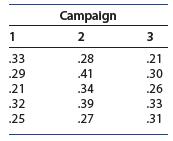
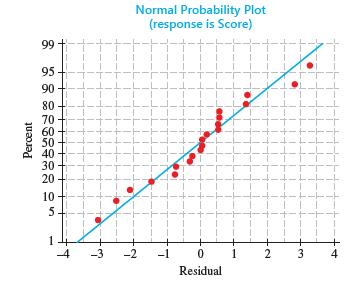
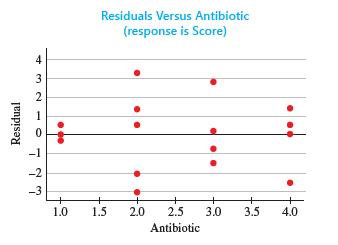
10. Advertising Campaigns The results of an investigation of product recognition following three advertising campaigns were reported in Example 11.15. The responses were the percentage adults in 15 different groups who were familiar with the newly advertised product. The normal probability plot
Calculate the Kruskal–Wallis H statistic using the information given Give the null and alternative hypotheses, determine the degrees of freedom, find the appropriate rejection region with a 5.05 and draw the appropriate conclusions 3. T, 21, T, 60, T, = 72, n, = 6, n = 5, n = 6.
13. Traffic Control Two methods for controlling traffic, A and B, were used at each of n512 intersections for a period of 1 week, and the numbers of accidents that occurred during this time period were recorded. The order of use (which method would be employed for the first week) was randomly
14. Jigsaw Puzzles Eight people were asked to perform a simple puzzle-assembly task under normal and stressful conditions. The stressful time consisted of a stimulus delivered to subjects every 30 seconds until the task was completed. Blood pressure readings taken under both conditions are given in
15. Images and Word Recall A psychology class performed an experiment to determine whether a recall score in which instructions to form images of 25 words were given differs from an initial recall score for which no imagery instructions were given.Twenty students participated in the experiment with
16. Meat Tenderizers An experiment was conducted to compare the tenderness of meat cuts treated with two different meat tenderizers. Prior to applying the tenderizers, the data were paired by the specific meat cut from the same steer and by cooking paired cuts together. After cooking, each cut was
The achievement test scores for four different groups of students, each group taught under different conditions, are shown in Table 15.9. The experimenter wants to test the hypothesis of no difference in the population distributions of achievement test scores versus the alternative that they differ
Calculate the Kruskal–Wallis H statistic using the information given Give the null and alternative hypotheses, determine the degrees of freedom, find the appropriate rejection region with a 5.05 and draw the appropriate conclusions 1. T, 35, T, 63, T, =22, n, n = n = 5.
Calculate the Kruskal–Wallis H statistic using the information given Give the null and alternative hypotheses, determine the degrees of freedom, find the appropriate rejection region with a 5.05 and draw the appropriate conclusions 2. T, 15, T=55.5, T, = 100.5, T, = 105, n = 5, n=6,n,= 7, n = 5.
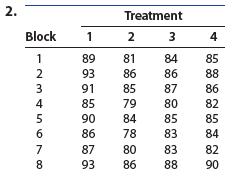
The data were collected using a randomized block design. For each data set, use the Friedman Fr-test to test for differences in location among the treatment distributions using a 5.05. Bound the p-value for the test using Table 5 of Appendix I and state your conclusions. 1. Treatment Block 1 2 3 1
The data given result from experiments run in completely randomized designs. Use the Kruskal–Wallis H statistic to determine whether there are significant differences between at least two of the treatment groups at the 5%level of significance. You can use a computer program if one is available.
Use the information given to calculate Spearman’s rank correlation coefficient, where xi and yi are the ranks of the ith pair of observations and d x y i i i 5 2 . Assume that there are no ties in the ranks 4. SS10; S = 6; n=5 xy
Use the information given to calculate Spearman’s rank correlation coefficient, where xi and yi are the ranks of the ith pair of observations and d x y i i i 5 2 . Assume that there are no ties in the ranks 5. d, -6, -3, -3, -4, 2, 5, 5, 4}
Use the information given to calculate Spearman’s rank correlation coefficient, where xi and yi are the ranks of the ith pair of observations and d x y i i i 5 2 . Assume that there are no ties in the ranks 6. d = 16; n=10
Use the information given to calculate Spearman’s rank correlation coefficient, where xi and yi are the ranks of the ith pair of observations and d x y i i i 5 2 . Assume that there are no ties in the ranks 7. SS, -82.5; S, = 74.5; n=10 Sy
Use the information given to calculate Spearman’s rank correlation coefficient rs. Do the data present sufficient evidence to indicate an association between variables A and B? Use a 5.05. 8. A 1.2 .8 2.1 3.5 2.7 2.7 1.5 B 1.0 1.3 .1 -8 -.2 .6
Use the information given to calculate Spearman’s rank correlation coefficient rs. Do the data present sufficient evidence to indicate an association between variables A and B? Use a 5.05. 9. A 2.6 .8 2.1 3.5 2.6 1.5 B 1.0 1.3 1.0 -.8 1.2 -.6
17. Social Skills Training A social skills training program was implemented with seven special needs students in a study to determine whether the program caused improvements in pre/post measures and behavior ratings. For one such test, the pre- and posttest scores for the seven students are given
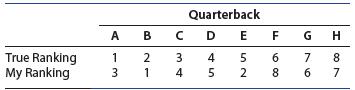
10. Ranking Quarterbacks A ranking of the quarterbacks in the top eight teams of the National Football League was made by polling a number of professional football coaches and sportswriters. This “true ranking”is shown below, together with “my ranking.”a. Calculate rs.b. Do the data
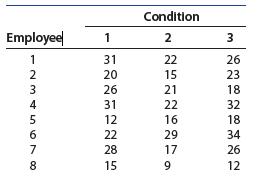
7. Worker Fatigue To study ways to reduce fatigue among employees whose jobs involve a monotonous assembly procedure, 12 randomly selected employees were asked to perform their usual job under each of three trial conditions. As a measure of fatigue, the experimenter used the number of assembly line
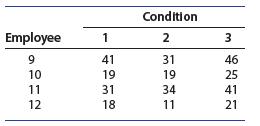
8. Supermarket Prices In Exercise 24 (Section 11.4), we compared the regular prices at four different grocery stores for eight items purchased on the same day. The prices are listed in the table.a. Does the distribution of the prices differ from one supermarket to another? Test using the Friedman F
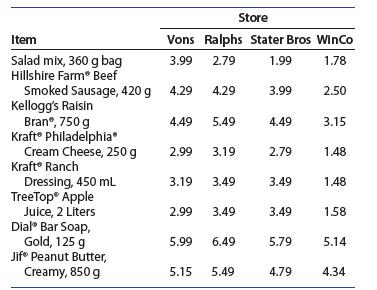
9. Toxic Chemicals To compare the effects of three toxic chemicals, A, B, and C, on the skin of rats, 2-centimeter-side squares of skin were treated with the chemicals and then scored from 0 to 10 depending on the degree of irritation. Three adjacent 2-centimeter-side squares were marked on the
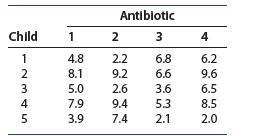
10. Good Tasting Medicine A voluntary sample of healthy children was used in a study to assess their reactions to the taste of four antibiotics.7 The children’s response was measured on a visual scale using faces, from sad (low score) to happy (high score).The minimum score was 0 and the maximum
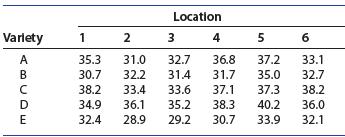
11. Yield of Wheat Exercise 9 (Chapter 11 Review) presented an analysis of variance of the yields of five different varieties of wheat, observed on one plot each at each of six different locations.The data from this randomized block design are listed here:a. Use the Friedman F -test r to determine
Prior to choosing a location for their second headquarters, Amazon provided a list of 20 cities that were in the running. Some of the criteria used to make the decision were hard to quantify, like quality of life or culture fit, but others could be translated into hard data. To evaluate each of the
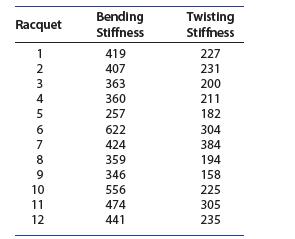
13. Tennis Racquets The data shown in the accompanying table give measures of bending stiffness and twisting stiffness as determined by engineering tests on 12 tennis racquetsa. Calculate the rank correlation coefficient rs between bending stiffness and twisting stiffness.b. If a racquet has
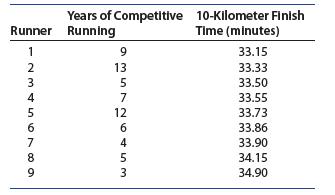
12. Competitive Running Is the number of years of competitive running experience related to a runner’s distance running performance? The data on nine runners, obtained from a study by Scott Powers and colleagues, are shown in the tablea. Calculate the rank correlation coefficient between years of
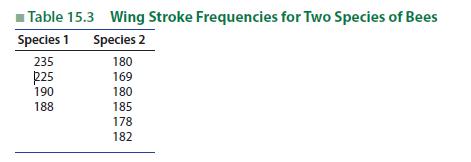
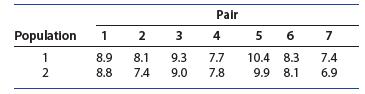
The wing stroke frequencies of two species of bees were recorded for a sample of n 54 1 species 1 bees and n 56 2 species 2 bees.1 The frequencies are listed in Table 15.3. Can you conclude that the distributions of wing strokes differ for these two species? Test using a =.05. Table 15.3 Wing
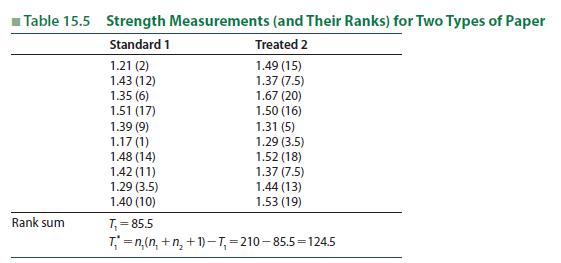
An experiment was conducted to compare the strengths of two types of papers: one a standard paper of a specified weight and the other the same standard paper treated with a chemical substance. Ten pieces of each type of paper, randomly selected from production, produced the strength measurements
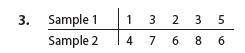
The data represent two random and independent samples drawn from populations 1 and 2. Use the Wilcoxon rank sum test to determine whether population 1 lies to the left of population 2 by (1) stating the null and alternative hypotheses to be tested, (2) calculating the values of T1 and T1*,
The data represent two random and independent samples drawn from populations 1 and 2. Use the Wilcoxon rank sum test to determine whether population 1 lies to the left of population 2 by (1) stating the null and alternative hypotheses to be tested, (2) calculating the values of T1 and T1*,
7. Word-Association Experiments A comparison of reaction times for two different stimuli in a word-association experiment produced the accompanying results when applied to a random sample of 16 peopleDo the data present sufficient evidence to indicate a difference in mean reaction times for the two
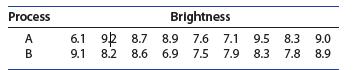
8. Paper Brightness The coded values for a measure of brightness in paper (light reflectivity), prepared by two different processes, are given in the table for samples of nine observations drawn randomly from each of the two processes. Do the data present sufficient evidence to indicate a
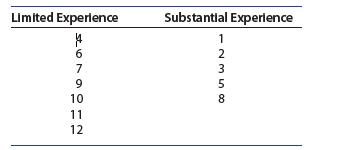
9. Rating Teaching Applicants A high school principal formed a review board consisting of five teachers who were asked to interview 12 applicants for a vacant teaching position and rank them in order of merit. Seven of the applicants held college degrees but had limited teaching experience. Of the
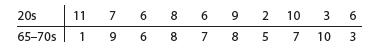
10. Alzheimer’s Disease A drug called ampakine CX-516 that accelerates signals between brain cells and appears to significantly sharpen memory was expected to provide relief for patients with Alzheimer’s disease.2 In a preliminary study involving no medication, 10 students in their early 20s
14. Student Ratings A school principal suspected that a teacher’s attitude toward a student was based on the student’s IQ score, which was usually known to the teacher. After three weeks of teaching, a teacher was asked to rank the nine children in his class from 1 (highest) to 9 (lowest) as to
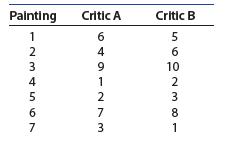
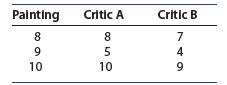
15. Art Critics Two art critics each ranked 10 paintings by contemporary (but anonymous) artists according to their appeal to the respective critics. The ratings are shown in the table. Do the critics seem to agree on their ratings of contemporary art? That is, do the data provide sufficient
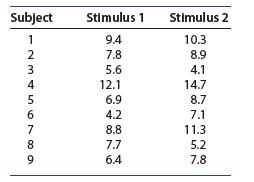
1. Response Times An experiment was conducted to compare the response times for two different stimuli, both presented to each of nine subjects, thus permitting an analysis of the differences between stimuli within each person. The table lists the response times (in seconds).a. Use the sign test to
14. Store Brands Save You $ Ron Marks10 visited five supermarket chains in New York and New Jersey and compared store- and name-brand prices for 30 items listed belowa. Use the sign test to determine whether or not storebrand items cost less than their name-brand counterparts using a 5.01.b. Use
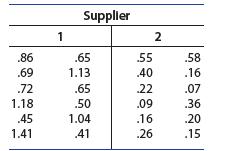
13. Contaminants in Chemicals A manufacturer uses two suppliers of a certain chemical and wants to test whether the percentage of contaminants is the same for the two sources.Data from independent random samples are shown below:a. Use the Wilcoxon rank sum test to determine whether there is a
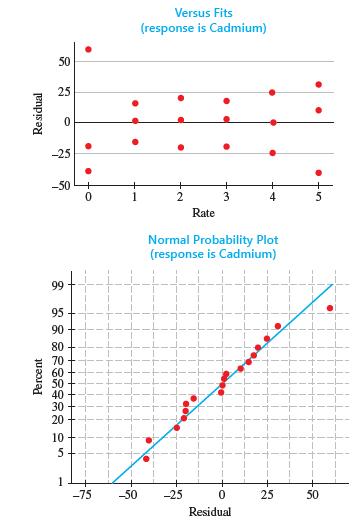
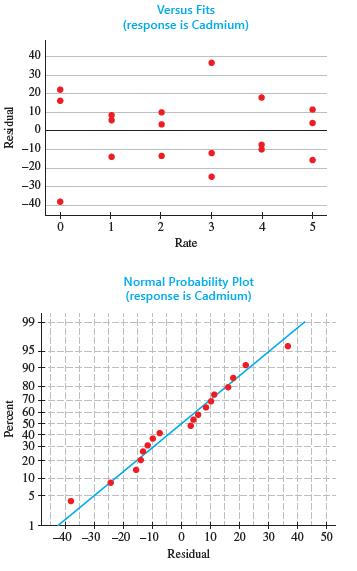
12. Refer to Exercise 11. The data in this table are the cadmium concentrations found in aphids that fed on the plants grown in soil amended with sludgea. Use the diagnostic plots to assess whether the assumptions of normality and constant variance are reasonable in this caseb. Based on your
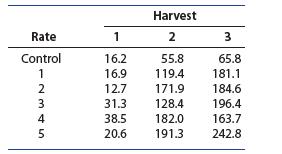
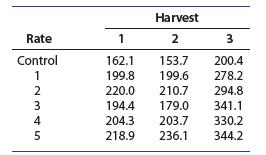
11. Heavy Metal An experiment was performed to determine whether there is an accumulation of heavy metals in plants that were grown in soils amended with sludge and whether there is an accumulation of heavy metals in insects feeding on those plants.9 The data in the table are cadmium
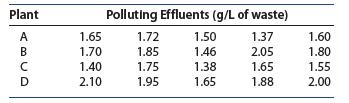
10. Pollution from Chemical Plants In Exercise 7 (Chapter 11 Review), you performed an analysis of variance to compare the mean levels of effluents in water at four different industrial plants. Five samples of liquid waste were taken at the output of each of four industrial plants. The data are
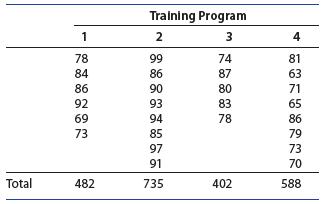
9. Learning to Sell In Exercise 5 (Chapter 11 Review) you compared the numbers of sales per trainee after completion of one of four different sales training programs. Six trainees completed training program 1, eight completed program 2, and so on. The numbers of sales per trainee are shown in the
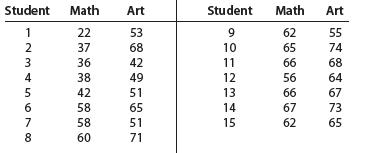
7. Math and Art The table gives the scores of a group of 15 students in mathematics and art. Use Wilcoxon’s signed-rank test to determine whether the median scores for these students differ significantly for the two subjects Student Math Art Student Math Art 1234567 22 53 9 62 55 37 68 10 65 74 3
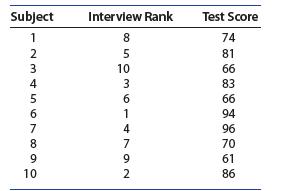
6. Interviewing Job Prospects A large corporation selects college graduates for employment using both interviews and a written test. Interviews conducted at the company site are far more expensive than the written test conducted on campus. Consequently, the personnel office was interested in
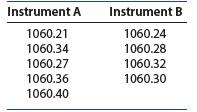
5. Precision Instruments Assume (as in the case of measurements produced by two well-calibrated measuring instruments) the means of two populations are equal.Use the Wilcoxon rank sum statistic for testing hypotheses concerning the population variances as follows:a. Rank the combined sample.b.
3. Identical Twins To compare the academic effectiveness of two junior high schools, 10 sets of identical twins were selected at the end of the sixth grade. In each case, the twins in the same set had obtained their schooling in the same classrooms at each grade level. One child was selected at
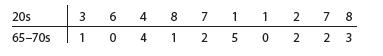
11. Alzheimer’s, continued Refer to Exercise 10.Suppose that two more groups of 10 men each are tested on the number of nonsense syllables they can remember after 5 minutes. However, this time the 65–70-year-olds are given a mild dose of ampakine CX-516. Do the data provide sufficient evidence
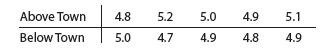
12. Dissolved Oxygen Content Dissolved oxygen content is a measure of the ability of a river, lake, or stream to support aquatic life, with high levels being better. A pollution-control inspector who suspected that a river community was releasing semitreated sewage into a river, randomly selected
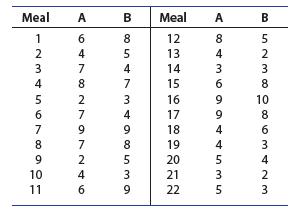
11. Gourmet Cooking Two chefs, A and B, rated 22 meals on a scale of 1−10. The data are shown in the table. Do the data provide sufficient evidence to indicate that one of the chefs tends to give higher ratings than the other? Test by using the sign test with a value of a near .05a. Use the
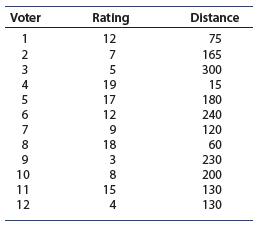
11. Rating Political Candidates A political scientist is studying the relationship between the voter image of a conservative political candidate and the distance (in kilometers) between the residences of the voter and the candidate. Each of 12 voters rated the candidate on a scale of 1–20.a.
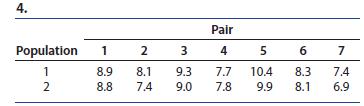
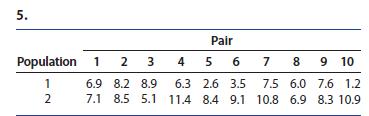
The information refers to a paired-difference experiment.Analyze the data using the Wilcoxon signed-rank test. State the null and alternative hypotheses to be tested and calculate the test statistic. Find the rejection region for a 5.05 and state your conclusions. [NOTE: T++T=n(n+1)/2.]
The information refers to a paired-difference experiment.Analyze the data using the Wilcoxon signed-rank test. State the null and alternative hypotheses to be tested and calculate the test statistic. Find the rejection region for a 5.05 and state your conclusions. [NOTE: T++T=n(n+1)/2.]
Use the large-sample approximation to the Wilcoxon signed-rank test with the information from Exercises 5, reproduced below.Calculate the p-value for the test and draw conclusions with a 5.05. Compare your results with the results in Exercises 5. 7. Test for a difference in the two distributions
Use the large-sample approximation to the Wilcoxon signed-rank test with the information from Exercises 6, reproduced below.Calculate the p-value for the test and draw conclusions with a 5.05. Compare your results with the results in Exercises 6. 8. Test whether distribution 1 lies to the right
9. Refer to Exercise 4 (Section 15.2). The data in this table are from a paired-difference experiment with n57 pairs of observationsa. Use Wilcoxon’s signed-rank test to determine whether there is a significant difference between the two populations.b. Compare the results of part a with the
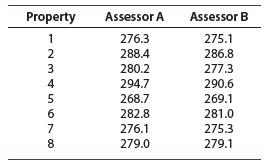
10. Property Values II In Exercise 10(Section 15.2), you used the sign test to determine whether the data provided sufficient evidence to indicate that assessor A tends to give higher assessments than assessor B, using the data shown in the tablea. Use the Wilcoxon signed-rank test for a paired
10. Property Values In Chapter 10, you compared the property evaluations of two tax assessors, A and B, as shown in the table below.a. Use the sign test to determine whether the data present sufficient evidence to indicate that assessor A tends to give higher assessments than assessor B;that is,
13. Eye Movement In an investigation of the visual scanning behavior of deaf children, measurements of eye movement were taken on nine deaf and nine hearing children. The table gives the eyemovement rates and their ranks (in parentheses). Does it appear that the distributions of eye-movement rates
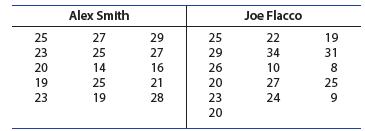
14. Comparing NFL Quarterbacks How does Alex Smith, quarterback for the Kansas City Chiefs, compare to Joe Flacco, quarterback for the Baltimore Ravens? The following table shows the number of completed passes for each athlete during the 2017 NFL football season:3Use the Wilcoxon rank sum test to
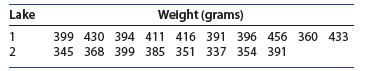
15. Weights of Turtles The weights of turtles caught in two different lakes were measured to compare the effects of the two lake environments on turtle growth. All the turtles were the same age and were tagged before being released into the lakes. The weights for n 510 1 tagged turtles caught in
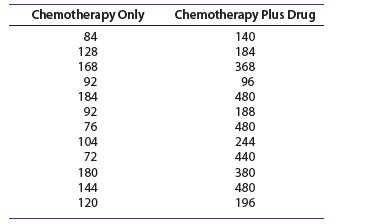
16. Chemotherapy A study was conducted to determine whether a particular drug injection reduced the harmful effects of a chemotherapy treatment on the survival time for rats. Two randomly selected groups of 12 rats received the toxic drug in a dose large enough to cause death, but in addition, one
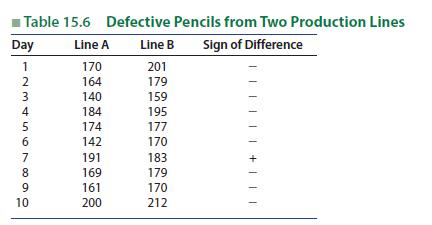
The numbers of defective mechanical pencils produced by two production lines, A and B, were recorded daily for a period of 10 days, with the results shown in Table 15.6. The response variable, the number of defective pencils, has an exact binomial distribution with a large number of pencils
A production manager wants to determine possible differences between the employee absence rates for the day versus the evening shifts. The number of absences per day is recorded for both the day and evening shifts for n5100 days. It is found that the number of absences per day for the evening shift
You wish to use the sign test to test for a significant difference between two populations based on matched pairs of observations. Use the information given to answer the following questions.What practical situations would dictate the use of the alternative hypotheses given? For the given sample
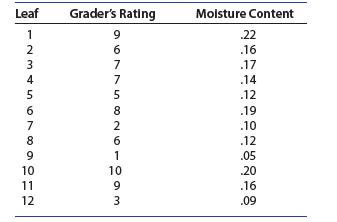
16. Rating Tobacco Leaves An experiment was conducted to study the relationship between the ratings of a tobacco leaf grader and the moisture content of the tobacco leaves. Twelve leaves were rated by the grader on a scale of 1–10, and corresponding readings of moisture content were made.a.
You wish to use the sign test to test for a significant difference between two populations based on matched pairs of observations. Use the information given to answer the following questions.What practical situations would dictate the use of the alternative hypotheses given? For the given sample
You wish to use the sign test to test for a significant difference between two populations based on matched pairs of observations. Use the information given to answer the following questions.What practical situations would dictate the use of the alternative hypotheses given? For the given sample
Two Simple Examples Use the sign test to compare two populations for significant differences for the paired data . State the null and alternative hypotheses to be tested. Determine an appropriate rejection region with a #.10. Calculate the observed value of the test statistic and present your
Two Simple Examples Use the sign test to compare two populations for significant differences for the paired data . State the null and alternative hypotheses to be tested. Determine an appropriate rejection region with a #.10. Calculate the observed value of the test statistic and present your
8. Math and Art, continued Refer to Exercise 7. Compute Spearman’s rank correlation coefficient for these data and test 0 H : no association between the rank pairs at the 10% level of significance.
4. Identical Twins II Refer to Exercise 3. What answers are obtained if Wilcoxon’s signed-rank test is used in analyzing the data? Compare with your earlier answers.
2. Response Times, continued Refer to Exercise 1.Test the hypothesis that no difference exists in the distributions of response times for the two stimuli, using the Wilcoxon signed-rank test. Use a rejection region for which a is as near as possible to the a achieved in Exercise 1, part a
Use Table 9 in Appendix I to find the appropriate rejection regions for both a 5.05 and a 5.01 3. A test to detect either positive or negative association with n525 pairs of observations
Use Table 9 in Appendix I to find the appropriate rejection regions for both a 5.05 and a 5.01 2. A test to detect negative association with n512 pairs of observations.
Use Table 9 in Appendix I to find the appropriate rejection regions for both a 5.05 and a 5.01 1. A test to detect positive association with n516 pairs of observations.
Test the hypothesis of no association between the populations for Example 15.10.
Calculate rs for the data in Table 15.12
Compare the results of the nonparametric Fr-test and the ANOVA F-test by looking at whether both tests rejected H0 and the p-values for each test. Explain the practical implications of these results. 6. Answer the questions above using the results of Exercises 2 and 4.
Compare the results of the nonparametric Fr-test and the ANOVA F-test by looking at whether both tests rejected H0 and the p-values for each test. Explain the practical implications of these results. 5. Answer the questions above using the results of Exercises 1 and 3.
Use the analysis of variance F-test to test for differences among the treatment means using a 5.05. Find or bound the p-value for this test. Use an appropriate test to determine whether blocking was effective. Summarize your results. 4. Answer the questions above for the data in Exercise 2.
Use the analysis of variance F-test to test for differences among the treatment means using a 5.05. Find or bound the p-value for this test. Use an appropriate test to determine whether blocking was effective. Summarize your results. 3. Answer the questions above for the data in Exercise 1.
The data were collected using a randomized block design. For each data set, use the Friedman Fr-test to test for differences in location among the treatment distributions using a 5.05. Bound the p-value for the test using Table 5 of Appendix I and state your conclusions.
Find the approximate p-value for the test in Example 15.8.
Compare the results of the analysis of variance F-test and the Kruskal–Wallis H-test for testing for differences in the distributions of achievement test scores for the four different conditions in Example 15.6.
12. Gourmet Cooking II Refer to the comparison of gourmet meal ratings in Exercise 11 (Section 15.2), and use the Wilcoxon signed-rank test to determine whether the data provide sufficient evidence to indicate a difference in the ratings of the two chefs. Test by using a value of a near .05.
For the situations described .decide whether the alternative hypothesis for the Wilcoxon signed-rank test is one- or two-tailed.Then give the null and alternative hypotheses for the test 4. You want to decide whether distribution 1 lies to the left of distribution 2.
For the situations described .decide whether the alternative hypothesis for the Wilcoxon signed-rank test is one- or two-tailed.Then give the null and alternative hypotheses for the test 3. You want to decide whether distribution 1 lies to the right of distribution 2.
Showing 2000 - 2100
of 6613
First
14
15
16
17
18
19
20
21
22
23
24
25
26
27
28
Last
Step by Step Answers