New Semester
Started
Get
50% OFF
Study Help!
--h --m --s
Claim Now
Question Answers
Textbooks
Find textbooks, questions and answers
Oops, something went wrong!
Change your search query and then try again
S
Books
FREE
Study Help
Expert Questions
Accounting
General Management
Mathematics
Finance
Organizational Behaviour
Law
Physics
Operating System
Management Leadership
Sociology
Programming
Marketing
Database
Computer Network
Economics
Textbooks Solutions
Accounting
Managerial Accounting
Management Leadership
Cost Accounting
Statistics
Business Law
Corporate Finance
Finance
Economics
Auditing
Tutors
Online Tutors
Find a Tutor
Hire a Tutor
Become a Tutor
AI Tutor
AI Study Planner
NEW
Sell Books
Search
Search
Sign In
Register
study help
business
statistics alive
Statistics The Art And Science Of Learning From Data 4th Global Edition Alan Agresti, Christine A. Franklin, Bernhard Klingenberg - Solutions
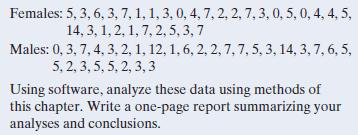
15.28 Student survey For the FL Student Survey data file on the book’s website, we identify the number of times reading a newspaper as the response variable and gender as the explanatory variable. The observations are as follows: Females: 5, 3, 6, 3, 7, 1, 1, 3, 0, 4, 7, 2, 2, 7, 3, 0, 5, 0, 4,
15.27 Wilcoxon signed-rank test about the GRE workshop Example 8 on the GRE workshop used the Wilcoxon signed-rank test to evaluate the score differences of 0.5,-0.5, and 1.5. Suppose the test differences were 5.5, -0.5, and 1.5 instead of 0.5 -0.5, and 1.5.a. State the hypotheses and find the
15.26 Sign test about the GRE workshop In Exercise 15.12 on the effect of a GRE training workshop on the writing, you used the sign test to evaluate the test differences of 0.5, -0.5, and 1.5. Suppose the test differences were 5.5,-0.5, and 1.5 instead of 0.5, -0.5., and 1.5.a. State the hypotheses
15.25 GPAs The Georgia Student Survey data file has data on college GPA and high school GPA for 59 University of Georgia students.a. If you wanted to use a nonparametric test to check your friend’s prediction that high school GPAs tend to be higher than college GPAs, which would you use?b. What
15.24 Browsing the Internet Refer to the Georgia Student Survey data file on the book’s website. Use a method from this chapter to test whether the amount of time spent browsing the Internet is independent of one’s political affiliation. State the (a) hypotheses, (b) test statistic, and(c)
15.23 Internet versus cell phones For the countries in the Human Development data file on the book’s website, in 4 countries a higher percentage of people used the Internet than used cell phones, whereas in 35 countries a higher percentage of people used cell phones than the Internet.a. Show how
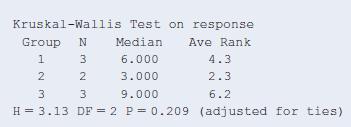
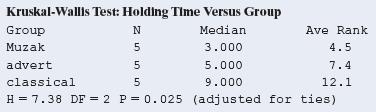
15.22 Comparing therapies for anorexia The Anorexia data file on the book’s website shows weight change for 72 anorexic teenage girls who were randomly assigned to one of three psychological treatments. Using software, analyze these data with a nonparametric Kruskal Wallis test to compare the
15.21 Comparing tans Examples 1 and 2 compared two methods of getting a tan. Suppose Allison conducted an expanded experiment in which nine participants were randomly assigned to one of two brands of tanning lotion or to the tanning studio, three participants to each treatment.The nine were ranked
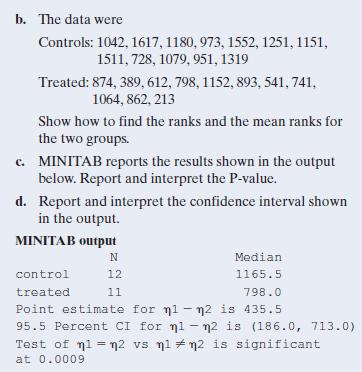
15.20 Treating alcoholics The nonparametric statistics textbook by Hollander and Wolfe (1999) discussed a study on a social skills training program for alcoholics. A sample of male alcoholics was randomly split into two groups. The control group received traditional treatment. The treatment group
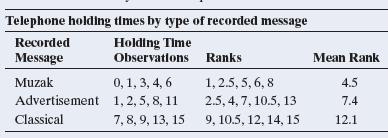
15.19 Telephone holding times In Exercise 15.8, the telephone holding times for Muzak and classical music were Muzak 0, 1, 4, 6, 3 Classical 13, 9, 8, 15, 7a. For comparing these two groups with the Wilcoxon test, report the ranks and the mean rank for each group.b. Two groups of size 5 each have
15.18 Comparing smartphone sales Refer to the previous exercise.a. Would the results of your analysis change if the second value under the sales with discount column be 9 instead of 25? What does this illustrate about the analysis?b. Suppose the retailer actually wanted to compare smartphone sales
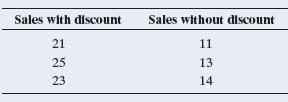
15.17 Smartphone sales A smartphone retailer wants to compare the sales of smartphones with and without offering a discount. She wanted to see if the sales increased or not. In an experimental study over 6 days, she offered a discount on 3 days while no discount was offered on the other 3 days. The
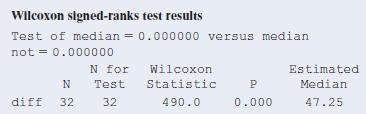
15.16 Use all data on cell phones Refer to the previous exercise.When we use the data for all 32 subjects, MINITAB reports result in the following for the Wilcoxon signedranks test.a. State the null and alternative hypotheses for this test.b. Explain how MINITAB found the value reported for the
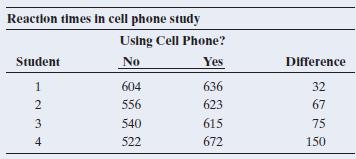
15.15 More on cell phones Refer to Exercise 15.11. That analysis did not take into account the magnitudes of the differences in reaction times. Show how to do this with the Wilcoxon signed-ranks test, illustrating by using only the four observations shown in the table there.a. State the hypotheses
15.14 More on blood pressure Refer to the previous exercise.The analysis there did not take into account the size of the change in blood pressure. Show how to do this with the Wilcoxon signed-ranks test.a. State the hypotheses for that test, for the relevant onesided alternative hypothesis.b.
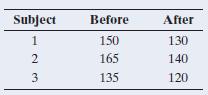
15.13 Does exercise help blood pressure? Exercise 10.50 in Chapter 10 discussed a pilot study of people who suffer from abnormally high blood pressure. A medical researcher decides to test her belief that walking briskly for at least half an hour a day has the effect of lowering blood pressure.She
15.12 Sign test for GRE scores Consider Example 8, for which the changes in the writing portion GRE scores for the first three people who attended a training workshop were 0.5, -0.5, and 1.5. Show how to use the sign test to test that the probability that the difference is positive equals 0.50
15.11 Cell phones and reaction times Example 13 in Chapter 10 compared reaction times in a simulated driving test for the same students when they were using a cell phone and when they were not. The table shows data for the first four students.For all 32 students, 26 had faster reaction times when
15.10 Tea versus coffee Which of the two beverages do people prefer more—tea or coffee? For the employees surveyed at a company, 24 prefer drinking tea and 30 prefer coffee.Let p denote the corresponding population proportion who prefer tea.a. Find the test statistic for the sign test of H0: p =
15.9 What’s the best way to learn French? Exercise 14.3 gave the data in the table for scores on the first quiz for ninthgrade students in an introductory-level French course. The instructor grouped the students in the course as follows:Group 1: Never studied foreign language before, but have
15.8 How long do you tolerate being put on hold?Examples 1–4 and 7 in Chapter 14 referred to the following randomized experiment: An airline analyzed whether telephone callers to their reservations office would remain on hold longer, on average, if they heard (a) an advertisement about the
15.7 Teenage anorexia Previous chapters described a study that used therapy to treat teenage girls who suffered from anorexia. The girls were randomly assigned to the cognitive behavioral treatment (Group 1) or to the control group (Group 2). The study observed the weight change after a period of
15.6 Trading volumes The following data show the number of shares of General Electric stock traded on Mondays and on Fridays from February through April of 2011. The trading volumes (rounded to the nearest million) are as follows:Mondays: 45, 43, 43, 66, 91, 53, 35, 45, 29, 64, 56 Fridays: 43, 41,
15.5 Estimating the effect of smoking Refer to the previous exercise. For these data, MINITAB reports:Point estimate for η1 − η2 is −2.00 95.9 Percent CI for η1 − η2 is (−3.30,−0.70)W = 31.0 Test of η1 = η2 vs η1 • η2 is significant at 0.006 Explain how to interpret the reported
15.4 Body mass reduction and smoking Smoking is a known cause of reduced body mass. To validate this, a researcher randomly selects 7 smokers and 7 nonsmokers and records their individual body mass index. The body mass index data in kg/m2 are:Smokers: 13.1, 15.2, 16.5, 15.0, 16.4, 19.3, 16.0
15.3 Comparing clinical therapies A clinical psychologist wants to choose between two therapies for treating severe mental depression. She selects six patients who are similar in their depressive symptoms and overall quality of health.She randomly selects three patients to receive Therapy 1.The
15.2 Test for tanning experiment Refer to the previous exercise. For the actual experiment, suppose the participants using the tanning studio got ranks 1 and 2 and the participants using the tanning lotion got ranks 3 and 4.a. Find and interpret the P-value for the alternative hypothesis that the
15.1 Tanning experiment Suppose the tanning experiment described in Examples 1 and 2 used only four participants, two for each treatment.a. Show the six possible ways the four ranks could be allocated, two to each treatment, with no ties.b. For each possible sample, find the mean rank for each
14.72 Student survey data Refer to the student survey data file that your class created with Activity 3 in Chapter 1.For variables chosen by your instructor, use ANOVA methods and related inferential statistical analyses.Interpret and summarize your findings in a short report and prepare to discuss
14.71 Three factors An experiment analyzed how the mean corn yield depends on three different fertilizers:Nitrogen (applied at low and high levels), phosphate(applied at low and high levels), and potash (applied at low and high levels). In the experiment, each plot of land received a combination of
14.70 Regression or ANOVA? You want to analyze y = house selling price and x = number of bathrooms(1, 2, or 3) by testing whether x and y are independent.a. You could conduct a test of independence using (i)the ANOVA F test for a multiple regression model with two indicator variables or (ii) a
14.69 Independent confidence intervals You plan to construct a 95% confidence interval in five situations with independent data sets.a. Assuming that the results of the confidence intervals are statistically independent, find the probability that all five confidence intervals will contain the
14.68 Bonferroni multiple comparisons The Bonferroni theorem states that the probability that at least one of a set of events occurs can be no greater than the sum of the separate probabilities of the events. For instance, if the probability of an error for each of five separate confidence
14.67 Between-subjects estimate This exercise motivates the formula for the between-subjects estimate of the variance in one-way ANOVA. Suppose each population mean equals m (that is, H0 is true) and each sample size equals n. Then the sampling distribution of each yi has mean m and variance s2>n,
14.66 What causes large or small F? An experiment used four groups of five individuals each. The overall sample mean was 60.a. What did the sample means look like if the one-way ANOVA for comparing the means had test statistic F = 0? (Hint: What would have to happen for the between-groups
14.65 True or false: Interaction For subjects aged under 50, there is little difference in mean annual medical expenses for smokers and nonsmokers. For subjects aged over 50, there is a large difference. Is it true or false that there is interaction between smoking status and age in their effects
14.64 Multiple choice: Interaction There is interaction in a two-way ANOVA model whena. The two factors are associated.b. Both factors have significant effects in the model without interaction terms.c. The difference in true means between two categories of one factor varies among the categories of
14.63 Multiple choice: Multiple comparisons For four means, it is planned to construct Tukey 95% multiple comparison confidence intervals for the differences between the six pairs.a. For each confidence interval, there is a 0.95 chance that the interval will contain the true difference.b. The
14.62 Multiple choice: ANOVA variability One-way ANOVA provides relatively more evidence that H0: m1 = g= mg is false:a. The smaller the between-groups variation and the larger the within-groups variation.b. The smaller the between-groups variation and the smaller the within-groups variation.c. The
14.61 Multiple choice: ANOVA/regression similarities Analysis of variance and multiple regression have many similarities. Which of the following is (are) not true?a. ANOVA is analogous to multiple regression with all categorical independent variables.b. Both have F tests for testing that the
14.60 Another Simpson paradox The 25 women faculty members in the humanities division of a college have a mean salary of $65,000, whereas the five women faculty in the science division have a mean salary of $72,000.The 20 men in the humanities division have a mean salary of $64,000, and the 30 men
14.59 Multiple comparison confidence For four groups, explain carefully the difference between a confidence level of 0.95 for a single comparison of two means and a confidence level of 0.95 for a multiple comparison of all six pairs of means.
14.58 A • B and B • C, but A 3 C? In multiple comparisons following a one-way ANOVA with equal sample sizes, the margin of error with a 95% confidence interval for comparing each pair of means equals 5. Give three sample means illustrating that it is possible that Group A is not significantly
14.57 Sketch within- and between-groups variability Sketch a dot plot of data for 10 observations in each of three groups such thata. You believe the P-value would be very small for a one-way ANOVA. (You do not need to do the ANOVA; merely show points for which you think this would happen.)b. The
14.56 Number of friends and degree Using the GSS website sda.berkeley.edu/GSS, analyze whether the number of good friends (the variable NUMFREND) depends on the subject’s highest degree (the variable DEGREE).To do so, click the MEANS tab (next to the default TABLES tab) and enter the variable
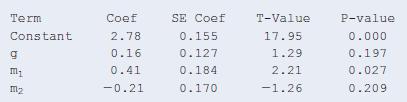
14.55 Regress TV watching on gender and marital status When we use the 2014 GSS and regress y = number of hours per day watching TV on g = gender(1 = male, 0 = female) and marital status (m1 = 1 for singles, 0 otherwise, m2 = 1 for married subjects, 0 otherwise), we get the following outputa. Write
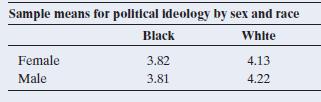
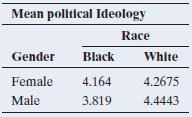
14.54 Political ideology interaction The first table shown summarizes responses on political ideology (where 1 = extremely liberal and 7 = extremely conservative)from the 2014 GSS by gender and race.a. From these sample means, is there evidence of a significant interaction? Explain what this means
14.53 Salary and gender The American Association of University Professors (AAUP) reports yearly on faculty salaries for all types of higher education institutions across the United States. Regard Salary as the response variable, Gender as the explanatory variable, and Academic Rank as the control
14.52 TV watching by gender and race When we use the 2008 GSS to evaluate how the mean number of hours a day watching TV depends on gender and race, we get the results shown in the ANOVA table that follows.a. Identify the response variable and the factors.b. From the table, specify the test
14.51 Birth weight, age of mother, and smoking A study on the effects of prenatal exposure to smoke (by J. Nigg and N. Breslau, Journal of the American Academy of Child &Adolescent Psychiatry, vol. 46, 2009, pp. 362–369) indicated that mean birth weight was significantly lower for babies born to
14.50 Income, gender, and education According to the U.S.Bureau of the Census, as of March 2009, the average earnings of full-time workers was estimated to be $31,666 for females with high school education, $43,493 for males with high school education, $60,293 for white females with a bachelor’s
14.48 Regress kids on gender and race Refer to the previous exercise. Let f = 1 for females and 0 for males and let r = 1 for blacks and 0 for whites. The regression model for predicting y = ideal number of kids is yn = 2.42 +0.04f + 0.37r.a. Interpret the coefficient off. What is the practical
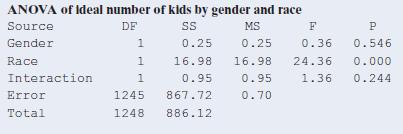
14.47 Ideal number of kids by gender and race The GSS asks,“What is the ideal number of kids for a family?” When we use a recent GSS to evaluate how the mean response depends on gender and race (black or white), we get the results shown in the ANOVA table.a. Identify the response variable and
14.46 House with garage Refer to the House Selling Price OR data file on the book’s website.a. The variable “Garage” included in the dataset is an indicator variable for whether a house has a garage(with 1 indicating that it does have one). Using software, put this as the sole predictor of
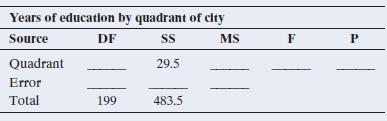
14.45 Years of education varies by region? A social scientist compares years of education in four quadrants of a city.To do this, she randomly selects 50 adults from each quadrant of the city. The ANOVA table, shown in the table that follows, refers to a comparison of mean years of education for
14.44 Comparing therapies for anorexia The Anorexia data file on the book’s website shows weight change for 72 anorexic teenage girls who were randomly assigned to one of three psychological treatments.a. Show how to construct 95% confidence intervals to investigate how the population means
14.43 Georgia political ideology The Georgia Student Survey file on the book’s website asked students their political party affiliation 11 = Democrat, 2 = Republican, 3 = Independent) and their political ideology (on a scale from 1 = very liberal to 7 = very conservative). The table shows results
14.42 Compare segregation means Refer to the previous exercise.a. Using software, find the margin of error that pertains to each comparison, using the Tukey method for 95%multiple comparison confidence intervals.b. Using parta, determine which pairs of means, if any, are significantly different.
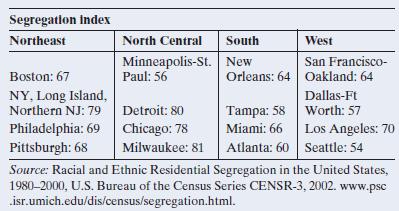
14.41 Segregation by region Studies of the degree of residential racial segregation often use the segregation index. This is the percentage of nonwhites who would have to change the block on which they live to produce a fully nonsegregated city—one in which the percentage of nonwhites living in
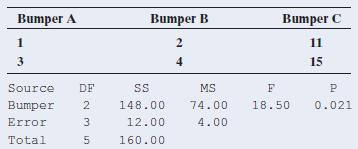
14.40 Compare bumpers Refer to the previous exercise.a. Find the margin of error for constructing a 95% confidence interval for the difference between any pair of the true means. Interpret by showing which pairs of bumpers (if any) are significantly different in their true mean repair costs.b. For
14.39 Comparing auto bumpers A consumer organization compares the sturdiness of three types of front bumpers.In the study, a particular brand of car is driven into a concrete wall at 15 miles per hour. The response is the amount of damage, as measured by the repair costs, in hundreds of dollars.
14.38 Singles watch more TV The 2014 General Social Survey asked 1475 subjects how many hours per day they watched TV, on average. Are there differences in population means according to the marital status of the subject (single, married, divorced)? The sample means were 3.27 for singles(n = 459),
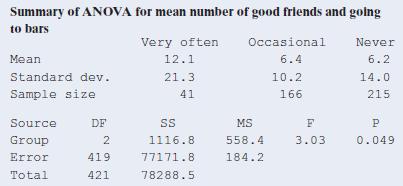
14.37 Going to bars and having friends Do people who go to bars and pubs a lot tend to have more friends? A recent GSS asked, “How often do you go to a bar or tavern?”The table shows results of ANOVA for comparing the mean number of good friends at three levels of this variable.The very often
14.36 Good friends and marital status Is the number of good friends associated with marital status? For GSS data with marital status measured with the categories(married, widowed, divorced, separated, never married), an ANOVA table reports F = 0.80 based on df1 = 4, df2 = 612.a. Introduce notation
14.35 Regression of weight gain on diet Refer to the previous exercise.a. Set up indicator variables for protein source and for protein level and specify a regression model with the effects both of protein level and protein source on weight gain.b. Fit the model in part a and explain how to
14.34 Diet and weight gain A randomized experiment4 measured weight gain (in grams) of male rats under six diets varying by source of protein (beef, cereal, pork) and level of protein(high, low). Ten rats were assigned to each diet. The data are shown in the table that follows and are also
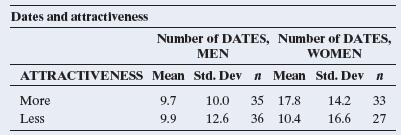
14.33 Attractiveness and getting dates The results in the table are from a study of physical attractiveness and subjective well-being (E. Diener et al., Journal of Personality and Social Psychology, vol. 69, 1995, pp. 120–129). A panel rated a sample of college students on their physical
14.32 Ideology by gender and race Refer to Example 12, the sample means from which are shown again below (for 2008 data).a. Explain how to obtain the following interpretation for the interaction from the sample means: “For females there is no race effect on ideology. For males, whites are more
14.31 Income by gender and degree In 2012, the population mean hourly wage for males was $17 for high school graduates,$33 for college graduates and $43 for males with more advanced degrees. For females, the means were $14 for high school graduates, $24 for college graduates, and$32 for females
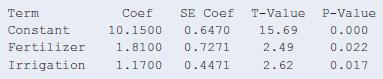
14.30 Wheat crop yield The following table shows the result of fitting the regression model for predicting wheat crop yield with indicator variables for fertilizer level (low: 0, high: 1) and irrigation level (low: 0, high: 1).a. Explain why the coefficient of irrigation is the estimated difference
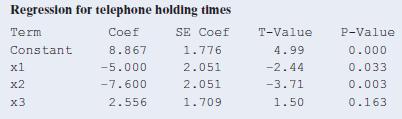
14.29 Regression for telephone holding times Refer to the previous exercise. Let x1 = 1 for the advertisement and 0 otherwise, x2 = 1 for Muzak and 0 otherwise, and x1 = x2 = 0 for classical music. Likewise, let x3 = 1 for repeating in 10-minute cycles and x3 = 0 for repeating in 5-minute cycles.
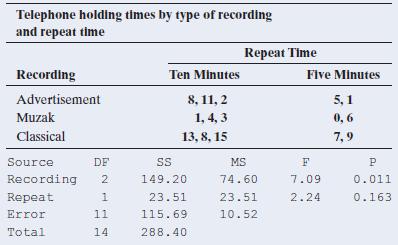
14.28 Hang up if recording repeated? Example 2 described an experiment in which telephone callers to an airline were put on hold with an advertisement, Muzak, or classical music in the background. Each caller who was chosen was also randomly assigned to a category of a second factor: whether the
14.27 Corn and manure In Example 10, the coefficient of the manure-level indicator variable m is 1.96.a. Explain why this coefficient is the estimated difference in mean corn yield between the high and low levels of manure, for each level of fertilizer.b. Explain why the 95% confidence interval for
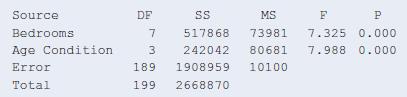
14.26 House prices, age, and bedrooms For the House Selling Prices OR data file on the book’s website, the output shows the result of conducting a two-way ANOVA of house selling prices (in thousands) by the number of bedrooms in the house and the age (New, Medium, Old, Very Old—see exercise
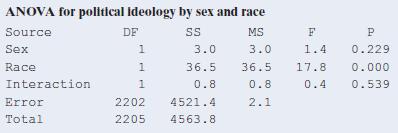
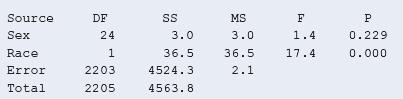
14.25 Political ideology in 2014 The GSS measures political ideology on a seven-point scale, starting with 1 = extremely liberal, to 4 = moderate, to 7 = extremely conservative. The following table shows results from an ANOVA analysis about political ideology, with sex (female, male) and race
14.24 Fertilizer main effects For the previous exercise, show a hypothetical set of population means for the four groups that would havea. A dose effect but no fertilizer effect.b. A fertilizer effect but no dose effect.c. A fertilizer effect and a dose effect.d. No fertilizer effect and no dose
14.23 Effect of fertilizers An experiment randomly assigns 100 agricultural plots of land to one of four groups of fertilizers:low-dose nitrogen, high-dose nitrogen, low-dose potassium, and high-dose potassium. After three months of using them, the change in harvest is measured (as compared to last
14.22 Multiple comparison for time on Facebook Refer to Exercise 14.13, which investigated the amount of time freshman, sophomores, juniors, and seniors spent on Facebook while doing schoolwork. The data from the study are available on the book’s website, where time is measured in minutes.a. If
14.21 French ANOVA Refer to Exercise 14.3 about studying French, with data shown again below. Using software,a. Compare the three pairs of means with separate 95%confidence intervals. Interpret.b. Compare the three pairs of means with Tukey 95%multiple comparison confidence intervals. Interpret and
14.20 Advertising effect on sales Each of 100 restaurants in a fast-food chain is randomly assigned one of four media for an advertising campaign: A = radio, B = TV, C = newspaper, D = mailing. For each restaurant, the observation is the change in sales, defined as the difference between the sales
14.19 Regression for outsourcing Refer to the previous exercise.a. Set up indicator variables to represent the three service centers.b. The prediction equation is yn = 7.1 + 0.5x1 + 0.7x2, where x1 is an indicator variable for San Jose and x2 an indicator variable for Toronto. Find the estimate for
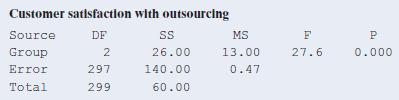
14.18 Outsourcing satisfaction Exercise 14.5 showed an ANOVA for comparing mean customer satisfaction scores for three service centers. The sample means on a scale of 0 to 10 were 7.60 in San Jose, 7.80 in Toronto, and 7.10 in Bangalore. Each sample size = 100, MS error = 0.47, and the F test
14.17 Hamburger sales regression Refer to the previous exercise.a. Set up indicator variables for a regression model so that an F test for the regression parameters is equivalent to the ANOVA test comparing the three means.b. Express the null hypothesis both in terms of population means and in
14.16 Hamburger sales The market research department of a chain of hamburger restaurants wants to compare the mean monthly sales of hamburgers under three different marketing strategies. It randomly assigns 15 restaurants to the three groups, five per group. The sample means for the three groups
14.15 Tukey holding time comparisons Refer to the previous exercise. We could instead use the Tukey method to construct multiple comparison confidence intervals. The Tukey confidence intervals having overall confidence level 95% have margins of error of 5.7, compared to 4.7 for the separate 95%
14.14 Comparing telephone holding times Examples 2 and 3 analyzed whether telephone callers to an airline would stay on hold different lengths of time, on average, if they heard (a) an advertisement about the airline, (b) Muzak, or (c) classical music. The sample means were 5.4, 2.8, and 10.4, with
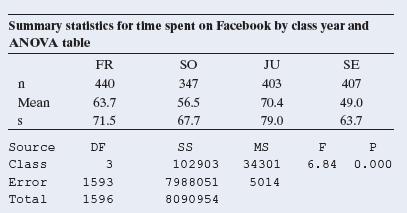
14.13 Time on Facebook Do freshmen spent significantly more time on Facebook than other class ranks? A recent study (R. Junco, Journal of Applied Developmental Psychology, 2015, vol. 36, p. 18–29) investigated the amount of time per day freshman, sophomores, juniors, and seniors spent on Facebook
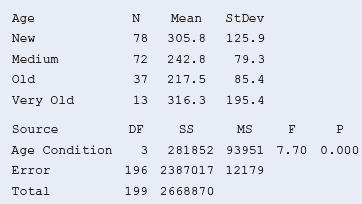
14.12 House prices and age For the House Selling Prices OR data file on the book’s website, the output shows the result of conducting an ANOVA comparing mean house selling prices (in $1000) by Age Category (New = 0 to 24 years old, Medium = 25 to 50 years old, Old = 51 to 74 years old, Very Old =
14.11 Comparing therapies for anorexia The Anorexia data file on the book’s website shows weight change for 72 anorexic teenage girls who were randomly assigned to one of three psychological treatments (cognitive or family therapy and a control treatment). Use software to analyze these data. (The
14.10 Software and French ANOVA Refer to Exercise 14.3.Using software,a. Create the data file and find the sample means and standard deviations.b. Find and report the ANOVA table. Interpret the P-value.c. Change an observation in Group 2 so that the P-value will be smaller. Specify the value you
14.9 French cuisine The restaurant guide Zagat compiles customer ratings on the quality of food on a 30-point scale. The data set French Cuisine on the book’s website contains a random sample of ratings of French cuisine restaurants in New York, London, and Paris, compiled in June 2015 from the
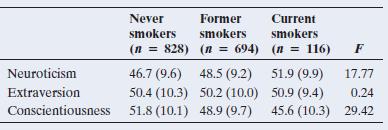
14.8 Smoking and personality A study about smoking and personality (by A. Terracciano and P. Costa, Addiction, vol.99, 2004, pp. 472–481) used a sample of 1638 adults in the Baltimore Longitudinal Study on Aging. The subjects formed three groups according to smoking status (never, former,
14.7 Years of education A recent General Social Survey asked students at an Australian university, “What is the ideal number of years of education for an individual?” Do responses tend to depend on the subjects’ area of residence?Results of an ANOVA are shown in the printout, for different
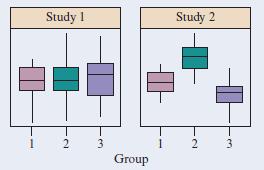
14.6 ANOVA and box plots For two studies, each comparing three groups, the box plots below show results. (Each box plot is based on a random sample of size 40.)a. Judging from the box plots, which study will more likely lead to a rejection of the ANOVA null hypothesis of equal population means?
14.5 Outsourcing Example 1 at the beginning of this chapter mentioned a study to compare customer satisfaction at service centers in San Jose, California; Toronto, Canada;and Bangalore, India. Each center randomly sampled 100 people who called during a two-week period. Callers rated their
14.4 What affects the F value? Refer to the previous exercise.a. Suppose that the first observation in the second group was actually 9, not 1. Then the standard deviations are the same as reported in the table, but the sample means are 6, 7, and 8 rather than 6, 3, and 8. Do you think the F test
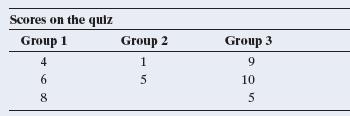
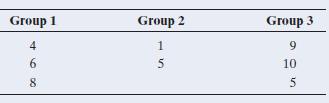
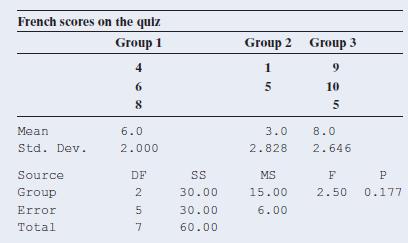
14.3 What’s the best way to learn French? The following table shows scores on the first quiz (maximum score 10 points) for eighth-grade students in an introductory level French course. The instructor grouped the students in the course as follows:Group 1: Never studied foreign language before but
14.2 Satisfaction with banking A bank conducts a survey in which it randomly samples 400 of its customers. The survey asks the customers which way they use the bank the most: (1) interacting with a teller at the bank, (2) using ATMs, or (3) using the bank’s online banking service.It also asks
14.1 Restaurant satisfaction The CEO of a company that owns six restaurants wants to evaluate and compare visitor satisfaction across all six restaurants. The company’s research department randomly sampled 150 people who had visited any of the restaurants during the past month and asked them to
13.93 When is p = 0.50? When a + bx = 0, so that x = -a>b, show that the logistic regression equation p = ea + bx> 11 + ea + bx2 gives p = 0.50.
Showing 900 - 1000
of 6613
First
3
4
5
6
7
8
9
10
11
12
13
14
15
16
17
Last
Step by Step Answers