New Semester
Started
Get
50% OFF
Study Help!
--h --m --s
Claim Now
Question Answers
Textbooks
Find textbooks, questions and answers
Oops, something went wrong!
Change your search query and then try again
S
Books
FREE
Study Help
Expert Questions
Accounting
General Management
Mathematics
Finance
Organizational Behaviour
Law
Physics
Operating System
Management Leadership
Sociology
Programming
Marketing
Database
Computer Network
Economics
Textbooks Solutions
Accounting
Managerial Accounting
Management Leadership
Cost Accounting
Statistics
Business Law
Corporate Finance
Finance
Economics
Auditing
Tutors
Online Tutors
Find a Tutor
Hire a Tutor
Become a Tutor
AI Tutor
AI Study Planner
NEW
Sell Books
Search
Search
Sign In
Register
study help
business
statistics alive
Statistics The Art And Science Of Learning From Data 4th Global Edition Alan Agresti, Christine A. Franklin, Bernhard Klingenberg - Solutions
10.57 Comparing book prices 2 For the data in the previous exercise, use software or a calculator to perform a significance test comparing the population mean prices.Show all steps of the test and indicate whether you would conclude that the mean price is lower at one of the two Internet bookstores.
10.58 Lung capacity revisited Refer to Exercise 10.34 about measuring the lung function (called the forced vital capacity, or FVC, measured in liters) before and after using an inhaler. The data are shown again in the following table.Checkup 1 2 3 4 5 Before using inhaler: 5.08 5.99 5.32 6.03 5.44
10.59 Comparing speech recognition systems Table 10.20 in Example 17, repeated here, showed results of an experiment comparing the results of two speech recognition systems, GMDS and CDHMM.CDHMM GMDS Correct Incorrect Correct 1921 58 Incorrect 16 5a. Estimate the population proportion p1 of correct
10.60 Treat juveniles as adults? The table that follows refers to a sample of juveniles convicted of a felony in Florida.Matched pairs were formed using criteria such as age and the number of prior offenses. For each pair, one subject was handled in the juvenile court and the other was transferred
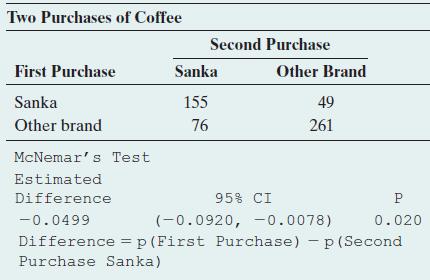
10.61 Change coffee brand? A study was conducted to see if an advertisement campaign would increase market share for Sanka instant decaffeinated coffee (R. Grover and V.Srinivasan, J. Marketing Research, vol. 24, 1987, pp. 139–153). Subjects who use instant decaffeinated coffee were asked which
10.62 President’s popularity Last month a random sample of 1000 subjects was interviewed and asked whether they thought the president was doing a good job. This month the same subjects were asked this again. The results are:450 said yes each time, 450 said no each time, 60 said yes on the first
10.63 Marital status and life insurance Adult males participating in a poll were asked whether they were married and whether they had subscribed to a life insurance policy. Of all the respondents, 42% males said that they were married and 32.6% said that they had a life insurance policy.a. Estimate
10.64 Marital status and life insurance by age Refer to the previous exercise. Results in this poll also depended strongly on the age of the respondents. For instance, the percentages of respondents (married, having a life insurance policy) were (10%, 5%) between the ages of 18 to 24 years, (45%,
10.65 Benefits of drinking A USA Today story (May 22, 2010) about the medical benefits of moderate drinking of alcohol stated that a major French study links those who drink moderately to a lower risk for cardiovascular disease but challenges the idea that moderate drinking is the cause.
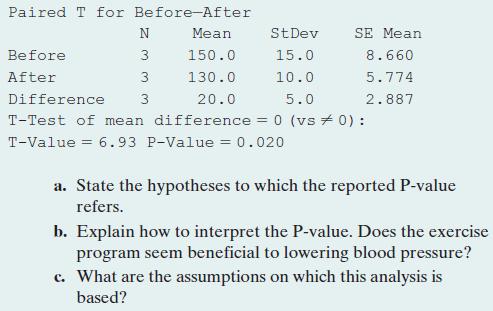
10.50 Test for blood pressure Refer to the previous exercise.The output shows some results of using software to analyze the data with a significance test. Paired T for Before-After Before After Difference N Mean StDev SE Mean 3 150.0 15.0 8.660 3 130.0 10.0 5.774 3 20.0 5.0 2.887 T-Test of mean
10.49 Does exercise help blood pressure? Several recent studies have suggested that people who suffer from abnormally high blood pressure can benefit from regular exercise. A medical researcher decides to test her belief that walking briskly for at least half an hour a day has the 10.4 Practicing
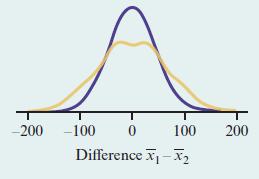
10.48 Sampling distribution of x1 - x2 Refer to Example 12, which compared two groups of seven dogs each in terms of their time interacting with their owners. The following graph shows a smoothed version of the sampling distribution of x1 - x2 derived from the permutation approach. Superimposed (in
10.33 Normal assumption The methods of this section make the assumption of a normal population distribution. Why do you think this is more relevant for small samples than for large samples? (Hint: What shape does the sampling distribution of x1 - x2 have for large samples, regardless of the actual
10.34 Vital capacity One of the authors of this book has his lung function checked every other year. At each checkup, his lung volume (called the forced vital capacity, or FVC)is measured before and after using an inhaler that contains medication against asthma. The last five checkups provided the
10.35 Body dissatisfaction Female college student participation in athletics has increased dramatically over the past few decades. Sports medicine providers are aware of some unique health concerns of athletic women, including disordered eating. A study (M. Reinking and L. Alexander, Journal of
10.36 Body dissatisfaction test Refer to the previous exercise.a. Find the P-value for testing whether the population means are equal. Use a two-sided alternative.b. Summarize assumptions for the analysis in parta. Do you think the normality assumption is justified? If not, what is the consequence
10.37 Surgery versus placebo for knee pain Refer to Example 10, “Arthroscopic Surgery.” Here we show MINITAB output comparing mean knee pain scores for the placebo (Group 1) to lavage arthroscopic surgery(Group 2) assuming equal population standard deviations.a. State and interpret the result
10.38 Comparing clinical therapies A clinical psychologist wants to choose between two therapies for treating severe cases of mental depression. She selects six patients who are similar in their depressive symptoms and in their overall quality of health. She randomly selects three of the patients
10.39 Clinical therapies 2 Refer to the previous exercise.a. For the null hypothesis, H0: m1 = m2, show that t = 2.62 and the two-sided P@value = 0.059. Interpret.b. What decision would you make in the test, using a (i)0.05 and (ii) 0.10 significance level? Explain what this means in the context of
10.40 Vegetarians more liberal? When a sample of social science graduate students at the University of Florida gave their responses on political ideology (ranging from 1 = very liberal to 7 = very conservative ), the mean was 3.18 1s = 1.722 for the 51 nonvegetarian students and 2.22 1s = 0.672 for
10.41 Teeth whitening results One scientific “test of whiteness”tested the effect of a self applied tooth-whitening peroxide gel system in a randomized, controlled clinical trial.9 The 58 adults assigned to the gel whitening group applied the gel after normal brushing according to the
10.42 Permuting therapies Refer to Exercise 10.38, which compared two therapies for depression patients. Suppose that in a different experiment, only four patients took part; two were randomly assigned to the group that received therapy 1 and the remaining two to the group that received therapy
10.43 Permutations equally likely Refer to the previous exercise comparing improvement scores under two therapies for depression patients.a. State the null hypothesis of equal population distributions in the context of this experiment.b. Argue that if the null hypothesis is true, the sampling
10.44 Two-sided permutation P-value Refer to the previous exercise and the sampling distribution mentioned there.What is the permutation P-value for the two-sided test with alternative hypothesis that the mean improvement scores are different under therapies 1 and 2? (Hint: As for any regular test,
10.45 Time spent on social networks revisited Exercise 10.31 considered the following data on the number of hours students spent on social network sites per week:Males: 5, 7, 9, 10, 12, 12, 12, 13, 13, 15, 15, 20 Females: 5, 7, 7, 8, 10, 10, 11, 12, 12, 14, 14, 14, 16, 18, 20, 20, 20, 22, 23, 25,
10.46 Compare permutation test to t test Refer to the previous exercise.a. Run a t test and report the P-value for the two-sided alternative hypothesis.b. Using a significance level of 0.10, are the decisions based on the t test and based on the permutation test comparable? Which one would you
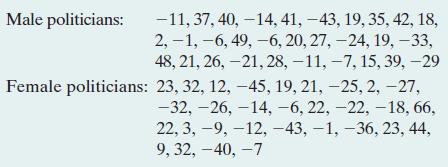
10.47 Dominance of politicians For a rating experiment, researchers translated short video clips of randomly selected speeches by 30 male and 30 female politicians into animated, gender-neutral stick-figures. These animated sequences were rated (on a scale from −100 to 100) by a panel of students
10.66 Death penalty in Kentucky A study of the death penalty in Kentucky reported the results shown in the table. (Source:Data from T. Keil and G. Vito, Amer. J. Criminal Justice, vol. 20, 1995, pp. 17–36.)a. Find and compare the percentage of white defendants with the percentage of black
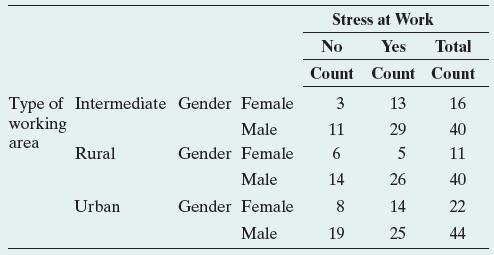
10.67 Stress at work A study performed in Austria in 2015 addressed the problem of workplace stress by the gender of the worker. Researchers also used the type of working area as a control variable to shed more light on the association between the variables. The data shown in the following table
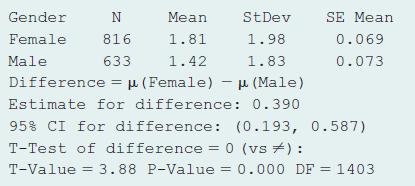
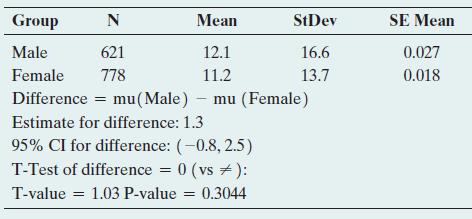
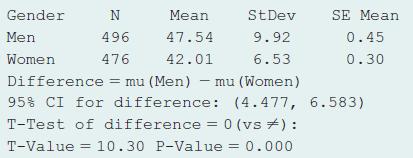
10.86 How often do you feel sad? A recent General Social Survey asked, “How many days in the past seven days have you felt sad?” Software comparing results for men and women who responded showed the following results.a. Explain how to interpret the P-value. Do you think that the population
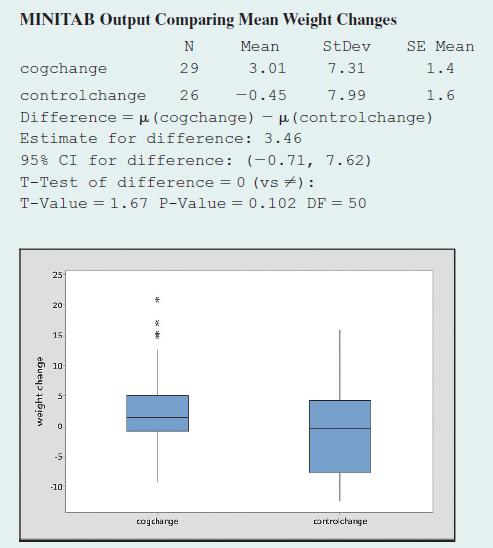
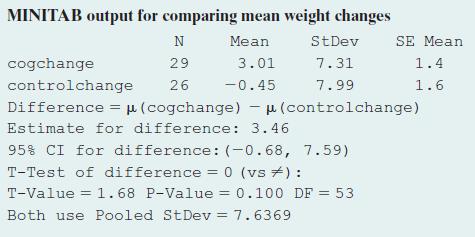
10.89 Teenage anorexia Example 8 in Section 9.3 described a study that used a cognitive behavioral therapy to treat a sample of teenage girls who suffered from anorexia. The study observed the mean weight change after a period of treatment. Studies of that type also usually have a control group
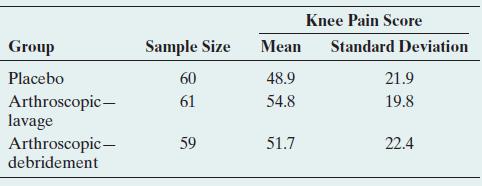
10.91 Surgery versus placebo for knee pain Refer to Example 10 on whether arthroscopic surgery is better than placebo. The following table shows the pain scores one year after surgery. Using software (such as MINITAB) that can conduct analyses using summary statistics, compare the placebo to the
10.93 Anorexia again Refer to Exercise 10.89, comparing mean weight changes in anorexic girls for cognitive behavioral therapy and a control group. The MINITAB output shows results of doing analyses while assuming equal population standard deviations.a. Interpret the reported confidence interval.b.
10.83 Time spent on Internet In 2014, the General Social Survey asked about the number of hours a week spent on the World Wide Web (variable denoted WWWHR).Some results are as follows:a. Identify the response variable and explanatory variable.Indicate whether each variable is quantitative or
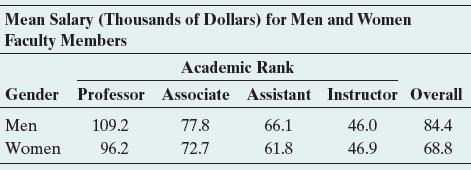
10.68 Teacher salary, gender, and academic rank The American Association of University Professors (AAUP)reports yearly on faculty salaries for all types of higher education institutions across the United States. The following table lists the mean salary, in thousands of dollars, of full-time
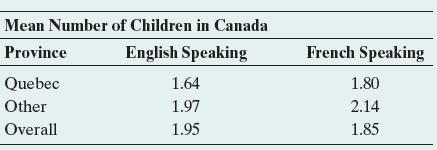
10.69 Family size in Canada The table shows the mean number of children in Canadian families, classified by whether the family was English speaking or French speaking and by whether the family lived in Quebec or in another province.a. Overall, compare the mean number of children for
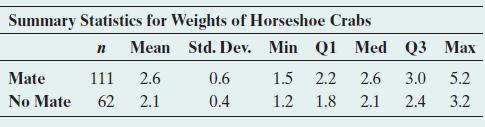
10.79 Heavier horseshoe crabs more likely to mate? A study of a sample of horseshoe crabs on a Florida island (J.Brockmann, Ethology, vol. 102, 1996, pp. 1–21) investigated the factors that were associated with whether female crabs had a male crab mate. Basic statistics, including the five-number
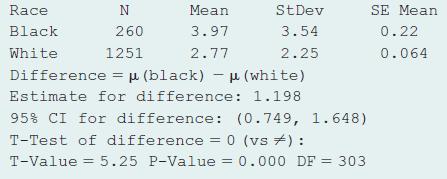
10.80 TV watching and race The 2014 GSS asked about the number of hours you watch TV per day. An analysis that evaluates this by race shows the results (note the codes:1 = Black and 2 = White):a. Do you believe that TV watching has a normal distribution for each race? Why or why not? What effect
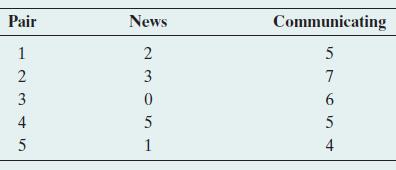
10.101 Internet use As part of her class project in a statistics course, a student decided to study ways in which her fellow students use the Internet. She randomly sampled 5 of the 165 students in her course and asked them, “In the past week, how many days did you use the Internet to (a) read
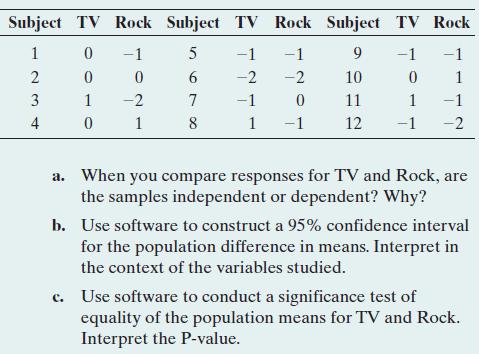
10.102 TV or rock music a worse influence? In a recent General Social Survey, subjects were asked to respond to the following: “Children are exposed to many influences in their daily lives. What kind of influence does each of the following have on children? 1. Programs on network television, 2.
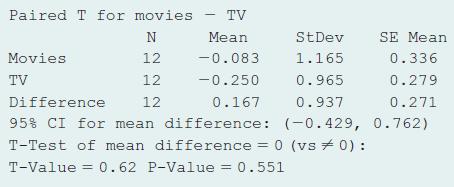
10.103 Influence of TV and movies Refer to the previous exercise. The GSS also asked about the influence of movies. The responses for these 12 subjects were-1, 1, 0, 2, 0,-2, -1, 0,-1, 1, 1, -1. The results of using MINITAB to compare the influence of movies and TV are shown below. Explain how to
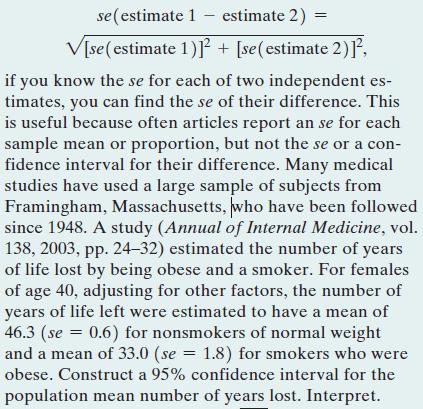
10.123 Standard error of difference From the box formula for the standard error at the end of Section 10.1, se (estimate 1 estimate 2) = V[se (estimate 1)] + [se (estimate 2)], if you know the se for each of two independent es- timates, you can find the se of their difference. This is useful
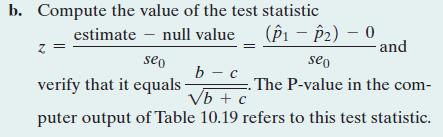
10.127 Null standard error for matched pairs Under the null hypothesis H0: p1 = p2 of equal population proportions, the standard error for the difference in the two sample proportions mentioned in the previous exercise reduces to se0: = 31b + c2 >n2, where b and c are the off-diagonal elements
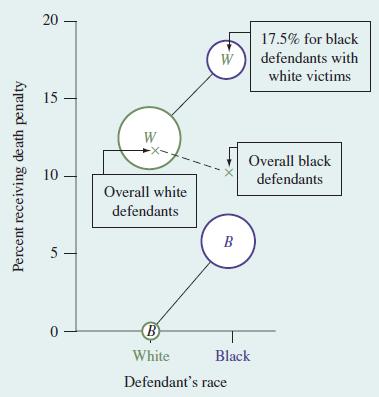
10.128 Graphing Simpson’s paradox The figure illustrates Simpson’s paradox for Example 18 on the death penalty.For each defendant’s race, the figure plots the percentage receiving the death penalty. Each percentage is labeled by a letter symbol giving the category of the victim’s race.
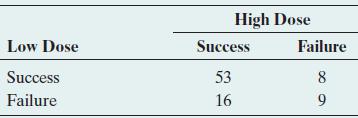
10.104 Crossover study The table summarizes results of a crossover study to compare results of low-dose and high-dose analgesics for relief of menstrual bleeding(B. Jones and M. Kenward, Statistics in Medicine, vol. 6, 1987, pp. 555–564).a. Find the sample proportion of successes for each dose of
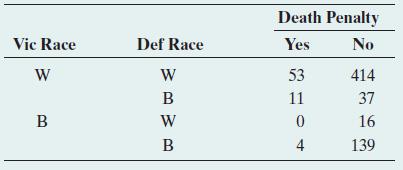
10.106 Death penalty paradox Exercise 3.58 showed results of another study about the death penalty and race. The data are repeated here.a. Treating victim’s race as the control variable, show that Simpson’s paradox occurs.b. Explain what causes the paradox to happen. Death Penalty Vic Race Def
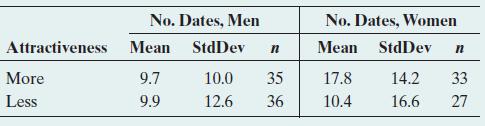
10.111 Attractiveness and getting dates The results in the table are from a study of physical attractiveness and subjective well-being (E. Diener et al., Journal of Personality and Social Psychology, vol. 69, 1995, pp. 120–129). As part of the study, college students in a sample were rated by a
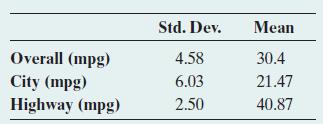
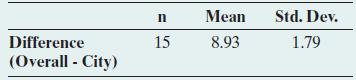
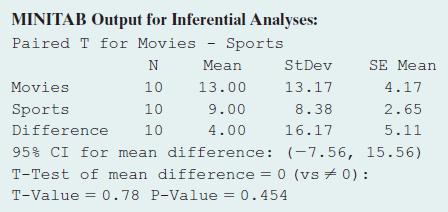
10.54 Mileage of midsized cars The following table lists the fuel economy of 15 midsized cars when driven in the city and when driven on the highway, along with their overall mileage. Their performance in miles per gallon (mpg) in each test was recorded and the means and standard deviations of
10.18 Employment by gender The study described in Exercise 10.16 also evaluated the weekly time spent in employment.This sample comprises men and women with a high level of labor force attachment. Software shows the results.a. Does it seem plausible that employment has a normal distribution for
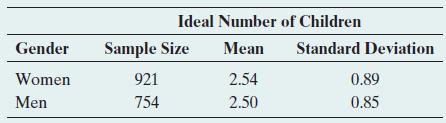
10.19 Ideal number of children In 2014, the GSS asked, “What is the ideal number of children for a family to have?” For those giving a numerical response (and treating the response“7 or more” as 7), the following table shows summary statistics. (You can reproduce these data by typing
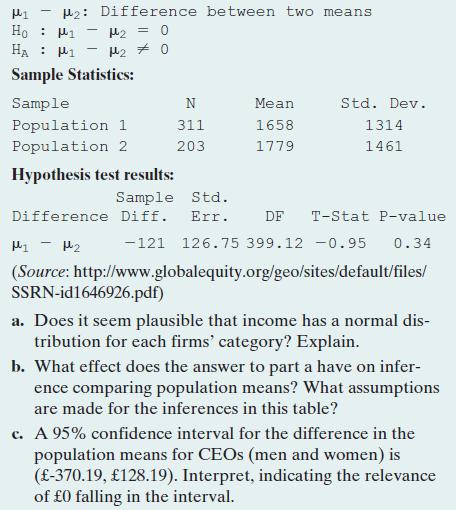
10.20 Annual income of CEOs A study analyzes the total annual pay of CEOs (in pounds) for a sample of UK companies over the period 2003–2006 categorized according to the number of compensation consultants employed. The sample included 311 firms having one consultant and 203 firms having two
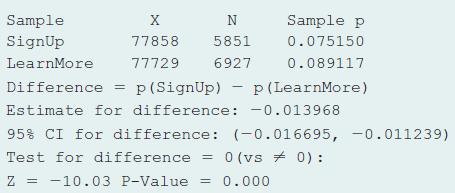
10.12 Obama A/B testing To increase Barack Obama’s visibility and to raise money for the campaign leading up to the 2008 presidential election, Obama’s analytics team conducted an A/B test with his website. In the original version, the button to join the campaign read “Sign Up”.In an
10.55 Midsized cars’ gas mileage change Refer to the previous exercise. Statistics of the change in the overall performance and the city performance are summarized in the following table:a. Explain how this standard deviation could be so much less than the standard deviations for the miles per
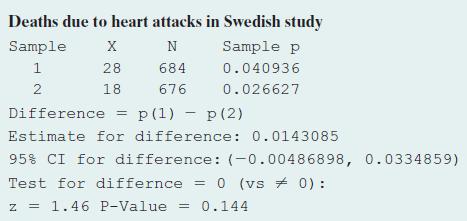
10.6 Aspirin and heart attacks in Sweden A Swedish study used 1360 patients who had suffered a stroke. The study randomly assigned each subject to an aspirin treatment or a placebo treatment.3 The table shows MINITAB output, where X is the number of deaths due to heart attack during a follow-up
10.50 Test for blood pressure Refer to the previous exercise.The output shows some results of using software to analyze the data with a significance test. Paired T for Before-After Before After Difference N Mean StDev SE Mean 3 150.0 15.0 8.660 3 130.0 10.0 5.774 3 20.0 5.0 2.887 T-Test of mean
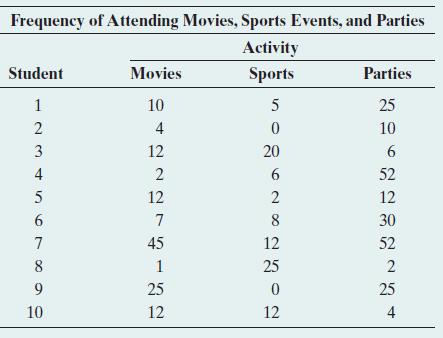
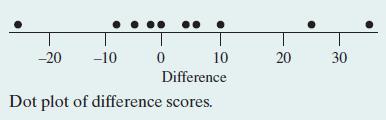
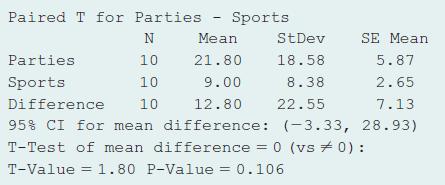
10.51 Social activities for students As part of her class project, a student at the University of Florida randomly sampled 10 fellow students to investigate their most common social activities.As part of the study, she asked the students to state how many times they had done each of the following
10.52 More social activities Refer to the previous exercise.The output shows the result of comparing the mean responses on parties and sports.a. Explain how to interpret the reported 95% confidence interval.b. State the hypotheses to which the P-value refers and interpret its value.c. Explain the
10.54 Mileage of midsized cars The following table lists the fuel economy of 15 midsized cars when driven in the city and when driven on the highway, along with their overall mileage. Their performance in miles per gallon (mpg) in each test was recorded and the means and standard deviations of
10.55 Midsized cars’ gas mileage change Refer to the previous exercise. Statistics of the change in the overall performance and the city performance are summarized in the following table:a. Explain how this standard deviation could be so much less than the standard deviations for the miles per
10.61 Change coffee brand? A study was conducted to see if an advertisement campaign would increase market share for Sanka instant decaffeinated coffee (R. Grover and V.Srinivasan, J. Marketing Research, vol. 24, 1987, pp. 139–153). Subjects who use instant decaffeinated coffee were asked which
10.48 Sampling distribution of x1 - x2 Refer to Example 12, which compared two groups of seven dogs each in terms of their time interacting with their owners. The following graph shows a smoothed version of the sampling distribution of x1 - x2 derived from the permutation approach. Superimposed (in
10.47 Dominance of politicians For a rating experiment, researchers translated short video clips of randomly selected speeches by 30 male and 30 female politicians into animated, gender-neutral stick-figures. These animated sequences were rated (on a scale from −100 to 100) by a panel of students
10.129 Describe two limitations of the study, as explained in the sections titled “Representativeness of the sample” and“Limitations of the study.”Medical research makes frequent use of statistical methods shown in this chapter. At British Medical Journal (BMJ) bmj.com on the Internet, pull
What were the primary conclusions of the study?Medical research makes frequent use of statistical methods shown in this chapter. At British Medical Journal (BMJ) bmj.com on the Internet, pull up the April 19, 2003, issue. Browse through the article titled “Behavioural counseling to increase
According to Table 2, at the baseline for the nutrition counseling group, the proportion of subjects who ate at least five portions a day of fruits and vegetables was 0.267, and this increased by 0.287 over the 12 months. Report and interpret the 95% confidence interval for the change in the true
j Adjusted for confounding variables, the difference between the change in the mean for the behavioral counseling group and the nutrition counseling group was 0.62. Report and interpret the 95% confidence interval for the true difference and report the P-value for testing that the difference was
According to Table 2 in the article, the 135 subjects in the nutrition counseling group had a baseline mean of 3.67 and standard deviation of 2.00 for the number of portions per day they ate of fruits and vegetables. Over the 12 months of the study, the mean increased by 0.99. Report the 95%
Identify response and explanatory variables.Medical research makes frequent use of statistical methods shown in this chapter. At British Medical Journal (BMJ) bmj.com on the Internet, pull up the April 19, 2003, issue. Browse through the article titled “Behavioural counseling to increase
Was the study experimental or observational? Summarize the design and the subjects used in the study.Medical research makes frequent use of statistical methods shown in this chapter. At British Medical Journal (BMJ) bmj.com on the Internet, pull up the April 19, 2003, issue. Browse through the
What was the objective of the study?Medical research makes frequent use of statistical methods shown in this chapter. At British Medical Journal (BMJ) bmj.com on the Internet, pull up the April 19, 2003, issue. Browse through the article titled “Behavioural counseling to increase consumption of
Reading the medical literature Refer to Activity 2,which follows, about reading an article in a medical journal. Your instructor will pick a recent article at the website for the British Medical Journal. Prepare a short report in which you summarize the main conclusions of the article and explain
10.126 Symmetry of permutation distribution Refer to Example 12, which compared two groups of seven dogs each in terms of their time interacting with their owners.Figure 10.10 showed the sampling distribution by considering all possible permutations. When n1 = n2, as here, explain why the
10.125 Small-sample CI The small-sample confidence interval for comparing two proportions is a simple adjustment of the large-sample one. Recall that for a small-sample confidence interval for a single proportion, we used the ordinary formula after adding four observations, two of each type (see
10.124 Gap between rich and poor: 32>n margina. For comparisons of groups in which n1 = n2, with common value denoted by n, use the fact that the largest possible value of pn 11 - pn 2 occurs at pn = 0.5 to show that the margin of error for a large-sample 95% confidence interval for 1p1 - p22 can
10.122 Guessing on a test A test consists of 100 true-false questions.Joe did not study, and on each question he randomly guesses the correct response. Jane studied a little and has a 0.60 chance of a correct response for each question.a. Approximate the probability that Jane’s score is
10.121 True or false: Control for clinic Suppose there is a higher percentage of successes with Treatment A than with Treatment B at a clinic in Rochester, and there is a higher percentage of successes with Treatment A than with Treatment B at a clinic in Syracuse. For the overall sample (combining
10.120 True or false: Afford food? A 2013 survey by the Pew Research Center asked whether there have been times in the past year the respondent has been unable to afford food. Of advanced economies, the country with the second highest response was the United States, 24%.Worldwide, the highest
10.119 True or false: Positive values in CI If a 95% confidence interval for 1m1 - m22 contains only positive numbers, then we can conclude that both m1 and m2 are positive.
10.118 Multiple choice: Sample size and significance If the sample proportions in Example 4 comparing cancer death rates for aspirin and placebo had sample sizes of only 1000 each, rather than about 11,000 each, then the 95% confidence interval for 1p1 - p22 would be 1 -0.007, 0.0212 rather than
10.117 Multiple choice: Comparing mean incomes A study compares the population mean annual incomes for Hispanics 1m12 and for whites 1m22 having jobs in construction, using a 95% confidence interval for m1 - m2.Choose the best correct choice.a. If the confidence interval is 1 -6000, -30002, then at
10.116 Multiple choice: Alcoholism and gender Suppose that a 99% confidence interval for the difference p1 - p2 between the proportions of men and women in California who are alcoholics equals (0.02, 0.09). Choose the best correct choice.a. We are 99% confident that the proportion of alcoholics is
10.115 Obesity and earnings An AP story (April 9, 2005) with headline Study: Attractive People Make More stated that “A study concerning weight showed that women who were obese earned 17 percent lower wages than women of average weight.”a. Identify the two variables stated to have an
10.114 Treating math anxiety Two new programs were recently proposed at the University of Florida for treating students who suffer from math anxiety. Program A provides counseling sessions, one session a week for six weeks. Program B supplements the counseling sessions with short quizzes that are
10.113 Mean of permutation distribution Refer to Example 11, which compared two doses of a medication in terms of the number of symptom-free days, using a permutation approach. Table 10.13 and Figure 10.9 showed the sampling distribution of the difference in sample means between the two doses. If
10.112 Pay discrimination against women? A Time Magazine article titled “Wal-Mart’s Gender Gap” (July 5, 2004)stated that in 2001 women managers at Wal-Mart earned $14,500 less than their male counterparts.a. If these data are based on a random sample of managers at Wal-Mart, what more would
10.110 Review the medical literature Your instructor will pick a medical topic of interest to the class. Find a recent article of a medical journal that reports results of a research study on that topic. Describe the statistical analyses that were used in that article. Did the article use (a)
10.109 Student survey Refer to the FL Student Survey data file on the book’s website. Using software, prepare a short report summarizing the use of confidence intervals and significance tests (including checking assumptions)to compare males and females in terms of opinions about whether there is
10.108 Income and gender For a particular Big Ten university, the mean income for male faculty is $8000 higher than the mean income for female faculty. Explain how this difference could disappear:a. Controlling for number of years since received highest degree. (Hint: What if relatively few female
10.107 Death rate paradoxes The crude death rate is the number of deaths in a year, per size of the population, multiplied by 1000.a. According to the U.S. Bureau of the Census, in 1995 Mexico had a crude death rate of 4.6 (i.e., 4.6 deaths per 1000 population) while the United States had a crude
10.105 Belief in ghosts and in astrology A poll by Louis Harris and Associates of 1249 Americans indicated that 36% believe in ghosts and 37% believe in astrology.a. Is it valid to compare the proportions using inferential methods for independent samples? Explain.b. Do you have enough information
10.100 Breast augmentation and self-esteem A researcher in the College of Nursing, University of Florida, hypothesized that women who undergo breast augmentation surgery would gain an increase in self-esteem.The article about the study15 indicated that for the 84 subjects who volunteered for the
10.99 CI versus test Consider the results from the previous exercise.a. Construct a 95% confidence interval to compare the population means.b. Explain what you learn from the confidence interval that you do not learn from the significance test.
10.98 Effect of alcoholic parents A study14 compared personality characteristics between 49 children of alcoholics and a control group of 49 children of nonalcoholics who were matched on age and gender. On a measure of well-being, the 49 children of alcoholics had a mean of 26.1 1s = 7.22 and the
10.97 Which tire is better? A tire manufacturer believes that a new tire it is introducing (Brand A) will have longer wear than the comparable tire (Brand B) sold by its main competitor.To get evidence to back up its claim in planned advertising, the manufacturer conducts a study. On each of four
10.96 Improving employee evaluations Each of a random sample of 10 customer service representatives from a large department store chain answers a questionnaire about how they respond to various customer complaints.Based on the responses, a summary score measures how positively the employees react
10.95 Australian cell phone use In Western Australia, handheld cell phone use while driving has been banned since 2001, but hands-free devices are legal. A study (published in the British Medical Journal in 2005) of 456 drivers in Perth who had been in a crash observed if they were using a cell
10.94 Breast-feeding helps IQ? A Danish study of individuals born at a Copenhagen hospital between 1959 and 1961 reported higher mean IQ scores for adults who were breast-fed for longer lengths of time as babies(E. Mortensen et al., JAMA, vol. 287, 2002, pp. 2365–2371).The mean IQ score was 98.1
10.92 More knee pain Refer to the previous exercise.Compare the placebo to the debridement group using a significance test. State the assumptions and explain how to interpret the P-value.
10.90 Equal pay in sports? The following data refer to a random sample of prize money earned by male and female skiers racing in the 2014/2015 FIS world cup season (in Swiss Franc).Males: 89000, 179000, 8820, 12000, 10750, 66000, 6700, 3300, 74000, 56800 Females: 73000, 95000, 32400, 4000, 2000,
10.88 Car bumper damage An automobile company compares two types of front bumpers for its new model by driving sample cars into a concrete wall at 20 miles per hour. The response is the amount of damage to the car, as measured by the repair costs, in hundreds of dollars.Due to the costs, the study
Showing 1400 - 1500
of 6613
First
8
9
10
11
12
13
14
15
16
17
18
19
20
21
22
Last
Step by Step Answers