New Semester
Started
Get
50% OFF
Study Help!
--h --m --s
Claim Now
Question Answers
Textbooks
Find textbooks, questions and answers
Oops, something went wrong!
Change your search query and then try again
S
Books
FREE
Study Help
Expert Questions
Accounting
General Management
Mathematics
Finance
Organizational Behaviour
Law
Physics
Operating System
Management Leadership
Sociology
Programming
Marketing
Database
Computer Network
Economics
Textbooks Solutions
Accounting
Managerial Accounting
Management Leadership
Cost Accounting
Statistics
Business Law
Corporate Finance
Finance
Economics
Auditing
Tutors
Online Tutors
Find a Tutor
Hire a Tutor
Become a Tutor
AI Tutor
AI Study Planner
NEW
Sell Books
Search
Search
Sign In
Register
study help
business
statistics alive
Introduction To Probability And Statistics 15th Edition William Mendenhall Iii , Robert Beaver , Barbara Beaver - Solutions
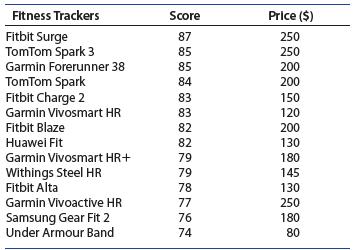
15. Fitness Trackers You can monitor every step you take, your speed, your pace, or some other aspect of your daily activity. The data that follows lists the overall rating scores for 14 fitness trackers and their pricesa. Use a scatterplot to check for a relationship between the rating scores and
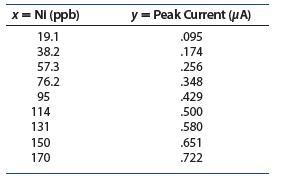
16. Peak Current A chemist measured the peak current generated (in microamperes)when a solution containing a given amount of nickel (in parts per billion) is added to a buffer. The data are shown here:Use a graph to describe the relationship between x and y.Add any numerical descriptive measures
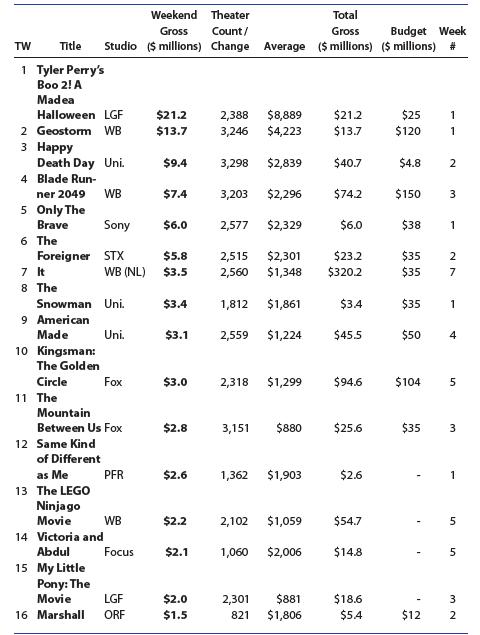
17. Movie Money Does the amount of money a movie makes on a single weekend in any way predict the movie’s success or failure? Or is a movie’s monetary success more dependent on the number of weeks the movie remains in movie theaters? The following data was collected for the top 16 movies in
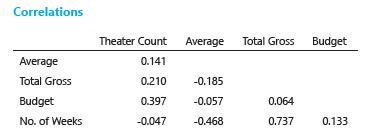
18. Movie Money, continued The data from Exercise 17 were entered into a MINITAB worksheet and the following correlations were calculatedDoes the table of correlations confirm your insights and/or provide further information regarding the relationships among these variables? Summarize your
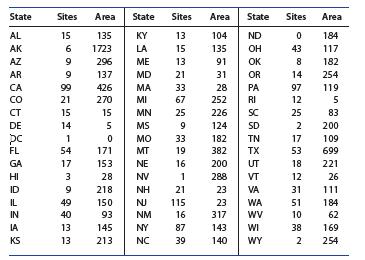
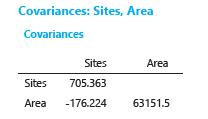
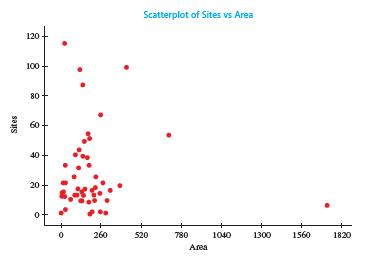
19. Hazardous Waste The number of hazardous waste sites in each of the 50 states and the District of Columbia in 2016 are shown in the following table.10 Researchers also recorded the size of the state (in thousands of square kilometers) and generated a scatterplot of the data.a. Use the
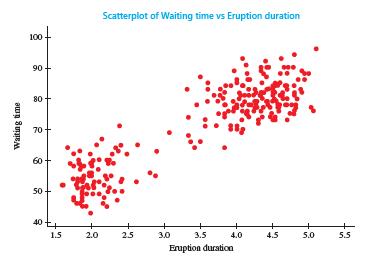
20. Old Faithful The Old Faithful geyser is not the tallest geyser nor the largest geyser in Yellowstone National Park, but it is the most reliable. The graph that follows is based on n 5 272 pairs of Old Faithful data on eruption duration (x) and waiting time until the next eruption (y).11 What
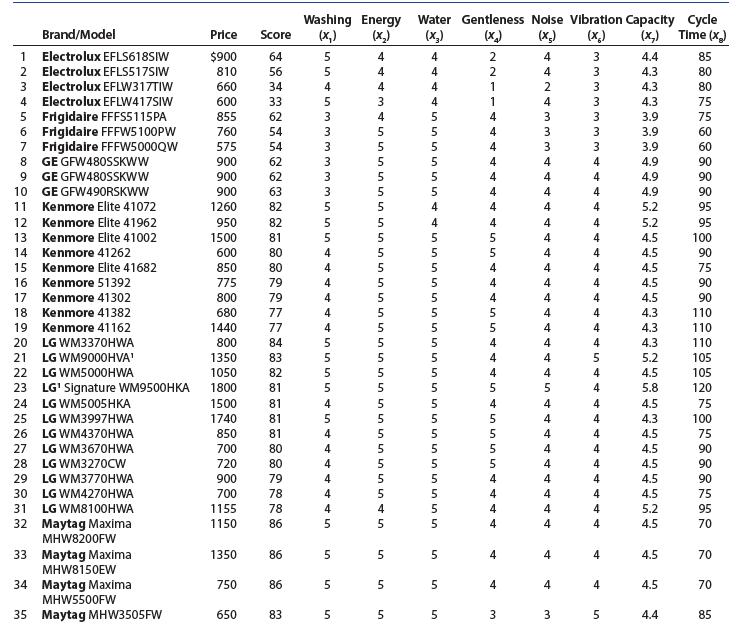
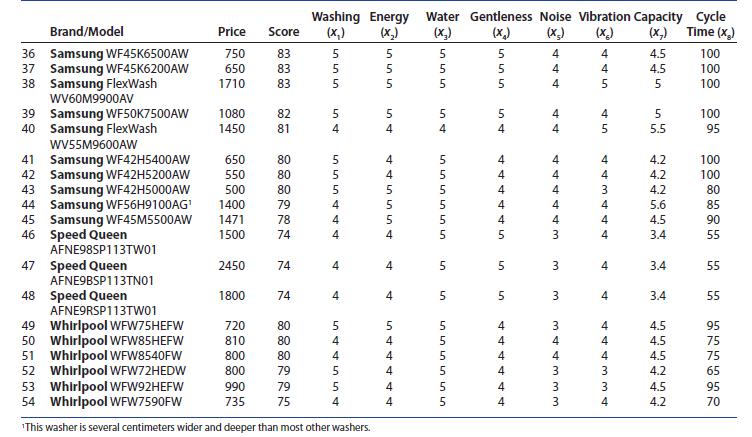
1. Look at the variables Price, Score, and Cycle Time individually. What can you say about symmetry? About outliers?Does the price of an appliance convey something about its quality?Washers are classified as top-load high efficiency (HE), top-load agitator, and front-load washers. The best
2. Look at all the variables in pairs. Which pairs are positively correlated? Negatively correlated? Are there any pairs that exhibit little or no correlation? Are some of these results counterintuitive?Does the price of an appliance convey something about its quality?Washers are classified as
3. Does the price of an appliance, specifically a washing machine, convey something about its quality? Which variables did you use in arriving at your answer?Does the price of an appliance convey something about its quality?Washers are classified as top-load high efficiency (HE), top-load agitator,
Draw a dotplot for the n55 measurements 2, 9, 11, 5, 6. Find the sample mean and compare its value with what you might consider the “center” of these observations on the dotplot.
Find the median for the set of measurements 2, 9, 11, 5, 6.
Find the median for the set of measurements 2, 9, 11, 5, 6, 27.
For the n55 ordered measurements from Example 2.2, the position of the median is .5(n1)5.5(6)53, and the median is the 3rd ordered observation, or m56.For the n56 ordered measurements from Example 2.3, the position of the median is.5(n1)5.5(7)53.5, and the median is the average of the 3rd and
For the data sets calculate the mean, the median, and the mode. Locate these measures on a dotplot.1. n=5 measurements: 0, 5, 1, 1, 3
For the data sets calculate the mean, the median, and the mode. Locate these measures on a dotplot.2. n=8 measurements: 3, 2, 5, 6, 4, 4, 3, 5
For the data sets calculate the mean, the median, and the mode. Locate these measures on a dotplot.3. n=10 measurements: 3, 5, 4, 5, 10, 5, 6, 9, 2, 8
For the data sets calculate the mean, the median, and the mode. Locate these measures on a dotplot.4. n=7 measurements: 3, 6, 4, 0, 3, 5, 2
Based on the values of the mean and the median, decide whether the data set is skewed right, skewed left, or approximately symmetric 5. x 6.2; m=10
Based on the values of the mean and the median, decide whether the data set is skewed right, skewed left, or approximately symmetric 6. x 5.38; m = 5.34
Based on the values of the mean and the median, decide whether the data set is skewed right, skewed left, or approximately symmetric 7. x 127.5; m =58.4
Based on the values of the mean and the median, decide whether the data set is skewed right, skewed left, or approximately symmetric 8. 279, m = 350
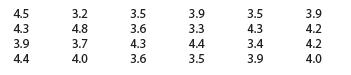
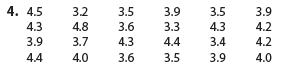
Use these n524 measurements to answer the question9. Find the sample mean and median. 4.5 7727 3.2 3.5 3.9 3.5 3.9 4.3 4.8 3.9 3.7 4.4 4.0 ** 3.6 3.3 4.3 4.2 4.3 4.4 3.4 4.2 3.6 3.5 3.9 4.0
Use these n524 measurements to answer the question10. Is the data set symmetric or skewed? Explain. 4.5 7727 3.2 3.5 3.9 3.5 3.9 4.3 4.8 3.9 3.7 4.4 4.0 ** 3.6 3.3 4.3 4.2 4.3 4.4 3.4 4.2 3.6 3.5 3.9 4.0
11. Calculate x , m, and the mode. 53, 61, 58, 56, 58, 60, 54, 54, 62, 58, 60, 58, 56, 56, 58
12. Are the data skewed right, skewed left, or symmetric?Draw a dotplot to confirm your answer. 53, 61, 58, 56, 58, 60, 54, 54, 62, 58, 60, 58, 56, 56, 58
For the data sets find the mean, the median, and the mode. Comment on the skewness or symmetry of the data.13. Tuna Fish The following data give the estimated prices of a 170-gram can or a 200-gram pouch of water-packed tuna for 14 different brands, based on prices paid nationally in supermarkets
For the data sets find the mean, the median, and the mode. Comment on the skewness or symmetry of the data.14. Smiles per Mile A survey by Consumer Reports looked at the reliability of cars as the cars get older. They surveyed owners of cars that were 3 years old, and recorded the average yearly
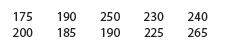
For the data sets find the mean, the median, and the mode. Comment on the skewness or symmetry of the data.15. Time on Task In a psychology experiment, 10 subjects were given 5 minutes to complete a task. Their time on task (in seconds) is recorded. 175 190 250 230 240 200 185 190 225 265
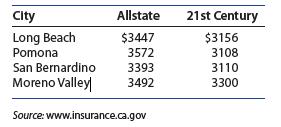
16. Auto Insurance The cost of auto insurance in California is dependent on many variables, such as the city you live in, the number of cars you insure, and your insurance company. The website www.insurance.ca.gov reports the annual 2017 standard premium for a male, licensed for 6–8 years, who
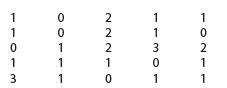
17. DVRs Most American households have one digital video recorder (DVR), and many have more than one. A sample of 25 households produced the following measurements on x, the number of DVRs in the household:a. Is the distribution of x, the number of DVRs in a household, symmetric or skewed?
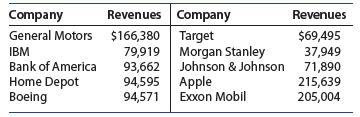
18. Fortune 500 Revenues Ten of the 50 largest businesses in the United States, randomly selected from the Fortune 500, are listed as follows along with their revenues (in millions of dollars)4:a. Draw a stem and leaf plot for the data. Are the data skewed?b. Calculate the mean revenue for these 10
19. Birth Order and Personality Does birth order have any effect on a person’s personality? A report on a study by an MIT researcher indicates that later-born children are more likely to challenge the establishment, more open to new ideas, and more accepting of change.5 In fact, the number of
20. Sports Salaries As professional sports teams become more and more profitable, the salaries paid to the players have also increased. In fact, many sports superstars are paid huge salaries. If you were asked to describe the distribution of players’ salaries for several different professional
21. The Cost of College The tuition and fees (in thousands of dollars) for a sample of 21 four-year state-run colleges and universities are shown in the following tablea. Find the mean, the median, and the mode.b. Compare the median and the mean. What can you say about the shape of this
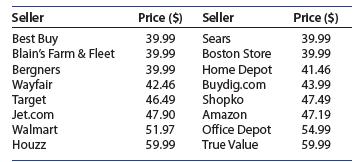
22. Comparative Shopping Searching online for the price of an item you would like to buy can save you quite a bit of money. A search for the best price for a white KitchenAid 5-speed hand mixer using yroo.com lists 16 sellers with various prices found in the following tablea. What is the average
Calculate the variance and standard deviation for the five measurements from Table 2.2–5, 7, 1, 2, 4–reproduced in Table 2.3. Use the computing formula for s2 and compare your results with those obtained using the original definition of s2.
For the data set, calculate the sample variance, s2, using (1) the definition formula and (2) the computing formula. Then calculate the sample standard deviation, s.1. n=5 measurements: 2,1,1, 3, 5
For the data set, calculate the sample variance, s2, using (1) the definition formula and (2) the computing formula. Then calculate the sample standard deviation, s.2. n=8 measurements: 4,1, 3,1, 3,1, 2, 2
For the data set, calculate the sample variance, s2, using (1) the definition formula and (2) the computing formula. Then calculate the sample standard deviation, s.3. n=8 measurements: 3,1, 5, 6, 4, 4, 3, 5
For the data set use the data entry method in your scientific calculator to enter the measurements. Recall the proper memories to find the mean and standard deviation.Calculate the range. The range is approximately how many standard deviations? 4. 4.5 3.2 3.5 3.9 3.5 3.9 4.3 4.8 3.6 3.3 4.3 4.2 3.9
For the data set use the data entry method in your scientific calculator to enter the measurements. Recall the proper memories to find the mean and standard deviation.Calculate the range. The range is approximately how many standard deviations?5. 53, 61, 58, 56, 58, 60, 54, 54, 62, 58, 60, 58, 56,
For the data set use the data entry method in your scientific calculator to enter the measurements. Recall the proper memories to find the mean and standard deviation.Calculate the range. The range is approximately how many standard deviations?6. n=10 measurements: 5, 2, 3, 6,1, 2, 4, 5,1, 3
For the data set, find the range, the sample variance and the sample standard deviation.7. Tuna Fish The following data give the estimated prices of a 170-gram can or a 200-gram pouch of water-packed tuna for 14 different brands, based on prices paid nationally in supermarkets .99 1.92 1.23 .85 .65
For the data set, find the range, the sample variance and the sample standard deviation.8. Smiles per Mile A survey by Consumer Reports looked at the reliability of cars as the cars get older. They surveyed owners of cars that were 3 years old, and recorded the average yearly repair and maintenance
For the data set, find the range, the sample variance and the sample standard deviation.9. Time on Task In a psychology experiment, 10 subjects were given 5 minutes to complete a task. Their time on task (in seconds) is recorded. 175 190 250 230 240 200 185 190 225 265
10. An Archeological Find, again An article in Archaeometry described 26 samples of pottery found at four different kiln sites in the United Kingdom.8 The percentage of iron oxide in each of five samples collected at the Island Thorns site was as follows:a. Calculate the range.b. Calculate the
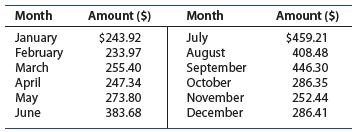
11. Utility Bills in Southern California The monthly utility bills for a household in Riverside, California, were recorded for 12 consecutive months starting in January 2017:a. Calculate the range of the utility bills for the year.b. Calculate the average monthly utility bill for the year.c.
12. Sleep and the College Student A group of 10 college students were asked to report how many hours that they slept on the previous night with the following results:a. Find the mean and the standard deviation of the number of hours of sleep for these 10 students.b. What is the most frequently
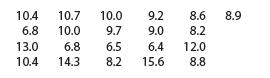
13. Gas Mileage The kilometers per liter (km/L)for each of 20 medium-sized cars selected from a production line during the month of March follow.a. What are the maximum and minimum kilometers per liter? What is the range?b. Construct a relative frequency histogram for these data. How would you
14. Polluted Seawater Petroleum pollution in seas and oceans stimulates the growth of some types of bacteria.A count of the number of bacteria (per 100 milliliters) in 10 portions of seawater gave these readings:49, 70, 54, 67, 59, 40, 61, 69, 71, 52a. Calculate the range.b. Calculate x and s.c.
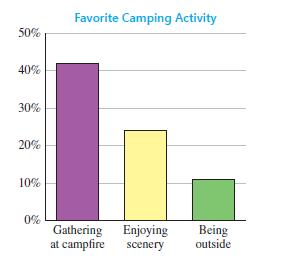
15. Summer Camping A favorite summer pastime for many Americans is camping. In fact, camping has become so popular at the California beaches that reservations must be made months in advance! Data from a USA Today snapshot is shown here.The snapshot also reports that men go camping 2.9 times a year,
The mean and variance of a sample of n525 measurements are 75 and 100, respectively. Use Tchebysheff’s Theorem to describe the measurements
In a study conducted at a manufacturing plant, the length of time to complete a specified operation is measured for each of n=40 workers. The mean and standard deviation are found to be 12.8 and 1.7, respectively. Describe the sample data using the Empirical Rule
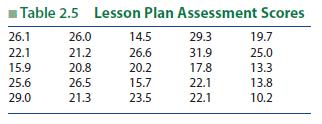
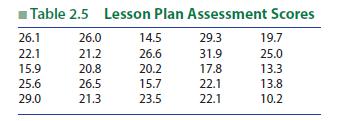
Student teachers learn to write lesson plans that will help them to be more successful in the classroom. To study the effectiveness of written lesson plans, 25 plans were scored on a scale of 0 to 34 according to a Lesson Plan Assessment Checklist. The 25 scores are shown in Table 2.5. Use
Use the range approximation to check the calculation of s for Table 2.3. Table 2.3 Table for Simplified Calculation of s and s x, x 5112 25 225 49 1 4 4 16 95=Ex . =19
Use the range to approximate the standard deviation for the data in Table 2.5. Table 2.5 Lesson Plan Assessment Scores 26.1 26.0 14.5 29.3 19.7 22.1 21.2 26.6 31.9 25.0 15.9 20.8 20.2 17.8 13.3 25.6 26.5 15.7 22.1 13.8 29.0 21.3 23.5 22.1 10.2
For the data set use the range to approximate the value of s. Then calculate the actual value of s. Is the actual value close to the estimate? 1. n 10 measurements: 5, 2, 3, 6, 1, 2, 4, 5, 1, 3
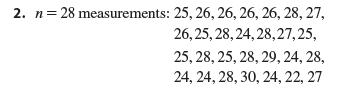
For the data set use the range to approximate the value of s. Then calculate the actual value of s. Is the actual value close to the estimate? 2. n = 28 measurements: 25, 26, 26, 26, 26, 28, 27, 26, 25, 28, 24, 28,27,25, 25, 28, 25, 28, 29, 24, 28, 24, 24, 28, 30, 24, 22, 27
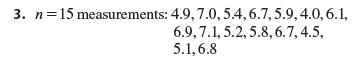
For the data set use the range to approximate the value of s. Then calculate the actual value of s. Is the actual value close to the estimate? 3. n 15 measurements: 4.9, 7.0, 5.4, 6.7, 5.9, 4.0, 6.1, 6.9, 7.1, 5.2, 5.8, 6.7, 4.5, 5.1,6.8
Draw a dotplot for the data set. Are the data mound-shaped?Can you use Tchebysheff’s Theorem to describe the data?The Empirical Rule? Explain. 4. n=10 measurements: 5, 2, 3, 6, 1, 2, 4, 5, 1, 3
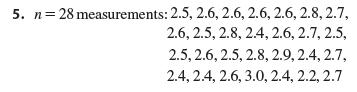
Draw a dotplot for the data set. Are the data mound-shaped?Can you use Tchebysheff’s Theorem to describe the data?The Empirical Rule? Explain. 5. n 28 measurements: 2.5, 2.6, 2.6, 2.6, 2.6, 2.8, 2.7, 2.6, 2.5, 2.8, 2.4, 2.6, 2.7, 2.5, 2.5, 2.6, 2.5, 2.8, 2.9, 2.4, 2.7, 2.4, 2.4, 2.6, 3.0, 2.4,
A distribution of measurements is relatively mound-shaped with a mean of 50 and a standard deviation of 10. Use this information to find the proportion of measurements in the intervals given 6. Between 40 and 60
A distribution of measurements is relatively mound-shaped with a mean of 50 and a standard deviation of 10. Use this information to find the proportion of measurements in the intervals given 7. Between 30 and 70
A distribution of measurements is relatively mound-shaped with a mean of 50 and a standard deviation of 10. Use this information to find the proportion of measurements in the intervals given 8. Between 30 and 60
A distribution of measurements is relatively mound-shaped with a mean of 50 and a standard deviation of 10. Use this information to find the proportion of measurements in the intervals given 9. Greater than 60
A distribution of measurements is relatively mound-shaped with a mean of 50 and a standard deviation of 10. Use this information to find the proportion of measurements in the intervals given 10. Less than 60
A distribution of measurements is relatively mound-shaped with a mean of 50 and a standard deviation of 10. Use this information to find the proportion of measurements in the intervals given 11. 40 or more
distribution of measurements has a mean of 75 and a standard deviation of 5. You know nothing else about the size or shape of the data. Use this information to find the proportion of measurements in the intervals given 12. Between 60 and 90
distribution of measurements has a mean of 75 and a standard deviation of 5. You know nothing else about the size or shape of the data. Use this information to find the proportion of measurements in the intervals given 13. Between 65 and 85
distribution of measurements has a mean of 75 and a standard deviation of 5. You know nothing else about the size or shape of the data. Use this information to find the proportion of measurements in the intervals given 14. Between 62.5 and 87.5
For the data set find the range and use it to approximate the value of s. Then calculate the actual value of s. Is the actual value close to the estimate?15. Driving Emergencies The length of time it takes for a driver to respond to a particular emergency situation was recorded for 10 drivers. The
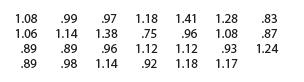
For the data set find the range and use it to approximate the value of s. Then calculate the actual value of s. Is the actual value close to the estimate?16. Tuna Fish The following data give the estimated prices of a 170-gram can or a 200-gram pouch of water-packed tuna for 14 different brands,
For the data set find the range and use it to approximate the value of s. Then calculate the actual value of s. Is the actual value close to the estimate?Smiles per Mile A survey by Consumer Reports looked at the reliability of cars as the cars get older. They surveyed owners of cars that were 3
For the data set find the range and use it to approximate the value of s. Then calculate the actual value of s. Is the actual value close to the estimate?18. An Archeological Find, again The percentage of iron oxide in each of five pottery samples collected at the Island Thorns site in the United
19. Packaging Hamburger Meat The weights(in pounds) of 27 packages of ground beef in a supermarket meat display are as follows:a. Draw a stem and leaf plot or a relative frequency histogram to display the weights. Is the distribution relatively mound-shaped?b. Find the mean and the standard
20. Breathing Rates Breathing rates for humans can be as low as 4 breaths per minute or as high as 70 or 75 for a person doing strenuous exercise. Suppose that the resting breathing rates for college-age students have a distribution that is mound-shaped, with a mean of 12 and a standard deviation
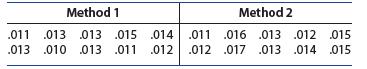
21. Ore Samples A geologist collected 20 different ore samples of equal weight and randomly divided them into two groups. She measured the titanium (Ti) content of the samples using two different methods.a. Draw stem and leaf plots for the two data sets. Visually compare their centers and their
22. Social Security Numbers A group of 70 students were asked to record the last digit of their social security number.a. Draw a relative frequency histogram using the values 0 through 9 as the class midpoints.b. What is the shape of the distribution? Based on the shape, what would be your best
23. Social Security Numbers, continued Refer to the data set in Exercise 22.a. Find the percentage of measurements in the intervals x 6s, x 62s, and x 63s.b. How do the percentages obtained in part a compare with those given by the Empirical Rule? Should they be approximately the same? Explain.
24. Survival Times A group of laboratory animals is infected with a particular form of bacteria. Their survival times are found to average 32 days, with a standard deviation of 36 days.a. Think about the distribution of survival times. Do you think that the distribution is relatively moundshaped,
25. Survival Times, continued Refer to Exercise 24.Use the Empirical Rule to see why the distribution of survival times could not be mound-shaped.a. Find the value of x that is exactly one standard deviation below the mean.b. If the distribution is in fact mound-shaped, approximately what
26. Timber Tracts To estimate the amount of lumber in a tract of timber, an owner randomly selected seventy 15-by-15-meter squares, and counted the number of trees with diameters exceeding 1 meter in each square. The data are listed here:a. Construct a relative frequency histogram to describe the
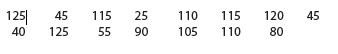
27. Old Faithful The data that follow are 30 waiting times between eruptions of the Old Faithful geyser in Yellowstone National Parka. Calculate the range.b. Use the range approximation to approximate the standard deviation of these 30 measurements.c. Calculate the sample standard deviation s.d.
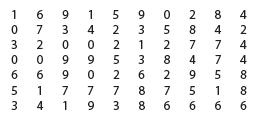
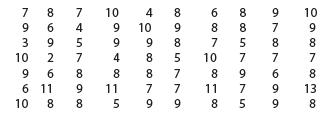
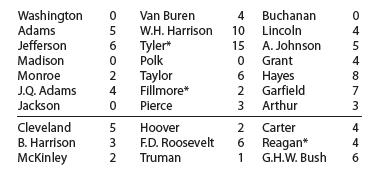
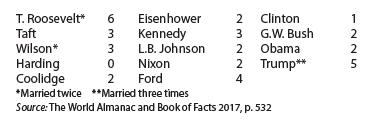
28. The President’s Kids The following table shows the names of the 44 presidents of the United States along with the number of their childrena. Construct a relative frequency histogram to describe the data. How would you describe the shape of this distribution?b. Calculate the mean and the
29. Drew Brees The number of passes completed by Drew Brees, quarterback for the New Orleans Saints, was recorded for each of the 16 regular season games in the fall of 2017 (www.ESPN.com)a. Draw a stem and leaf plot to describe the data.b. Calculate the mean and the standard deviation for Drew
30. Achievement Tests Mathematics achievement test scores for 400 students had a mean and a variance equal to 600 and 4,900, respectively. If the distribution of test scores was mound-shaped, approximately how many scores would fall in the interval 530 to 670? Approximately how many scores would
31. Basketball Attendances at a high school’s basketball games were recorded and found to have a sample mean and variance of 420 and 25, respectively. Calculate x 6s, x 62s, and x 63s. What fraction of measurements would you expect to fall into these intervals according to the Empirical Rule?
32. TV Commercials The mean duration of television commercials on a given network is 75 seconds, with a standard deviation of 20 seconds. Assume that durations are approximately normally distributed.a. What is the approximate probability that a commercial will last less than 35 seconds?b. What is
A student has taken a 35-point exam and wants to know how his score of 30 compares to the scores of the other students in the class. The mean and standard deviation of the exam scores are 25 and 4, respectively. Calculate the z-score for this student’s score.
Consider this sample of n510 measurements:1, 1, 0,15, 2, 3, 4, 0,1, 3 The measurement x515 appears to be unusually large. Calculate the z-score and state your conclusions.
Two students are preparing for college admissions by taking college preparatory exams. One student takes the SAT test and scores 1440 out of 1600 while the other takes the ACT test and scores 31 out of 36. Which student has performed better on the exam?
Suppose you have been notified that your score of 158 on the Verbal Graduate Record Examination placed you at the 80th percentile in the distribution of scores. Where does your score of 158 stand in relation to the scores of others who took the examination?
Find the lower and upper quartiles for this set of measurements:16, 25, 4,18,11,13, 20, 8,11, 9
As American consumers become more careful about the foods they eat, food processors try to avoid large amounts of fat, cholesterol, and sodium in the foods they sell. The following data are the amounts of sodium per slice (in milligrams) for each of eight brands of regular American cheese. Draw a
For the data set find the mean, the standard deviation, and the z-scores corresponding to the minimum and maximum in the data set. Do the z-scores indicate that there are possible outliers in these data sets?2. n=11 measurements: 2.3,1.0, 2.1, 6.5, 2.8, 7.8, 1.7, 2.9, 4.4, 5.1, 2.0
For the data set find the mean, the standard deviation, and the z-scores corresponding to the minimum and maximum in the data set. Do the z-scores indicate that there are possible outliers in these data sets?1. n=12 measurements: 8, 7,1, 4, 6, 6, 4, 5, 7, 6, 3, 0
For the data set find the mean, the standard deviation, and the z-scores corresponding to the minimum and maximum in the data set. Do the z-scores indicate that there are possible outliers in these data sets?n=13 measurements: 3, 9,10, 2, 6, 7, 5,8, 6, 6, 4, 9, 25
calculate the median and the upper and lower quartiles 4. n=7 measurements: 6, 7, 3, 2,8,10, 4
calculate the median and the upper and lower quartiles 5. n=9 measurements: 5, 6, 0, 2, 5,1, 7, 6, 3
calculate the median and the upper and lower quartiles 6. n=6 measurements: 1, 7, 4, 5, 2, 9
Showing 3700 - 3800
of 6613
First
31
32
33
34
35
36
37
38
39
40
41
42
43
44
45
Last
Step by Step Answers