New Semester
Started
Get
50% OFF
Study Help!
--h --m --s
Claim Now
Question Answers
Textbooks
Find textbooks, questions and answers
Oops, something went wrong!
Change your search query and then try again
S
Books
FREE
Study Help
Expert Questions
Accounting
General Management
Mathematics
Finance
Organizational Behaviour
Law
Physics
Operating System
Management Leadership
Sociology
Programming
Marketing
Database
Computer Network
Economics
Textbooks Solutions
Accounting
Managerial Accounting
Management Leadership
Cost Accounting
Statistics
Business Law
Corporate Finance
Finance
Economics
Auditing
Tutors
Online Tutors
Find a Tutor
Hire a Tutor
Become a Tutor
AI Tutor
AI Study Planner
NEW
Sell Books
Search
Search
Sign In
Register
study help
business
statistics alive
Understandable Statistics Concepts And Methods 13th Edition Charles Henry Brase, Corrinne Pellillo Brase - Solutions
Find z such that 6% of the standard normal curve lies to the left of z.In Problems 15–24, find the z value described and sketch the area described.AppendixLO1
P(x $ 2); m 5 3; s 5 0.25 In Problems 5–14, assume that x has a normal distribution with the specified mean and standard deviation. Find the indicated probabilities.AppendixLO1
P(x $ 90); m 5100; s 515 In Problems 5–14, assume that x has a normal distribution with the specified mean and standard deviation. Find the indicated probabilities.AppendixLO1
P(x $ 120); m 5100; s 515 In Problems 5–14, assume that x has a normal distribution with the specified mean and standard deviation. Find the indicated probabilities.AppendixLO1
P(x $ 30); m 5 20; s 5 3.4 In Problems 5–14, assume that x has a normal distribution with the specified mean and standard deviation. Find the indicated probabilities.AppendixLO1
P(40 # x # 47); m 5 50; s 515 In Problems 5–14, assume that x has a normal distribution with the specified mean and standard deviation. Find the indicated probabilities.AppendixLO1
P(8 # x # 12); m 515; s 5 3.2 In Problems 5–14, assume that x has a normal distribution with the specified mean and standard deviation. Find the indicated probabilities.AppendixLO1
P(7 # x # 9); m 5 5; s 51.2 In Problems 5–14, assume that x has a normal distribution with the specified mean and standard deviation. Find the indicated probabilities.AppendixLO1
P(50 # x # 70); m 5 40; s 515 In Problems 5–14, assume that x has a normal distribution with the specified mean and standard deviation. Find the indicated probabilities.AppendixLO1
P(10 # x # 26); m 515; s 5 4 In Problems 5–14, assume that x has a normal distribution with the specified mean and standard deviation. Find the indicated probabilities.AppendixLO1
P(3 # x # 6); m 5 4; s 5 2 In Problems 5–14, assume that x has a normal distribution with the specified mean and standard deviation. Find the indicated probabilities.AppendixLO1
Statistical Literacy Suppose 5% of the area under the standard normal curve lies to the left of z. Is z positive or negative?AppendixLO1
Statistical Literacy Suppose 5% of the area under the standard normal curve lies to the right of z. Is z positive or negative?AppendixLO1
What is the probability a value selected at random from this distribution is greater than 30?AppendixLO1
Statistical Literacy Consider a normal distribution with mean 30 and standard deviation AppendixLO1
Assess whether given data come from an approximately normal distribution.AppendixLO1
Solve guarantee problems using the inverse normal distribution.AppendixLO1
Find a z score from a given normal probability (inverse normal).AppendixLO1
Compute the probability of standardized events.AppendixLO1
P(20.73 # z # 3.12)In Problems 31–50, let z be a random variable with a standard normal distribution.Find the indicated probability, and shade the corresponding area under the standard normal curve.AppendixLO1
P(20.45 # z # 2.73)In Problems 31–50, let z be a random variable with a standard normal distribution.Find the indicated probability, and shade the corresponding area under the standard normal curve.AppendixLO1
P(22.37 # z # 0)In Problems 31–50, let z be a random variable with a standard normal distribution.Find the indicated probability, and shade the corresponding area under the standard normal curve.AppendixLO1
P(20.82 # z # 0)In Problems 31–50, let z be a random variable with a standard normal distribution.Find the indicated probability, and shade the corresponding area under the standard normal curve.AppendixLO1
P(0 # z # 0.54)In Problems 31–50, let z be a random variable with a standard normal distribution.Find the indicated probability, and shade the corresponding area under the standard normal curve.AppendixLO1
P(0 # z # 1.62)In Problems 31–50, let z be a random variable with a standard normal distribution.Find the indicated probability, and shade the corresponding area under the standard normal curve.AppendixLO1
P(21.78 # z # 21.23)In Problems 31–50, let z be a random variable with a standard normal distribution.Find the indicated probability, and shade the corresponding area under the standard normal curve.AppendixLO1
P(22.18 # z # 20.42)In Problems 31–50, let z be a random variable with a standard normal distribution.Find the indicated probability, and shade the corresponding area under the standard normal curve.AppendixLO1
P(22.20 # z # 1.40)In Problems 31–50, let z be a random variable with a standard normal distribution.Find the indicated probability, and shade the corresponding area under the standard normal curve.AppendixLO1
P(21.20 # z # 2.64)In Problems 31–50, let z be a random variable with a standard normal distribution.Find the indicated probability, and shade the corresponding area under the standard normal curve.AppendixLO1
P(z $ 21.50)In Problems 31–50, let z be a random variable with a standard normal distribution.Find the indicated probability, and shade the corresponding area under the standard normal curve.AppendixLO1
P(z $ 21.20)In Problems 31–50, let z be a random variable with a standard normal distribution.Find the indicated probability, and shade the corresponding area under the standard normal curve.AppendixLO1
P(z $ 2.17)In Problems 31–50, let z be a random variable with a standard normal distribution.Find the indicated probability, and shade the corresponding area under the standard normal curve.AppendixLO1
P(z $ 1.35)In Problems 31–50, let z be a random variable with a standard normal distribution.Find the indicated probability, and shade the corresponding area under the standard normal curve.AppendixLO1
2. Would you like to travel in space, if given a chance? According to Opinion Research for Space Day Partners, if your answer is yes, you are not alone.Forty-four percent of adults surveyed agreed that they would travel in space if given a chance. Look at Figure 5-8, and use the information
P(z # 3.20)In Problems 31–50, let z be a random variable with a standard normal distribution.Find the indicated probability, and shade the corresponding area under the standard normal curve.AppendixLO1
P(z # 1.20)In Problems 31–50, let z be a random variable with a standard normal distribution.Find the indicated probability, and shade the corresponding area under the standard normal curve.AppendixLO1
P(z # 22.15)In Problems 31–50, let z be a random variable with a standard normal distribution.Find the indicated probability, and shade the corresponding area under the standard normal curve.AppendixLO1
P(z # 20.13)In Problems 31–50, let z be a random variable with a standard normal distribution.Find the indicated probability, and shade the corresponding area under the standard normal curve.AppendixLO1
P(z # 0)In Problems 31–50, let z be a random variable with a standard normal distribution.Find the indicated probability, and shade the corresponding area under the standard normal curve.AppendixLO1
Between z 521.98 and z 520.03 In Problems 13–30, sketch the areas under the standard normal curve over the indicated intervals and find the specified areas.AppendixLO1
Between z 522.42 and z 521.77 In Problems 13–30, sketch the areas under the standard normal curve over the indicated intervals and find the specified areas.AppendixLO1
Between z 51.42 and z 5 2.17 In Problems 13–30, sketch the areas under the standard normal curve over the indicated intervals and find the specified areas.AppendixLO1
Between z 5 0.32 and z 51.92 In Problems 13–30, sketch the areas under the standard normal curve over the indicated intervals and find the specified areas.AppendixLO1
Between z 521.40 and z 5 2.03 In Problems 13–30, sketch the areas under the standard normal curve over the indicated intervals and find the specified areas.AppendixLO1
Between z 522.18 and z 51.34 In Problems 13–30, sketch the areas under the standard normal curve over the indicated intervals and find the specified areas.AppendixLO1
Between z 5 0 and z 521.93 In Problems 13–30, sketch the areas under the standard normal curve over the indicated intervals and find the specified areas.AppendixLO1
Between z 5 0 and z 5 3.18 In Problems 13–30, sketch the areas under the standard normal curve over the indicated intervals and find the specified areas.AppendixLO1
To the right of z 522.17 In Problems 13–30, sketch the areas under the standard normal curve over the indicated intervals and find the specified areas.AppendixLO1
To the right of z 521.22 In Problems 13–30, sketch the areas under the standard normal curve over the indicated intervals and find the specified areas.AppendixLO1
To the right of z 5 0.15 In Problems 13–30, sketch the areas under the standard normal curve over the indicated intervals and find the specified areas.AppendixLO1
To the right of z 51.52 In Problems 13–30, sketch the areas under the standard normal curve over the indicated intervals and find the specified areas.AppendixLO1
To the left of z 5 0.72 In Problems 13–30, sketch the areas under the standard normal curve over the indicated intervals and find the specified areas.AppendixLO1
To the left of z 5 0.45 In Problems 13–30, sketch the areas under the standard normal curve over the indicated intervals and find the specified areas.AppendixLO1
To the left of z 520.47 In Problems 13–30, sketch the areas under the standard normal curve over the indicated intervals and find the specified areas.AppendixLO1
To the left of z 521.32 In Problems 13–30, sketch the areas under the standard normal curve over the indicated intervals and find the specified areas.AppendixLO1
To the left of z 5 0 In Problems 13–30, sketch the areas under the standard normal curve over the indicated intervals and find the specified areas.AppendixLO1
To the right of z 5 0 In Problems 13–30, sketch the areas under the standard normal curve over the indicated intervals and find the specified areas.AppendixLO1
Normal Curve: Tree Rings Tree-ring dates were used extensively in archaeological studies at Burnt Mesa Pueblo (Bandelier Archaeological Excavation.Project: Summer 1989 Excavations at Burnt Mesa Pueblo, edited by Kohler, Washington State University Department of Anthropology). At one site on the
z Scores: Red Blood Cell Count Let x 5red blood cell (RBC) count in millions per cubic millimeter of whole blood. For healthy females, x has an approximately normal distribution with mean m 5 4.8 and standard deviation s 5 0.3 (based on information from Diagnostic Tests with Nursing Implications,
z Scores: Fawns Fawns between 1 and 5 months old in Mesa Verde National Park have a body weight that is approximately normally distributed with mean m 5 27.2 kilograms and standard deviation s 5 4.3 kilograms (based on information from The Mule Deer of Mesa Verde National Park, by G. W. Mierau and
z Scores: First Aid Course The college physical education department offered an advanced first aid course last semester. The scores on the comprehensive final exam were normally distributed, and the z scores for some of the students are shown below:Robert, 1.10 Juan, 1.70 Susan, −2.00 Joel, 0.00
Critical Thinking Raul received a score of 80 on a history test for which the class mean was 70 with standard deviation 10. He received a score of 75 on a biology test for which the class mean was 70 with standard deviation 2.5. On which test did he do better relative to the rest of the
Critical Thinking Consider the following scores:(i) Score of 40 from a distribution with mean 50 and standard deviation 10(ii) Score of 45 from a distribution with mean 50 and standard deviation 5 How do the two scores compare relative to their respective distributions?AppendixLO1
Basic Computation: z Score and Raw Score A normal distribution has m 510 and s 5 2.(a) Find the z score corresponding to x 512.(b) Find the z score corresponding to x 5 4.(c) Find the raw score corresponding to z 51.5.(d) Find the raw score corresponding to z 521.2.AppendixLO1
Basic Computation: z Score and Raw Score A normal distribution has m 5 30 and s 5 5.(a) Find the z score corresponding to x 5 25.(b) Find the z score corresponding to x 5 42.(c) Find the raw score corresponding to z 522.(d) Find the raw score corresponding to z 51.3.AppendixLO1
Statistical Literacy What are the values of the mean and standard deviation of a standard normal distribution?AppendixLO1
Statistical Literacy What is the value of the standard score for the mean of a distribution?AppendixLO1
Statistical Literacy Does a raw score less than the mean correspond to a positive or negative standard score? What about a raw score greater than the mean?AppendixLO1
Statistical Literacy What does a standard score measure?AppendixLO1
Find areas under the standard normal curve.AppendixLO1
Graph the standard normal distribution.AppendixLO1
Given m and s , convert z scores to raw data.AppendixLO1
Given m and s , convert raw data to z scores.AppendixLO1
Control Chart: Air Pollution The visibility standard index (VSI) is a measure of Denver air pollution that is reported each day in the Denver Post. The index ranges from 0 (excellent air quality) to 200 (very bad air quality). During winter months, when air pollution is higher, the index has a mean
Control Charts: Motel Rooms The manager of Motel 11 has 316 rooms in Palo Alto, California. From observation over a long period of time, she knows that on an average night, 268 rooms will be rented.The long-term standard deviation is 12 rooms. This distribution is approximately mound-shaped and
Control Charts: Bank Loans Tri-County Bank is a small independent bank in central Wyoming. This is a rural bank that makes loans on items as small as horses and pickup trucks to items as large as ranch land.Total monthly loan requests are used by bank officials as an indicator of economic business
Control Charts: Yellowstone National Park Yellowstone Park Medical Services (YPMS) provides emergency health care for park visitors. Such health care includes treatment for everything from indigestion and sunburn to more serious injuries. A recent issue of Yellowstone Today (National Park Service
Pain Management: Laser Therapy “Effect of Helium-Neon Laser Auriculotherapy on Experimental Pain Threshold” is the title of an article in the journal Physical Therapy (Vol. 70, No. 1, pp. 24–30). In this article, laser therapy was discussed as a useful alternative to drugs in pain management
The second dose of the COVID-19 vaccine is more likely to produce side effects than the first. The time between receiving the shot and the onset of side effects is called the lag time. According to one study, the lag times (among the subjects that reported side effects from a second dose of the
In introductory statistics courses at Large State University, the times it takes students to complete their final exams are normally distributed with a mean of m 5 90 minutes and a standard deviation of s 515 minutes.Use Figure 6-3 to answer the following questions.(a) Estimate the probability that
Vending Machine: Soft Drinks A vending machine automatically pours soft drinks into cups. The amount of soft drink dispensed into a cup is normally distributed with a mean of 7.6 ounces and standard deviation of 0.4 ounce. Examine Figure 6-3 and answer the following questions.(a) Estimate the
Archaeology: Tree Rings At Burnt Mesa Pueblo, archaeological studies have used the method of tree-ring dating in an effort to determine when prehistoric people lived in the pueblo. Wood from several excavations gave a mean of (year) 1243 with a standard deviation of 36 years (Bandelier
Distribution: Rhode Island Red Chicks The incubation time for Rhode Island Red chicks is normally distributed with a mean of 21 days and standard deviation of approximately 1 day (based on information from The Merck Veterinary Manual). Look at Figure 6-3 and answer the following questions. If 1000
Distribution: Heights of Coeds Assuming that the heights of female college students are normally distributed with mean 65 inches and standard deviation 2.5 inches (based on information from Statistical Abstract of the United States, 112th edition), answer the following questions. Hint: Use Problems
Basic Computation: Empirical Rule What percentage of the area under the normal curve lies(a) to the right of m?(b) between m 2 2s and m 1 2s?(c) to the right of m 1 3s ?AppendixLO1
Basic Computation: Empirical Rule What percentage of the area under the normal curve lies(a) to the left of m?(b) between m 2s and m 1s ?(c) between m 2 3s and m 1 3s ?AppendixLO1
Critical Thinking Sketch a normal curve(a) with mean 15 and standard deviation 2.(b) with mean 15 and standard deviation 3.(c) with mean 12 and standard deviation 2.(d) with mean 12 and standard deviation 3.(e) Consider two normal curves. If the first one has a larger mean than the second one, must
Approximate probabilities from a normal distribution using the empirical rule.AppendixLO1
Identify the important properties of the graph of a normal curve.AppendixLO1
What is the sampling distribution for proportions and when can you use it to approximate the binomial distribution?AppendixLO1
What does the Central Limit Theorem tell us about the sampling distribution for samples from any population? (SECTION 6.5)AppendixLO1
What is the sampling distribution for samples from a normally distributed population? (SECTION 6.5)AppendixLO1
What is a sampling distribution? (SECTION 6.4)AppendixLO1
How can you use the standard normal distribution and z-scores to compute probabilities and compare data values from different normal distributions?AppendixLO1
What are the essential features of the normal distribution? (SECTION 6.1)AppendixLO1
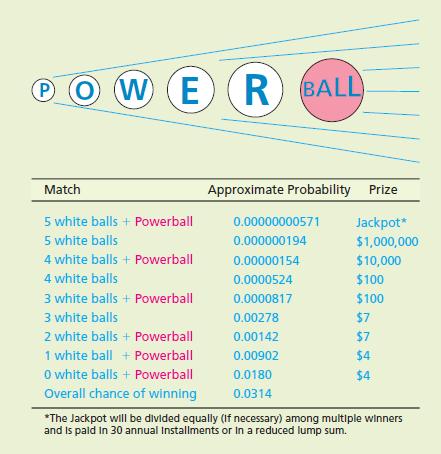
1. Powerball! Imagine, you could win a jackpot worth at least $40 million. Some jackpots have been worth more than $250 million! Powerball is a multistate lottery. To play Powerball, you purchase a $2 ticket. On the ticket you select five distinct white balls (numbered 1 through 59) and then one
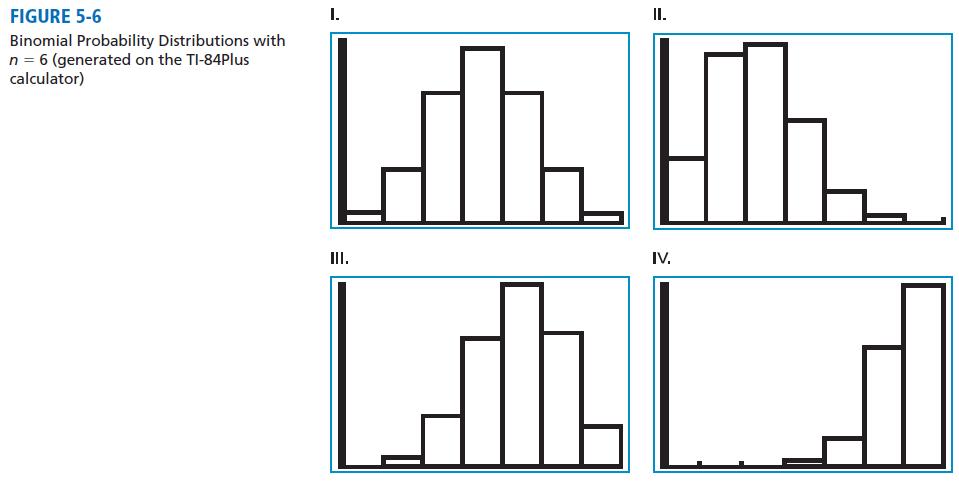
Binomial Distributions: Histograms Figure 5-6 shows histograms of several binomial distributions with n 5 6 trials. Match the given probability of success with the best graph.(a) p 5 0.30 goes with graph _________.(b) p 5 0.50 goes with graph _________.(c) p 5 0.65 goes with graph _________.(d) p 5
General: Combination Lock You have a combination lock. Again, to open it you turn the dial to the right and stop at a first number; then you turn it to the left and stop at a second number.Finally, you turn the dial to the right and stop at a third number. Suppose you remember that the three
General: Combination Lock To open a combination lock, you turn the dial to the right and stop at a number; then you turn it to the left and stop at a second number. Finally, you turn the dial back to the right and stop at a third number. If you used the correct sequence of numbers, the lock opens.
Scheduling: College Courses A student must satisfy the literature, social science, and philosophy requirements this semester. There are four literature courses to select from, three social science courses, and two philosophy courses. Make a tree diagram showing all the possible sequences of
Showing 5500 - 5600
of 6613
First
49
50
51
52
53
54
55
56
57
58
59
60
61
62
63
Last
Step by Step Answers