New Semester
Started
Get
50% OFF
Study Help!
--h --m --s
Claim Now
Question Answers
Textbooks
Find textbooks, questions and answers
Oops, something went wrong!
Change your search query and then try again
S
Books
FREE
Study Help
Expert Questions
Accounting
General Management
Mathematics
Finance
Organizational Behaviour
Law
Physics
Operating System
Management Leadership
Sociology
Programming
Marketing
Database
Computer Network
Economics
Textbooks Solutions
Accounting
Managerial Accounting
Management Leadership
Cost Accounting
Statistics
Business Law
Corporate Finance
Finance
Economics
Auditing
Tutors
Online Tutors
Find a Tutor
Hire a Tutor
Become a Tutor
AI Tutor
AI Study Planner
NEW
Sell Books
Search
Search
Sign In
Register
study help
business
statistics alive
Understandable Statistics Concepts And Methods 11th Edition Charles Henry Brase, Corrinne Pellillo Brase - Solutions
Medical: Physician Visits In some reports, the mean and coefficient of variation are given. For instance, in Statistical Abstract of the United States, 116th edition, one report gives the average number of physician visits by males per year. The average reported is 2.2, and the reported coefficient
Investing: Socially Responsible Mutual Funds Pax World Balanced is a highly respected, socially responsible mutual fund of stocks and bonds (see Viewpoint). Vanguard Balanced Index is another highly regarded fund that represents the entire U.S. stock and bond market (an index fund). The mean and
Wildlife: Mallard Ducks and Canada Geese For mallard ducks and Canada geese, what percentage of nests are successful (at least one offspring survives)?Studies in Montana, Illinois, Wyoming, Utah, and California gave the following percentages of successful nests (Reference: The Wildlife Society
Archaeology: Ireland The Hill of Tara in Ireland is a place of great archaeological importance. This region has been occupied by people for more than 4000 years.Geomagnetic surveys detect subsurface anomalies in the Earth’s magnetic field. These surveys have led to many significant archaeological
Space Shuttle: Epoxy Kevlar epoxy is a material used on the NASA space shuttles. Strands of this epoxy were tested at the 90% breaking strength. The following data represent time to failure (in hours) for a random sample of 50 epoxy strands (Reference: R. E.Barlow, University of California,
Investing: Stocks and Bonds Do bonds reduce the overall risk of an investment portfolio? Let x be a random variable representing annual percent return for Vanguard Total Stock Index (all stocks). Let y be a random variable representing annual return for Vanguard Balanced Index (60% stock and 40%
Basic Computation: Coefficient of Variation, Chebyshev Interval Consider population data with m 5 20 and s 5 2.(a) Compute the coefficient of variation.(b) Compute an 88.9% Chebyshev interval around the population mean.AppendixLO1
Basic Computation: Coefficient of Variation, Chebyshev Interval Consider sample data with x 515 and s 5 3.(a) Compute the coefficient of variation.(b) Compute a 75% Chebyshev interval around the sample mean.AppendixLO1
Basic Computation: Coefficient of Variation, Chebyshev Interval Consider sample data with x 5194.8 and s 5 25.4.(a) Compute the coefficient of variation.(b) Compute a 93.8% Chebyshev interval around the sample mean.AppendixLO1
Basic Computation: Variance, Standard Deviation Given the sample data x: 23.5 31.2 55.9 67.4 71.3 90.0(a) Verify that Sx 5 339.3 and Sx2 522376.95(b) Use the results of part (a) and the appropriate computation formulas to compute the sample variance s2 and sample standard deviation s.AppendixLO1
Basic Computation: Variance, Standard Deviation Given the sample data x: 23 17 15 30 25(a) Find the range.(b) Verify that Sx 5110 and Sx2 5 2568.(c) Use the results of part (b) and appropriate computation formulas to compute the sample variance s2 and sample standard deviation s.(d) Use the
Critical Thinking: Outliers One indicator of an outlier is that an observation is more than 2.5 standard deviations from the mean. Consider the data value 80.(a) If a data set has mean 70 and standard deviation 5, is 80 a suspect outlier?(b) If a data set has mean 70 and standard deviation 3, is 80
Critical Thinking: Data Transformation In this problem, we explore the effect on the standard deviation of multiplying each data value in a data set by the same constant. Consider the data set 5, 9, 10, 11, 15.(a) Use the defining formula, the computation formula, or a calculator to compute s.(b)
Critical Thinking Each of the following data sets has a mean of x 510.(i) 8 9 10 11 12(ii) 7 9 10 11 13(iii) 7 8 10 12 13(a) Without doing any computations, order the data sets according to increasing value of standard deviations.(b) Why do you expect the difference in standard deviations between
Critical Thinking Consider two data sets with equal sample standard deviations. The first data set has 20 data values that are not all equal, and the second has 50 data values that are not all equal. For which data set is the difference between s and s greater? Explain. Hint:Consider the
Critical Thinking For a given data set in which not all data values are equal, which value is smaller, s or s ?Explain.AppendixLO1
Basic Computation: Range, Standard Deviation Consider the data set 11 12 13 20 30(a) Find the range.(b) Use the defining formula to compute the sample standard deviation s.(c) Use the defining formula to compute the population standard deviation s .AppendixLO1
Basic Computation: Range, Standard Deviation Consider the data set 23.5 31.2 55.9 67.4 71.3 90.0(a) Find the range.(b) Use the defining formula to compute the sample standard deviation s.(c) Use the defining formula to compute the population standard deviation s .AppendixLO1
Basic Computation: Range, Standard Deviation Consider the data set 1 2 3 4 5(a) Find the range.(b) Use the defining formula to compute the sample standard deviation s.(c) Use the defining formula to compute the population standard deviation s .AppendixLO1
Basic Computation: Range, Standard Deviation Consider the data set 2 3 4 5 6(a) Find the range.(b) Use the defining formula to compute the sample standard deviation s.(c) Use the defining formula to compute the population standard deviation s .AppendixLO1
Statistical Literacy A random sample of 46 adult coyotes in a region of northern Minnesota showed the average age to be 2.05 years, with a sample standard deviation of 0.82 years. However, it is thought that the overall population mean age of the coyotes is 1.75 years. Match the numerical values
Statistical Literacy What symbol is used for the standard deviation when it is a sample statistic? What symbol is used for the standard deviation when it is a population parameter?AppendixLO1
Statistical Literacy When computing the standard deviation, does it matter whether the data are sample data or data comprising the entire population? Explain.AppendixLO1
Statistical Literacy What is the relationship between the variance and the standard deviation for a sample data set?AppendixLO1
Statistical Literacy Which average—mean, median, or mode—is associated with the standard deviation?AppendixLO1
Compute a Chebyshev interval and interpret the results.AppendixLO1
Compare the spreads of different sets of data using the coefficient of variation.AppendixLO1
Compute the coefficient of variation from raw data.AppendixLO1
Find and interpret the range, variance, and standard deviation for a data set.AppendixLO1
Grades: Weighted Average In your biology class, your final grade is based on several things: a lab score, scores on two major tests, and your score on the final exam. There are 100 points available for each score.However, the lab score is worth 25% of your total grade, each major test is worth
Grades: Grade Point Average The standard 4-point grading scale assigns a 4.0 to an A, 3.0 to a B, 2.0 to a C, 1.0 to a D, and 0.0 to an F. Suppose that you earned an A in your 5-credit Chemistry class, a B in your 1-credit Chemistry lab, a C in your 3-credit History class, and a B in your 3-credit
Basic Computation: Weighted Average Find the weighted average of a data set where 10 has a weight of 5; 20 has a weight of 3; 30 has a weight of 2 AppendixLO1
Leisure: Maui Vacation How expensive is Maui? If you want a vacation rental condominium (up to four people), visit a Maui tourism web site. The Maui News gave the following costs in dollars per day for a random sample of condominiums located throughout the island of Maui.89 50 68 60 375 55 500 71
Football: Age of Professional Players How old are professional football players? The 11th edition of The Pro Football Encyclopedia gave the following information of a random sample of pro football player ages in years:24 23 25 23 30 29 28 26 33 29 24 37 25 23 22 27 28 25 31 29 25 22 31 29 22 28 27
Ecology: Wolf Packs How large is a wolf pack? The following information is from a random sample of winter wolf packs in regions of Alaska, Minnesota, Michigan, Wisconsin, Canada, and Finland (Source:The Wolf, by L. D. Mech, University of Minnesota Press). Winter pack size:13 10 7 5 7 7 2 4 3 2 3 15
Environmental Studies: Death Valley How hot does it get in Death Valley? The following data are taken from a study conducted by the National Park System, of which Death Valley is a unit. The ground temperatures (8 F) were taken from May to November in the vicinity of Furnace Creek.146 152 168 174
Critical Thinking Consider a data set of 15 distinct measurements with mean A and median B.(a) If the highest number were increased, what would be the effect on the median and mean? Explain.(b) If the highest number were decreased to a value still larger than B, what would be the effect on the
Critical Thinking: Data Transformation In this problem, we explore the effect on the mean, median, and mode of multiplying each data value by the same number. Consider the data set 2, 2, 3, 6, 10.(a) Compute the mode, median, and mean.(b) Multiply each data value by 5. Compute the mode, median, and
Critical Thinking: Data Transformation In this problem, we explore the effect on the mean, median, and mode of adding the same number to each data value. Consider the data set 2, 2, 3, 6, 10.(a) Compute the mode, median, and mean.(b) Add 5 to each of the data values. Compute the mode, median, and
Interpretation A job-performance evaluation form has these categories:15excellent; 2 5good; 3 5satisfactory;4 5poor; 5 5unacceptable Based on 15 client reviews, one employee had a median rating of 4 and a mode rating of 1.(a) What is the level of measurement of the data: ratio, interval, ordinal,
Critical Thinking Consider two data sets.Set A: n 5 5; x 510 Set B: n 5 50; x 510(a) Suppose the number 20 is included as an additional data value in Set A. Compute x for the new data set.Hint: Sx 5nx. To compute x for the new data set, add 20 to Sx of the original data set and divide by 6.(b)
Critical Thinking Consider the numbers 2 3 4 5 5(a) Compute the mode, median, and mean.(b) If the numbers represent codes for the colors of T-shirts ordered from a catalog, which average(s)would make sense?(c) If the numbers represent one-way mileages for trails to different lakes, which average(s)
Critical Thinking Consider the following types of data that were obtained from a random sample of 49 credit card accounts. Identify all the averages (mean, median, or mode) that can be used to summarize the data.(a) Outstanding balance on each account(b) Name of credit card (e.g., MasterCard, Visa,
Critical Thinking When a distribution is moundshaped symmetric, what is the general relationship among the values of the mean, median, and mode?AppendixLO1
Critical Thinking If a data set has an even number of data, is it true or false that the median is never equal to a value in the data set? Explain.AppendixLO1
Critical Thinking Consider a data set with at least three data values. Suppose the highest value is increased by 10 and the lowest is decreased by 10.(a) Does the mean change? Explain.(b) Does the median change? Explain.(c) Is it possible for the mode to change? Explain.AppendixLO1
Critical Thinking Consider a data set with at least three data values. Suppose the highest value is increased by 10 and the lowest is decreased by 5.(a) Does the mean change? Explain.(b) Does the median change? Explain.(c) Is it possible for the mode to change? Explain.AppendixLO1
Basic Computation: Mean, Median, Mode Find the mean, median, and mode of the data set 11 12 13 20 30 AppendixLO1
Basic Computation: Mean, Median, Mode Find the mean, median, and mode of the data set 23.5 31.2 55.9 67.4 71.3 90.0 AppendixLO1
Basic Computations Mean, Median, Mode Find the mean, median, and mode of the data set 8 2 7 2 6 5 AppendixLO1
Basic Computation: Mean, Median, Mode Find the mean, median, and mode of the data set 10 12 20 15 20 AppendixLO1
Basic Computation: Mean, Median, Mode Find the mean, median, and mode of the data set 8 2 7 2 6 AppendixLO1
Statistical Literacy In order to find the median of a data set, what do we do first with the data?AppendixLO1
Statistical Literacy Look at the formula for the mean.List the two arithmetic procedures that are used to compute the mean.AppendixLO1
Statistical Literacy What symbol is used for the arithmetic mean when it is a sample statistic? What symbol is used when the arithmetic mean is a population parameter?AppendixLO1
Statistical Literacy Consider the mode, median, and mean. Which average represents the middle value of a data distribution? Which average represents the most frequent value of a distribution? Which average takes all the specific values into account?AppendixLO1
Compute and interpret a weighted average.AppendixLO1
Compute and interpret a trimmed mean for a data set.AppendixLO1
Explain how mean, median, and mode can be affected by extreme data values and the shape of the distribution.AppendixLO1
Compute and interpret the mean, median, and mode from raw data.AppendixLO1
How do you make a box-and-whisker plot, and what does it tell you about the spread of the data?AppendixLO1
How do variance and standard deviation measure data spread? (SECTION 3.2)AppendixLO1
What are commonly used measures of central tendency? What do they tell you? (SECTION 3.1)AppendixLO1
3. Statistical Literacy You are conducting a study of students doing work-study jobs on your campus. Among the questions on the survey instrument are:A. How many hours are you scheduled to work each week? Answer to the nearest hour.B. How applicable is this work experience to your future employment
4. Radio Talk Show: Sample Bias A radio talk show host asked listeners to respond either yes or no to the question, “Is the candidate who spends the most on a campaign the most likely to win?” Fifteen people called in and nine said yes. What is the implied population? What is the variable? Can
2. Use a random-number table or random-number generator to generate a random sample of 30 distinct values from the set of integers 1 to 100. Instructions for doing this using the TI-84Plus/TI-83Plus/TI-nspire (with TI-84Plus keypad), Excel 2010, Minitab, or SPSS are given in Using Technology at the
1. Critical Thinking Consider these types of graphs: histogram, bar graph, Pareto chart, pie chart, stem-and-leaf display.(a) Which are suitable for qualitative data?(b) Which are suitable for quantitative data?
2. Critical Thinking A consumer interest group is tracking the percentage of household income spent on gasoline over the past 30 years. Which graphical display would be more useful, a histogram or a time-series graph? Why?
3. Critical Thinking Describe how data outliers might be revealed in histograms and stem-and-leaf plots.
4. Expand Your Knowledge How are dotplots and stem-and-leaf displays similar?How are they different?
5. Focus Problem: Fuel Economy Solve the focus problem at the beginning of this chapter.
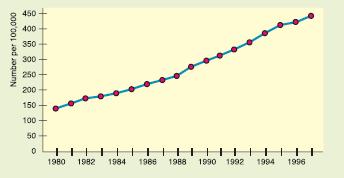
6. Criminal Justice: Prisoners The time plot in Figure 2-18 gives the number of state and federal prisoners per 100,000 population (Source: Statistical Abstract of the United States, 120th Edition).(a) Estimate the number of prisoners per 100,000 people for 1980 and for 1997.(b) Interpretation
7. IRS: Tax Returns Almost everyone files (or will someday file) a federal income tax return. A research poll for TurboTax (a computer software package to aid in tax-return preparation) asked what aspect of filing a return people thought to be the most difficult. The results showed that 43% of the
8. Law Enforcement: DUI Driving under the influence of alcohol (DUI) is a serious offense. The following data give the ages of a random sample of 50 drivers arrested while driving under the influence of alcohol. This distribution is based on the age distribution of DUI arrests given in the
9. Agriculture: Apple Trees The following data represent trunk circumferences(in mm) for a random sample of 60 four-year-old apple trees at East Malling Agriculture Research Station in England (Reference: S. C. Pearce, University of Kent at Canterbury). Note: These data are also available for
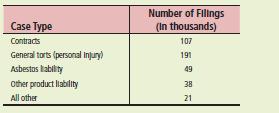
10. Law: Corporation Lawsuits Many people say the civil justice system is overburdened. Many cases center on suits involving businesses. The following data are based on a Wall Street Journal report. Researchers conducted a study of lawsuits involving 1908 businesses ranked in the Fortune 1000 over
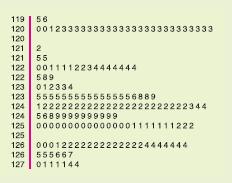
11. Archaeology: Tree-Ring Data The Sand Canyon Archaeological Project, edited by W. D. Lipe and published by Crow Canyon Archaeological Center, contains the stem-and-leaf diagram shown in Figure 2-19. The study uses tree rings to accurately determine the year in which a tree was cut. The figure
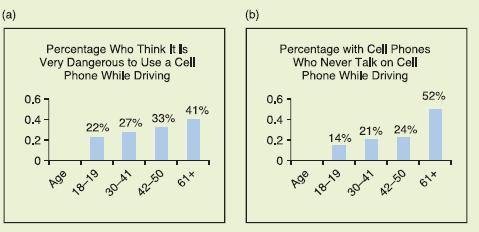
12. Interpretation A Harris Poll surveyed 2085 U.S. adults regarding use of cell phones while driving. All the adults were asked their opinion regarding how dangerous it is for a driver to use a cell phone while driving. Graph (a)shows the percentage responding “very dangerous” by age group.
1. Statistical Literacy(a) What measures of variation indicate spread about the mean?(b) Which graphic display shows the median and data spread about the median?
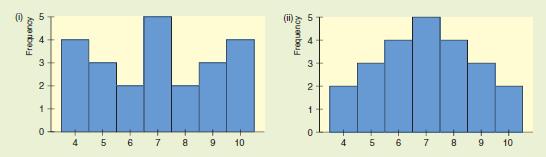
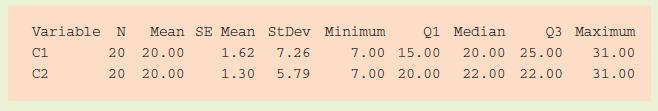
2. Critical Thinking Look at the two histograms below. Each involves the same number of data. The data are all whole numbers, so the height of each bar represents the number of values equal to the corresponding midpoint shown on the horizontal axis. Notice that both distributions are symmetric.(a)
3. Critical Thinking Consider the following Minitab display of two data sets.(a) What are the respective means? the respective ranges?(b) Which data set seems more symmetric? Why?(c) Compare the interquartile ranges of the two sets. How do the middle halves of the data sets compare? Variable N Mean
4. Consumer: Radon Gas “Radon: The Problem No One Wants to Face” is the title of an article appearing in Consumer Reports. Radon is a gas emitted from the ground that can collect in houses and buildings. At certain levels it can cause lung cancer. Radon concentrations are measured in picocuries
5. Political Science: Georgia Democrats How Democratic is Georgia? Countyby-county results are shown for a recent election. For your convenience, the data have been sorted in increasing order (Source: County and City Data Book, 12th Edition, U.S. Census Bureau).Percentage of Democratic Vote by
6. Grades: Weighted Average Professor Cramer determines a final grade based on attendance, two papers, three major tests, and a final exam. Each of these activities has a total of 100 possible points. However, the activities carry different weights. Attendance is worth 5%, each paper is worth 8%,
7. General: Average Weight An elevator is loaded with 16 people and is at its load limit of 2500 pounds. What is the mean weight of these people?
8. Agriculture: Harvest Weight of Maize The following data represent weights in kilograms of maize harvest from a random sample of 72 experimental plots on St. Vincent, an island in the Caribbean (Reference: B. G. F. Springer, Proceedings, Caribbean Food Corps. Soc., Vol. 10, pp. 147–152).
9. Focus Problem: The Educational Advantage Solve the focus problem at the beginning of this chapter.
10. Agriculture: Bell Peppers The pathogen Phytophthora capsici causes bell pepper plants to wilt and die. A research project was designed to study the effect of soil water content and the spread of the disease in fields of bell peppers (Source: Journal of Agricultural, Biological, and
11. Performance Rating: Weighted Average A performance evaluation for new sales representatives at Office Automation Incorporated involves several ratings done on a scale of 1 to 10, with 10 the highest rating. The activities rated include new contacts, successful contacts, total contacts, dollar
4. You are examining two data sets involving test scores, set A and set B. The score 86 appears in both data sets.In which of the following data sets does 86 represent a higher score? Explain.(a) The percentile rank of 86 is higher in set A than in set B.(b) The mean is 80 in both data sets, but
5. Write a brief description in which you outline how you would obtain a random sample of 102 west Texas water wells. Explain how random numbers would be used in the selection process.
6. Is the given data nominal, ordinal, interval, or ratio?Explain.
9. Make an ogive using five classes.
10. Compute the range, mean, median, and mode for the given data.
11. (a) Verify that ©x 5 772.9 and ©x2 5 5876.6.(b) Compute the sample variance, sample standard deviation, and coefficient of variation for the given data. Is the sample standard deviation small relative to the mean pH?
12. Compute a 75% Chebyshev interval centered on the mean.
13. Make a box-and-whisker plot. Find the interquartile range.
14. Look at the histogram. Is the pH distribution for these wells symmetric or skewed? Are lower or higher values more common?
15. Look at the ogive. What percent of the wells have a pH less than 8.15? Suppose a certain crop can tolerate irrigation water with a pH between 7.35 and 8.55. What percent of the wells could be used for such a crop?
16. Look at the stem-and-leaf plot. Are there any unusually high or low pH levels in this sample of wells? How many wells are neutral (pH of 7)?
Showing 5900 - 6000
of 6613
First
53
54
55
56
57
58
59
60
61
62
63
64
65
66
67
Step by Step Answers