New Semester
Started
Get
50% OFF
Study Help!
--h --m --s
Claim Now
Question Answers
Textbooks
Find textbooks, questions and answers
Oops, something went wrong!
Change your search query and then try again
S
Books
FREE
Study Help
Expert Questions
Accounting
General Management
Mathematics
Finance
Organizational Behaviour
Law
Physics
Operating System
Management Leadership
Sociology
Programming
Marketing
Database
Computer Network
Economics
Textbooks Solutions
Accounting
Managerial Accounting
Management Leadership
Cost Accounting
Statistics
Business Law
Corporate Finance
Finance
Economics
Auditing
Tutors
Online Tutors
Find a Tutor
Hire a Tutor
Become a Tutor
AI Tutor
AI Study Planner
NEW
Sell Books
Search
Search
Sign In
Register
study help
business
statistics for experimentert
Statistics 4th Edition David Freedman, Robert Pisani, Roger Purves - Solutions
Largest Hydroelectric Plants. According to Wikipedia, the world’s five largest hydroelectric plants, based on installed capacity, are as shown in the following table. Capacities are in megawatts.Rank Name Country Capacity 1 Three Gorges Dam China 22,500 2 Itaipu Dam Brazil/Paraguay 14,000 3 Guri
DVD Players. Refer to Example 2.16 on page 82.a. Explain why a frequency histogram of the DVD prices with single-value classes would be essentially identical to the dotplot shown in Fig. 2.7.b. Would the dotplot and a frequency histogram be essentially identical with other than single-value
Beer Consumption. In the Global Status Report on Alcohol and Health 2014, the World Health Organization has provided the percentage of beer consumption in a 44 Asian and European countries Country consumption Country consumption Albania 31.8 Latvia 46.9 Andorra 34.6 Luxembourg 36.2 Armenia 9.7
Beer Consumption. Refer to Problem 19. Construct a dotplot for the percentage of beer consumption in the 44 countries.
Beer Consumption. Construct a stem-and-leaf diagram for the beer consumption percentage in WHO European region in Problem 19, after rounding up.a. Use one line per stem.b. Use two lines per stem.c. Which of the two stem-and-leaf diagrams that you just constructed corresponds to the frequency
Battery Lifetime. In the article “Comparing the lifetime of two brands of batteries” (Journal of Statistics Education, Vol. 21, No. 1, pp. 1–19) by P. Dunn, two brands of AA alkaline batteries were compared. The following table gives the number of pulses required for a sample of 18 Energizer
Busy Bank Tellers. The Prescott National Bank has six tellers available to serve customers. The data in the following table provide the number of busy tellers observed during 25 spot checks.65415 61555 35243 45064 34236a. Use single-value grouping to organize these data into frequency and
On-Time Arrivals. The Air Travel Consumer Report is a monthly product of the Department of Transportation’s Office of Aviation Enforcement and Proceedings. The report is designed to assist consumers with information on the quality of services provided by the airlines. Following are the
Zimbabwe Cricket Team. From the ESPN Web site, we obtained the ages of Zimbabwe’s national cricket players for the year 2015. Here are the data.28 25 30 29 24 28 35 31 29 26 26 23 28 27 28 19 31 25 29 23 29 28 25 28 24 29 23 22 23 27a. Construct a dotplot for these data.b. Use your dotplot from
Latent Fingerprints. Firearms, live ammunition, and spent cartridge casings are often submitted to crime laboratories to be processed for latent fingerprints. B. Maldonado explored the chances of successfully recovering fingerprints in the article, “Study on Developing Latent Fingerprints on
U.S. Divisions. The U.S. Census Bureau divides the states in the United States into nine divisions: East North Central (ENC), East South Central (ESC), Middle Atlantic (MAC), Mountain (MTN), New England (NED), Pacific (PAC), South Atlantic (SAC), West North Central (WNC), and West South Central
In the article, “Squeaky Clean Fossil Fuels” (New Scientist, Vol. 186, No. 2497, p. 26), F. Pearce reported on the benefits of using clean fossil fuels that release no carbon dioxide(CO2), helping to reduce the threat of global warming. One technique of slowing down global warming caused by CO2
The following graph is based on one that appeared in an Arizona Republic newspaper article entitled “Hand That Rocked Cradle Turns to Work as Women Reshape U.S. Labor Force.” The graph depicts the labor force participation rates for the years 1960, 1980, and 2000.Working Men and Women by Age,
Hair and Eye Color. In the article “Graphical Display of TwoWay Contingency Tables” (The American Statistician, Vol. 28, No. 1, pp. 9–12), R. Snee presented data on hair color and eye color among 592 students in an elementary statistics course at the University of Delaware. Raw data for that
Agricultural Exports. The U.S. Department of Agriculture collects data pertaining to the value of agricultural exports and publishes its findings in U.S. Agricultural Trade Update. For one year, the values of these exports, by state, are provided on the WeissStats site.Data are in millions of
Life Expectancy by Country. Life expectancy is the average number of years to be lived by a group of people born in the same year if mortality at each age remains constant in the future. From the World FactBook, published by theCentral Intelligence Agency (CIA), we obtained the life expectancy for
High and Low Temperatures. The U.S. National Oceanic and Atmospheric Administration publishes temperature data in Climatography of the United States. According to that document, the annual average maximum and minimum temperatures for selected cities in the United States are as provided on the
In Lotto 6-53, there is a box with 53 balls, numbered from 1 to 53. Six balls are drawn at random without replacement from the box. You win the grand prize if the numbers on your lottery ticket are the same as the numbers on the six balls; order does not matter.Person A bought two tickets, with the
A box contains 2 red marbles and 98 blue ones. Draws are made at random with replacement. In ___ draws from the box, there is better than a 50%chance for a red marble to appear at least once. Fill in the blank with the smallest number that makes the statement true. (You will need a calculator.)
A coin is tossed 10 times. True or false, and explain:(a) The chance of getting 10 heads in a row is 1/1,024.(b) Given that the first 9 tosses were heads, the chance of getting 10 heads in a row is 1/2. plo88
Three cards are dealt from a well-shuffled deck.(a) Find the chance that all of the cards are diamonds.(b) Find the chance that none of the cards are diamonds.(c) Find the chance that the cards are not all diamonds. plo88
There are two options:(i) A die will be rolled 60 times. Each time it shows an ace or a six, you win $1; on the other rolls, you win nothing.(ii) Sixty draws will be made at random with replacement from the box 1 1 1 0 0 0. On each draw, you will be paid the amount shown on the ticket, in dollars.
One ticket will be drawn at random from each of the two boxes shown below:(A) 1 2 3(B) 1 2 3 4 Find the chance that:(a) The number drawn from A is larger than the one from B.(b) The number drawn from A equals the one from B.(c) The number drawn from A is smaller than the one from B. plo88
Repeat exercise 7, if the draws are made at random without replacement. plo88
Find the chance that 2 is drawn at least once. plo88
Four draws are going to be made at random with replacement from the box 1 2 2 3 plo88
One event has chance 1/2, another has chance 1/3. Fill in the blanks, using one phrase from each pair below, to make up two true sentences. Write out both sentences."If you want to find the chance that (i) will happen, check to see if they are (ii) . If so, you can (iii) the chances."(i) at least
The chance of A is 1/3; the chance of B is 1/10. True or false, and explain:(a) If A and B are independent, they must also be mutually exclusive.(b) If A and B are mutually exclusive, they cannot be independent. plo88
Two cards will be dealt off the top of a well-shuffled deck. You have a choice: plo88
True or false, and explain:(a) If a die is rolled three times, the chance of getting at least one ace is 1/6 + 1/6 + 1/6 = 1/2.(b) If a coin is tossed twice, the chance of getting at least one head is 100%. plo88
In the game of Monopoly, a player rolls two dice, counts the total number of spots, and moves that many squares. Find the chance that the player moves 11 squares (no more and no less). plo88
A pair of dice are thrown.(a) Find the chance that both dice show 3 spots.(b) Find the chance that both dice show the same number of spots. plo88
According to de Moivre, in eighteenth-century England people played a game sim-ilar to modern roulette. It was called "Royal Oak." There were 32 "points" or num- plo88
A pair of dice is rolled 36 times. What is the chance of getting at least one double-ace? plo88
(a) A die is rolled 3 times. What is the chance of getting at least one ace?(b) Same, with 6 rolls.(c) Same, with 12 rolls. plo88
A box contains four tickets, one marked with a star, and the other three blank:* * *Two draws are made at random with replacement from this box.(a) What is the chance of getting a blank ticket on the first draw?(b) What is the chance of getting a blank ticket on the second draw?(c) What is the
In exercise 1, which is a better bet-(a) or (f)? Or are they same? What about (b)and (e)? What about (c) and (d)? (You do not need to compute the chances.) plo88
Two cards are dealt off the top of a well-shuffled deck.(a) Find the chance that the second card is an ace.(b) Find the chance that the second card is an ace, given the first card is a king.(c) Find the chance that the first card is a king and the second card is an ace.--- OCR End --- plo88
The unconditional probability of event A is 1/2. The unconditional probability of event B is 1/3. Say whether each of the following is true or false, and explain briefly.(a) The chance that A and B both happen must be 1/2 x 1/3 = 1/6.(b) If A and B are independent, the chance that they both happen
A deck of cards is shuffled. True or false, and explain briefly:(a) The chance that the top card is the jack of clubs equals 1/52.(b) The chance that the bottom card is the jack of diamonds equals 1/52.(c) The chance that the top card is the jack of clubs or the bottom card is the jack of diamonds
A number is drawn at random from a box. There is a 20% chance for it to be 10 or less. There is a 10% chance for it to be 50 or more. True or false: the chance of getting a number between 10 and 50 (exclusive) is 70%. Explain briefly. plo88
A box contains 10 tickets numbered 1 through 10. Five draws will be made at random with replacement from this box. True or false: there are 5 chances in 10 of getting 7 at least once. Explain briefly. plo88
Two dice will be rolled. The chance that the first one lands☐ is 1/6. The chance that the second one lands☐ is 1/6. True or false: the chance that the first one lands☐ or the second one lands☐ equals 1/6 + 1/6. Explain briefly. plo88
Two cards are dealt off the top of a well-shuffled deck. You have a choice:(i) to win $1 if the first card is an ace or the second card is an ace;(ii) to win $1 if at least one of the two cards is an ace.Which option is better? or are they the same? Explain briefly. plo88
(a) In the box shown below, each ticket has two numbers.12 13 31 32(For instance, the first number on 31 is 3 and the second is 1.) A ticket is drawn at random. Find the chance that the sum of the two numbers is 4.(b) Repeat, for the box 12 13 13 32 33 33(c) Repeat, for the box plo88 12 13 13 31 32
A pair of dice is thrown 1,000 times. What total should appear most often? What totals should appear least often? plo88
Two draws are made at random with replacement from the box 12345? plo88
Look at figure 1 and make a list of the ways to roll a total of 5 spots. What is the chance of throwing a total of 5 spots with two dice? plo88
The mathematical theory of chance only applies in some situations. Using it elsewhere can lead to ridiculous results. plo88
Blindly multiplying chances can make real trouble. Check for independence, or use conditional chances. plo88
When you draw at random, all the tickets in the box have the same chance to be picked. Draws made at random with replacement are independent. Without replacement, the draws are dependent. plo88
If two things are independent, the chance that both will happen equals the product of their unconditional chances. This is a special case of the multiplication rule. plo88
Two things are independent if the chances for the second one stay the same no matter how the first one turns out. plo88
The chance that two things will both happen equals the chance that the first will happen, multiplied by the conditional chance that the second will happen given that the first has happened. This is the multiplication rule. plo88
The chance of something equals 100% minus the chance of the opposite thing. plo88
Chances are between 0% and 100%. Impossibility is represented by 0%, certainty by 100%. plo88
The chance of something gives the percentage of times the thing is expected to happen, when the basic process is repeated over and over again. plo88
The frequency theory of chance applies most directly to chance processes which can be repeated over and over again, independently and under the same conditions. plo88
You are thinking about playing a lottery. The rules: you buy a ticket, choose 3 different numbers from 1 to 100, and write them on the ticket. The lottery has a box with 100 balls numbered from 1 through 100. Three balls are drawn at random without replacement. If the numbers on these balls are the
In the box shown below, each ticket should have two numbers:1 12 12 13 31 32 3 3 A ticket will be drawn at random. Can you fill in the blanks so the two numbers are independent? plo88
Which of the two options is better, or are they the same? Explain briefly.(i) You toss a coin 100 times. On each toss, if the coin lands heads, you win $1. If it lands tails, you lose $1.(ii) You draw 100 times at random with replacement from 1 0. On each draw, you are paid (in dollars) the number
A die is rolled 10 times. Find the chance of-(a) getting 10 sixes.(b) not getting 10 sixes.(c) all the rolls showing 5 spots or less. plo88
A die is rolled four times. What is the chance that- plo88(a) all the rolls show 3 or more spots?(b) none of the rolls show 3 or more spots?(c) not all the rolls show 3 or more spots?
A coin is tossed six times. Two possible sequences of results are(i) HTTHTH(ii) HHHHHH(The coin must land H or T in the order given; H = heads, T = tails.) Which of the following is correct? Explain.(a) Sequence (i) is more likely.(b) Sequence (ii) is more likely.(c) Both sequences are equally
A deck of cards is shuffled and the top two cards are placed face down on a table. True or false, and explain:(a) There is 1 chance in 52 for the first card to be the ace of clubs.(b) There is 1 chance in 52 for the second card to be the ace of diamonds.(c) The chance of getting the ace of clubs
One ticket will be drawn at random from the box below. Are color and number independent? Explain. plo88 118 118
A poker hand is dealt. Find the chance that the first four cards are aces and the fifth is a king. plo88
Four cards will be dealt off the top of a well-shuffled deck. There are two options:(i) To win $1 if the first card is a club and the second is a diamond and the third is a heart and the fourth is a spade.(ii) To win $1 if the four cards are of four different suits.Which option is better? Or are
Two cards will be dealt off the top of a well-shuffled deck. You have a choice:(i) To win $1 if the first is a king.(ii) To win $1 if the first is a king and the second is a queen.Which option is better? Or are they equivalent? Explain briefly.
True or false, and explain:(a) If something has probability 1,000%, it is sure to happen.(b) If something has probability 90%, it can be expected to happen about nine times as often as its opposite.
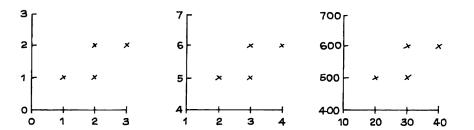
Below are three scatter diagrams. Do they have the same correlation? Try to answer without calculating. PL968 3 2 F 7 6 5 x x 700 600- 500 400 1 2 3 1 2 3 4 10 10 20 20 x 30 50 40
The late 1960s and early 1970s were years of turmoil in the U.S. Psycholo-gists thought that rioting was related (among other things) to temperature, with hotter weather making people more aggressive. 14 Two investigators, however, argued that "the frequency of riots should increase with
In the Sanitary District of Chicago, operating engineers are hired on the basis of a competitive civil-service examination. In 1966, there were 223 applicants for 15 jobs. The exam was held on March 12; the test scores are shown below, arranged in increasing order. The height of each bar in the
The table on the next page shows the distribution of adults by the last digit of their age, as reported in the Census of 1880 and the Census of 1970.12 You might expect each of the ten possible digits to turn up for 10% of the people, but this is not the case. For example, in 1880, 16.8% of all
In a survey carried out at the University of California, Berkeley, a sample of students were interviewed and asked what their grade-point average was. A histogram of the results is shown below. (GPA ranges from 0 to 4, and 2 is a bare pass.)(a) True or false: more students reported a GPA in the
The figure on the next page (adapted from the San Francisco Chronicle, May 18, 1992) shows the distribution of American families by income. Ranges include the left endpoint but not the right. For example, 3.7% of the families had in-comes in the range $0-$4,999, 5.8% had incomes in the range
Two histograms are sketched below. One shows the distribution of age at death from natural causes (heart disease, cancer, and so forth). The other shows age at death from trauma (accident, murder, suicide). Which is which, and why? P-968
(Hypothetical.) In one study, 100 people had their heights measured to the nearest eighth of an inch. A histogram for the results is shown below. Two of the following lists have this histogram. Which ones, and why?(i) 25 people, 67 inches tall; 50 people, 68 inches tall; 25 people, 69 inches
Someone has sketched one block of a family-income histogram for a wealthy suburb. About what percentage of the families in this suburb had incomes be-tween $90,000 and $100,000 a year?% per $1,000 10 50 100 Family income (thousands of dollars) P-968
The American Housing Survey is done every year by the Bureau of the Census. Data from the 2003 survey can be used to find the distribution of occupied housing units (this includes apartments) by number of rooms. Results for the whole U.S. are shown below, separately for "owner-occupied" and
The age distribution of people in the U.S. in 2004 is shown below. Draw the histogram. (The class intervals include the left endpoint, not the right; for in-stance, on the second line of the table, 14% of the people were age 5 years or more but had not yet turned 15. The interval for "75 and over"
Compare the histograms of blood pressures for non-users age 17-24 and for non-users age 25-34. What do you conclude? P-968
Draw histograms for the blood pressures of the users and non-users age 17-24.What do you conclude? P-968
Use table 2 to answer the following questions.(a) What percentage of users age 17-24 have blood pressures of 140 mm or more?(b) What percentage of non-users age 17-24 have blood pressures of 140 mm or more?(c) What do you conclude? P-968
In the March Current Population Survey, women are asked how many children they have. Results are shown below for women age 25-39, by educational level.(a) Is the number of children discrete or continuous?(b) Draw histograms for these data. (You may take "5 or more" as 5-very few women had more than
Classify each of the following variables as qualitative or quantitative; if quantita-tive, as discrete or continuous.(a) occupation (b) region of residence (c) weight(d) height (e) number of automobiles owned P-968
An investigator draws a histogram for some height data, using the metric system. She is working in centimeters (cm). The vertical axis shows density, and the top of the vertical axis is 10 percent per cm. Now she wants to convert to millimeters (mm). There are 10 millimeters to the centimeter. On
What happened to the educational level from 1960 to 1970?--- OCR End --- P-968
Draw the histogram for the 1970 data, and compare it to the 1991 histogram. What happened to the educational level of the population between 1970 and 1991-did it go up, go down, or stay about the same? P-968
Redraw the histogram for the 1991 data, combining the first two class intervals into one (0-8 years, with 6% of the people). Does this change the histogram much? P-968
The table below gives the distribution of educational level for persons age 25 and over in the U.S. in 1960, 1970, and 1991. ("Educational level" means the number of years of schooling completed.) The class intervals include the left endpoint, but not the right; for example, from the second line of
The figure below compares the histograms for family incomes in the U.S. in 1973 and in 2004. It looks as if family income went up by a factor of 4 over 30 years. Or did it? Discuss briefly. P-968
An investigator collects data on hourly wage rates for three groups of people. Those in group B earn about twice as much as those in group A. Those in group C earn about $10 an hour more than those in group A. Which histogram belongs to which group? (The histograms don't show wages above $50 an
In class (b) of exercise 4, were there more people with scores in the range 40-50 or 90-100? P-968
One class in exercise 4 had two quite distinct groups of students, with one group doing rather poorly on the test, and the other group doing very well. Which class was it?
Below are sketches of histograms for test scores in three different classes. The scores range from 0 to 100; a passing score was 50. For each class, was the percent who passed about 50%, well over 50%, or well under 50%? P-968
The histogram below shows the distribution of final scores in a certain class.(a) Which block represents the people who scored between 60 and 80?(b) Ten percent scored between 20 and 40. About what percentage scored between 40 and 60?(c) About what percentage scored over 60? P-968
In figure 2, were there more families earning between $10,000 and $11,000 or between $15,000 and $16,000? Or were the numbers about the same? Make your best guess. P-968
About 1% of the families in figure 2 had incomes between $0 and $1,000. Estimate the percentage who had incomes- P-968(a) between $1,000 and $2,000(b) between $2,000 and $3,000(c) between $3,000 and $4,000(d) between $4,000 and $5,000(e) between $4,000 and $7,000(f) between $7,000 and $10,000
True or false: A student who is at the 40th percentile of first-year GPAs is also likely to be at the 40th percentile of second-year GPAs. Explain briefly. (The scatter diagram is football-shaped.) PL968
Showing 5100 - 5200
of 5401
First
41
42
43
44
45
46
47
48
49
50
51
52
53
54
55
Step by Step Answers