All Matches
Solution Library
Expert Answer
Textbooks
Search Textbook questions, tutors and Books
Oops, something went wrong!
Change your search query and then try again
Toggle navigation
FREE Trial
S
Books
FREE
Tutors
Study Help
Expert Questions
Accounting
General Management
Mathematics
Finance
Organizational Behaviour
Law
Physics
Operating System
Management Leadership
Sociology
Programming
Marketing
Database
Computer Network
Economics
Textbooks Solutions
Accounting
Managerial Accounting
Management Leadership
Cost Accounting
Statistics
Business Law
Corporate Finance
Finance
Economics
Auditing
Hire a Tutor
AI Study Help
New
Search
Search
Sign In
Register
study help
business
statistics for experimentert
Questions and Answers of
Statistics For Experimentert
A researcher is testing the effectiveness of a skillsmastery imagery program for soccer players. A sample of n = 25 college varsity players is selected and each player is tested on a ball-handling
In problem 13 in Chapter 17, we discussed a study by Loftus and Palmer (1974) examining how different phrasing of questions can influence eyewitness testimony. In the study, students watched a video
In Problem 14 in Chapter 11, we described a study showing that students are likely to improve their test scores if they go back and change answers after reconsidering some of the questions on the
In problem 11 of Chapter 11, we described a repeatedmeasures study showing that male college athletes significantly increased their attendance when they were required to text “in class” to their
In Example 11.2 (p. 343), we presented a repeatedmeasures research study demonstrating that swearing can help reduce ratings of pain (Stephens, Atkins, &Kingston, 2009). In the study, each
Most children and adults are able to learn the meaning of new words by listening to sentences in which the words appear. Shulman and Guberman (2007)tested the ability of children to learn word
On a multiple-choice exam with 80 questions and 4 possible answers for each question, you get a score of X = 29.Is your score significantly better than would be expected by chance (by simply guessing
For each of the following, assume that a two-tailed test using the normal approximation to the binomial distribution with α = .05 is being used to evaluate the significance of the result.a. For a
Danner and Phillips (2008) report the results from a county-wide study showing that delaying high school start times by one hour significantly reduced the motor vehicle crash rate for teen drivers in
In problem 13 in Chapter 9, we presented a study examining the spotlight effect, which refers to overestimating the extent to which others notice your appearance or behavior, especially when you
In 2005, Fung et al. published a study reporting that patients prefer technical quality vs. interpersonal skills when selecting a primary care physician. Participants were presented with report cards
A researcher would like to determine whether people really can tell the difference between bottled water and tap water. Participants are asked to taste two unlabeled glasses of water, one bottled and
Problems 5 and 6 in Chapter 17 cited a study showing that people tend to choose partners who are similar to themselves. Jones, Pelham, Carvallo, and Mirenberg,(2004) demonstrated that people have a
In problem 9 in Chapter 17, we described a study demonstrating that the color red is often associated with male dominance. Hill and Barton (2005)monitored the outcome of four combat sports (boxing,
Insurance companies charge young drivers more for automobile insurance because they tend to have more accidents than older drivers. To make this point, an insurance representative first determines
How should zero differences be interpreted in a sign test?a. They provide support for the null hypothesis.b. They provided evidence that the null hypothesis should be rejected.c. They are not
In the sign test, how are the difference scores coded?a. By their ranked size, with increases and decreases ranked separately.b. By their ranked size, independent of sign (increase or decrease).c. As
In terms of the sample data, what other test does the binomial test most resemble?a. An analysis of variance.b. A test comparing two population means.c. The chi square test for goodness of fit.d. The
Recognize when a sign test is appropriate and be able to perform the necessary computations.
Explain the relationship between the chi‑square test for goodness of fit and the binomial test.
For a binomial test with p = q = 1 2 and n = 36, is a score of X = 24 sufficient to reject the null hypothesis? Assume a two-tailed test with α = .05.a. Yes, X = 24 is entirely in the critical
What is the standard deviation for the normal approximation to the binomial distribution with n = 100 and p = .20?a. 16b. 4c. 2d. 0.16
What is the mean for the normal approximation to the binomial distribution with n = 30 and p = .40?a. .24b. 7.2c. 12d. 18
Explain how the decision in a binomial test can be influenced by the fact that each score actually corresponds to an interval in the distribution.
Perform all of the necessary computations for the binomial test.
A binomial distribution has p = 4/5. How large a sample would be necessary to justify using the normal approximation to the binomial distribution?a. At least 10b. At least 13c. At least 40d. At least
If pn = 40 and qn = 20, then what is the shape of the binomial distribution?a. Normalb. Positively skewedc. Negatively skewedd. Cannot be determined without additional information
Which of the following is not an example of binomial data? Classifying college students according toa. gender: male, femaleb. age: 21 or younger, older than 21c. college class: freshman, sophomore,
Define the criteria that must be satisfied before the binomial distribution is normal and the z‑score statistic can be used.
Describe binomial data and identify situations for which a binomial test is appropriate.
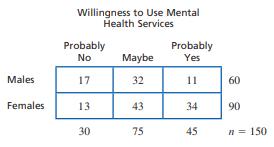
Research has demonstrated strong gender differences in teenagers’ approaches to dealing with mental health issues (Chandra & Minkovitz, 2006). In a typical study, eighth-grade students are
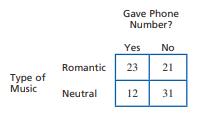
In the Preview for this chapter we presented a research study demonstrating that romantic background music increases the likelihood that a woman will give her phone number to a man she has just
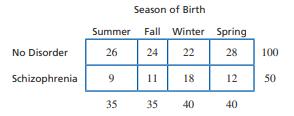
Although the phenomenon is not well understood, it appears that people born during the winter months are slightly more likely to develop schizophrenia than people born at other times (Bradbury &
Cialdini, Reno, and Kallgren (1990) examined how people conform to norms concerning littering. The researchers wanted to determine whether a person’s tendency to litter depended on the amount of
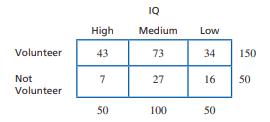
Research indicates that people who volunteer to participate in research studies tend to have higher intelligence than nonvolunteers. To test this phenomenon,a researcher obtains a sample of 200 high
A recent study indicates that people tend to select video game avatars with characteristics similar to those of their creators (Bélisle & Bodur, 2010). Participants who had created avatars for a
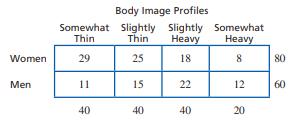
In a study similar to one conducted by Fallon and Rozin (1985), a psychologist prepared a set of silhouettes showing different female body shapes ranging from somewhat thin to somewhat heavy and
Gender differences in dream content are well documented (see Winget & Kramer, 1979). Suppose a researcher studies aggression content in the dreams of men and women. Each participant reports his
Research results suggest that IQ scores for boys are more variable than IQ scores for girls (Arden &Plomin, 2006). A typical study looking at 10-year-old children classifies participants by
In a study investigating freshman weight gain, the researchers also looked at gender differences in weight (Kasparek, Corwin, Valois, Sargent, & Morris, 2008). Using self-reported heights and
In a classic study, Loftus and Palmer (1974)investigated the relationship between memory for eyewitnesses and the questions they are asked.In the study, participants watched a film of an automobile
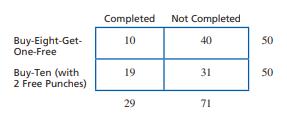
Many businesses use some type of customer loyalty program to encourage repeat customers. A common example is the buy-ten-get-one-free punch card. Drèze and Nunes (2006) examined a simple variation
In Problem 10, a researcher asked college students to evaluate three new cell phone designs. However, the researcher suspects that college students may have criteria that are different from those
A communications company has developed three new designs for a cell phone. To evaluate consumer response, a sample of 120 college students is selected and each student is given all three phones to
The color red is often associated with anger and male dominance. Based on this observation, Hill and Barton(2005) monitored the outcome of four combat sports(boxing, tae kwan do, Greco-Roman
Automobile insurance is much more expensive for teenage drivers than for older drivers. To justify this cost difference, insurance companies claim that the younger drivers are much more likely to be
A professor in the psychology department would like to determine whether there has been a significant change in grading practices over the years. It is known that the overall grade distribution for
Suppose that the researcher from the previous problem repeated the study of married couples’ initials using twice as many participants and obtaining observed frequencies that exactly double the
Research has demonstrated that people tend to be attracted to others who are similar to themselves. One study demonstrated that individuals are disproportionately more likely to marry those with
Data from the Motor Vehicle Department indicate that 80% of all licensed drivers are older than age 25.a. In a sample of n = 50 people who recently received speeding tickets, 33 were older than 25
A developmental psychologist would like to determine whether infants display any color preferences. A stimulus consisting of four color patches (red, green, blue, and yellow) is projected onto the
The student population at the state college consists of 60% females and 40% males.a. The college theater department recently staged a production of a modern musical. A researcher recorded the gender
One version of the null hypothesis for the chi-square test for independence states that there is no relationship between the two variables. With this version of the null hypothesis, the chi-square
Which of the following accurately describes the chi-square test for independence?a. It is similar to a single-sample t test because it uses one sample to test a hypothesis about one population.b. It
Which of the following describes the assumptions and restrictions for a chi-square test for independence?a. Independent observations from a normal distribution.b. Independent observations and no
Under what circumstances is the phi-coefficient used instead of Cramér’s V to measure effect size for the chi-square test for independence?a. Only when the data form a 2 × 2 matrix.b. Only when
Effect size, as measured Cohen’s w, is determined by _______.a. the proportions in the sample datab. the proportions specified by the null hypothesisc. the proportions in the sample data and the
Compute the phi-coefficient or Cramér’s V to measure effect size for the chi-square test for independence.
A chi-square test for independence is conducted for data from a 2 × 2 data matrix with a total of n = 40 participants. If the data produce χ2 = 4.00, then what decision should be made?a. Reject H0
A sample of 100 people is classified by gender (male/female) and by whether or not they are registered voters. The sample consists of 60 females, of whom 50 are registered voters, and 40 males, of
If a chi-square test for goodness of fit has df = 1 then the individuals are classified into ___ categories and if a chi-square test for independence has df = 1 then the individuals are classified
Conduct a chi-square test for independence.
Define the degrees of freedom for the chi-square test for independence and locate the critical value for a specific alpha level in the chi-square distribution.
In a chi-square test for goodness of fit _____.a. Σf e = nb. Σf e = Σf oc. both Σf e = n and Σf e = Σf od. neither Σf e = n nor Σf e = Σf o
The chi-square distribution is ______.a. symmetrical with a mean of zerob. positively skewed with all values greater than or equal to zeroc. negatively skewed with all values greater than or equal to
A researcher uses a sample of 50 people to test whether they see any differences in picture quality for plasma, LED, and LCD televisions. If the data produceχ2 = 5.75, then what decision should the
Conduct a chi-square test for goodness of fit.
Define the degrees of freedom for the chi-square test for goodness of fit and locate the critical value for a specific alpha level in the chi-square distribution.
Data from a recent census indicates that 54% of the adults in the city are women.A researcher selects a sample of n = 200 people who have been selected for jury duty during the past month to
The data for a chi-square test for goodness of fit are called _________.a. observed proportionsb. observed frequenciesc. expected proportionsd. expected frequencies
Occasionally researchers will transform numerical scores into nonnumerical categories and use a nonparametric test instead of the standard parametric statistic.Which of the following is not a reason
Describe the hypotheses for a chi-square test for goodness of fit and explain how the expected frequencies are obtained.
Describe the data (observed frequencies) for a chi-square test for goodness of fit.
A researcher evaluates the significance of a multipleregression equation and obtains an F-ratio with df = 2, 24.How many participants were in the sample?
For the following data, find the multiple-regression equation for predicting Y from X1 and X2. X X Y 3 1 123642 M = 3 45988 7 M=6 8 2603 4 M=4 SS = 28 SS, = 34 18 SS = 16 SP X1X2 SP = 19 XIF SP = 21
For the data in problem 21, the correlation between the number of crimes and population is r = 0.933, which means that r2 = 0.87 (87%) is the proportion of variance in the number of crimes that is
Problem 18 in Chapter 15 (p. 526) presented data showing the number of crimes, the amount spend on crime prevention, and the population for a set n = 12 cities. At that time, we used a partial
A researcher obtained the following multipleregression equation using two predictor variables:Yˆ = 1.1X1 + 3X2 + 4.6. Given that SSY = 280, the SP value for X1 Y is 48, and the SP value for X2 Y is
A multiple-regression equation with two predictor variables produces R2 = .38.a. If SSY = 40 for a sample of n = 20 individuals, does the equation predict a significant portion of the variance for
For the following data:a. Find the regression equation for predicting Y from X.b. Use the regression equation to find a predicted Y for each X.c. Find the difference between the actual Y value and
a. A researcher computes the linear regression equation for a sample of n = 20 pairs of scores, X and Y values. If an analysis of regression is used to test the significance of the equation, what are
a. One set of 10 pairs of scores, X and Y values, produces a correlation of r = 0.60. If SSY = 200, find the standard error of estimate for the regression line.b. A second set of 10 pairs of X and Y
The regression equation is computed for a set of n = 18 pairs of X and Y values with a correlation of r = +0.50 and SSY = 48.a. Find the standard error of estimate for the regression equation.b. How
There appears to be some evidence suggesting that earlier retirement may lead to memory decline(Rohwedder & Willis, 2010). The researchers gave a memory test to men and women aged 60–64 in
Problem 14 in Chapter 15 described a study examining the effectiveness of a 7-Minute Screen test for Alzheimer’s disease. The study evaluated the relationship between scores from the 7-Minute
A professor obtains SAT scores and freshman grade point averages (GPAs) for a group of n = 15 college students. The SAT scores have a mean of M = 580 with SS = 22,400, and the GPAs have a mean of
Problem 13 in Chapter 15 examined the relationship between weight and income for a sample of n = 8 men. Weights were classified in five categories and had a mean of M = 3 with SS = 18.Income,
For the following data:a. Find the regression equation for predicting Y from X.b. Calculate the Pearson correlation for these data.Use r2 and SSY to compute SSresidual and the standard error of
A set of n = 15 pairs of scores (X and Y values) produces a regression equation of Yˆ = 2X + 6.Find the predicted Y value for each of the following X scores:0, 2, 3, and –4.
A set of n = 18 pairs of scores (X and Y values) has SSX = 20, SSY = 80, and SP = 10.If the mean for the X values is MX = 8 and the mean for the Y values is MY = 10.a. Calculate the Pearson
Sketch a graph showing the line for the equation Y = 2X – 1.On the same graph, show the line for Y = –X + 8.
The multiple regression with two predictor variables is computed for a sample of n = 25 participants. What is the value for degrees of freedom for the predicted portion of the Y-score variance,
A multiple regression equation with two predictor variables produces R2 = 0.10.What portion of the variability for the Y scores is predicted by the equation?a. 1%b. 10%c. 90%d. 99%
A multiple regression equation with two predictor variables is calculated for a set of scores. If the constant values in the equation are b1 = 2, b2 = –3, and a = 7, then what Y value would be
A researcher conducts an analysis of regression to evaluate the significance of the regression equation and obtains F = 4.25 with df = 1, 24.How many pairs of X and Y values were in the original
A researcher obtains a correlation of r = 0.60 for a set of n = 18 pairs of X and Y values. If the Y scores have SS = 100, then what is the standard error of estimate for the regression equation for
Conduct an analysis of regression to evaluate the significance of a regression equation.
A set of n = 10 pairs of X and Y scores has SSX = 10, SSY = 60, and SP = 20.What is the slope of the regression equation for these scores?a. 0.50b. 0.33c. 2.00d. 3.00
In the general linear equation, Y = bX +a, what is the value of b called?a. X interceptb. Y interceptc. correlation between X and Yd. slope
Define the equation that describes a linear relationship between two variables.
Showing 1 - 100
of 5401
1
2
3
4
5
6
7
8
9
10
11
12
13
14
15
Last