New Semester
Started
Get
50% OFF
Study Help!
--h --m --s
Claim Now
Question Answers
Textbooks
Find textbooks, questions and answers
Oops, something went wrong!
Change your search query and then try again
S
Books
FREE
Study Help
Expert Questions
Accounting
General Management
Mathematics
Finance
Organizational Behaviour
Law
Physics
Operating System
Management Leadership
Sociology
Programming
Marketing
Database
Computer Network
Economics
Textbooks Solutions
Accounting
Managerial Accounting
Management Leadership
Cost Accounting
Statistics
Business Law
Corporate Finance
Finance
Economics
Auditing
Tutors
Online Tutors
Find a Tutor
Hire a Tutor
Become a Tutor
AI Tutor
AI Study Planner
NEW
Sell Books
Search
Search
Sign In
Register
study help
business
statistics for nursing a practical approach
Statistics For Nursing A Practical Approach 3rd Edition Elizabeth Heavey - Solutions
Identify whether probability or nonprobability sampling is utilized for each entry in the following list:Convenience samplingCluster samplingSimple random samplingQuota samplingSystematic samplingStratified sampling
You conduct a well-designed study involving a random sample. Your analysis shows this sample is normally distributed and representative of the population; however, the mean age in the sample is 29.4 years, and the mean age in the population is 30 years. What is this type of difference called, and
You are asked to develop a study for a pharmaceutical company to determine whether taking one tablet of drug A is related to lower total cholesterol levels.How could you measure your dependent variable quantitatively?a. Would this be a continuous or categorical variable?b. What level of measurement
Elevated serum lead levels in childhood are associated with lower IQ, hyperactivity, aggression, poor growth, diminished academic performance, increased delinquency, seizures, and even death. The neurological damage that occurs cannot be reversed, even once exposure is stopped.You have been asked
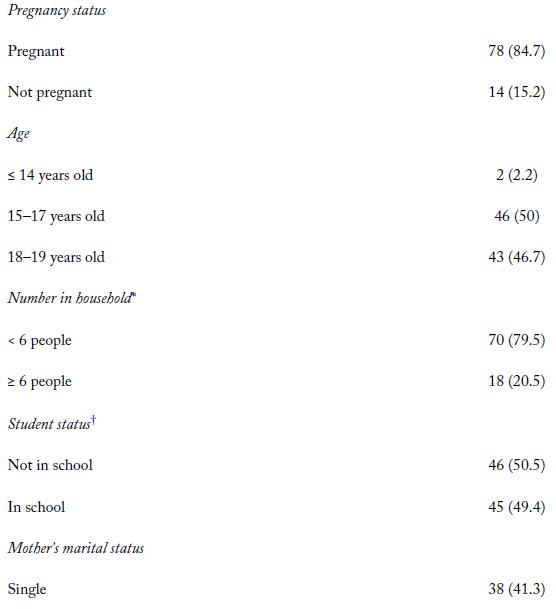
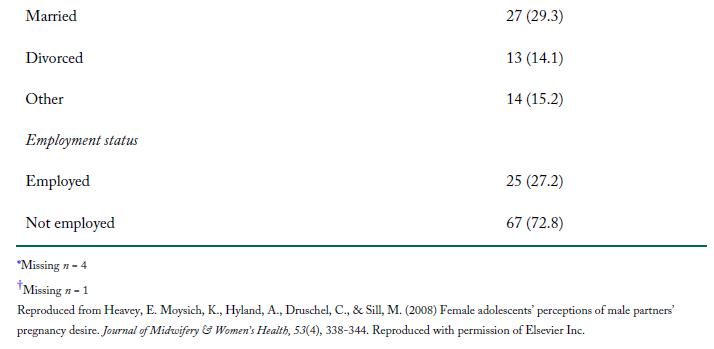
Construct a histogram for the ages of the adolescents. Describe the histogram and what it tells you about this sample population. Why would a histogram be an appropriate choice for presenting this data?See the data in Table 2-7. TABLE 2-7 Demographic Characteristics of 92 Adolescents Completing a
Is the pregnancy status of this group of adolescents typical? Why might that be?See the data in Table 2-7. TABLE 2-7 Demographic Characteristics of 92 Adolescents Completing a Family Planning Survey n (%)
Elevated serum lead levels in childhood are associated with lower IQ, hyperactivity, aggression, poor growth, diminished academic performance, increased delinquency, seizures, and even death. The neurological damage that occurs cannot be reversed, even once exposure is stopped.Why might this
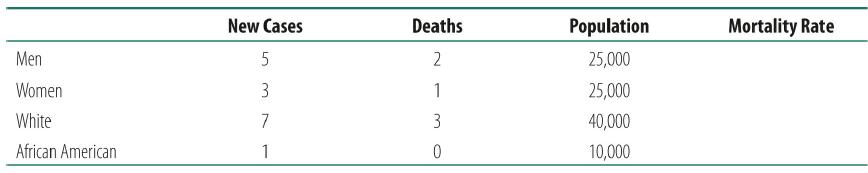
You are tracking melanoma in your county. Calculate the race- and gender-specific mortality rates fromthe data provided in Table 2-10. Men Women White African American New Cases 5 3 7 1 Deaths 2 1 3 0 Population 25,000 25,000 40,000 10,000 Mortality Rate
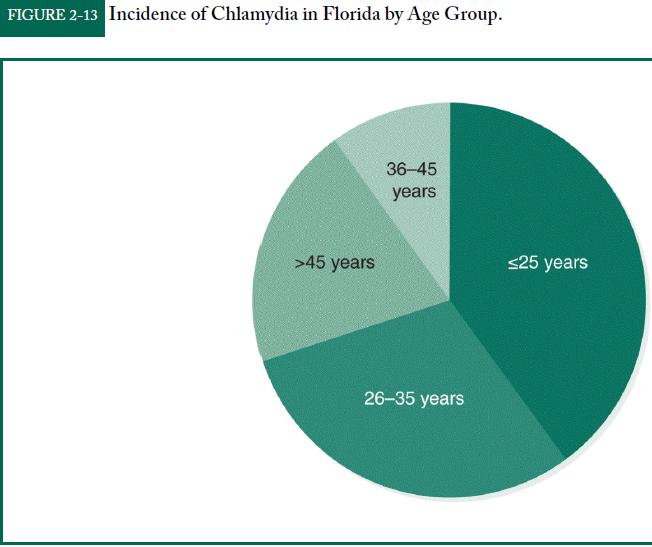
If you were going to design a chlamydia prevention campaign, what age group would you suggest targeting? Why?Refer to the graph in Figure 2-13. FIGURE 2-13 Incidence of Chlamydia in Florida by Age Group. >45 years 36-45 years 26-35 years ≤25 years
Final exam grades are normally distributed with a mean of 81. The standard deviation is 3.What range includes 68% of the sample?
Final exam grades are normally distributed with a mean of 81. The standard deviation is 3.What is the median grade?
A researcher is measuring how many times a minute a person coughs when exposed to cigarette smoke. The results from the study are normally distributed, and they include a mean of 4 and a standard deviation of 2.What is an appropriate measure of central tendency?
A researcher is measuring how many times a minute a person coughs when exposed to cigarette smoke. The results from the study are normally distributed, and they include a mean of 4 and a standard deviation of 2.If instead the results show a mean of 4 and a standard deviation of 1, but they remain
A sample of eight orthopedic patients on your unit includes two patients on intravenous anticoagulants, four patients on oral anticoagulants, and two patients on subcutaneous anticoagulants.Based on this sample, calculate the probability that orthopedic patients are given IV anticoagulants.
A sample of eight orthopedic patients on your unit includes two patients on intravenous anticoagulants, four patients on oral anticoagulants, and two patients on subcutaneous anticoagulants.Calculate the probability that orthopedic patients are given subcutaneous anticoagulants.
A sample of eight orthopedic patients on your unit includes two patients on intravenous anticoagulants, four patients on oral anticoagulants, and two patients on subcutaneous anticoagulants.Hip replacement patients have the same probability of being on oral anticoagulants as the orthopedic patients
A researcher is comparing patients with high medication compliance versus those with low medication compliance in an outpatient psychiatric day program utilizing the Hamilton Anxiety Rating Scale (HAM-A), which has 14 items scored on a scale of 1–4. A higher score on the HAM-A indicates higher
A researcher is comparing patients with high medication compliance versus those with low medication compliance in an outpatient psychiatric day program utilizing the Hamilton Anxiety Rating Scale (HAM-A), which has 14 items scored on a scale of 1–4. A higher score on the HAM-A indicates higher
A researcher is comparing patients with high medication compliance versus those with low medication compliance in an outpatient psychiatric day program utilizing the Hamilton Anxiety Rating Scale (HAM-A), which has 14 items scored on a scale of 1–4. A higher score on the HAM-A indicates higher
You have a new tool that examines outcomes in pregnancy. A previously validated tool reports that cesarean section rates in your area are 30%. The correlation between the old tool and your tool is 0.7. This result indicates which of the following?a. Convergent validityb. Content validityc.
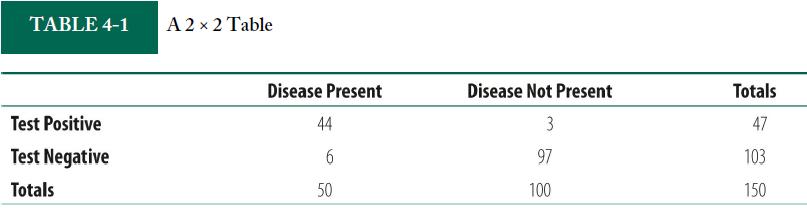
You are developing a new screening test and construct the test results shown in Table 4-1.Without using statistics jargon, explain what each box represents. TABLE 4-1 Test Positive Test Negative Totals A 2×2 Table Disease Present 44 6 50 Disease Not Present 3 97 100 Totals 47 103 150
You are developing a new screening test and construct the test results shown in Table 4-1.What is the specificity of your new test? TABLE 4-1 Test Positive Test Negative Totals A 2×2 Table Disease Present 44 6 50 Disease Not Present 3 97 100 Totals 47 103 150
You are developing a new screening test and construct the test results shown in Table 4-1.What is the positive predictive value of your screening test? TABLE 4-1 Test Positive Test Negative Totals A 2×2 Table Disease Present 44 6 50 Disease Not Present 3 97 100 Totals 47 103 150
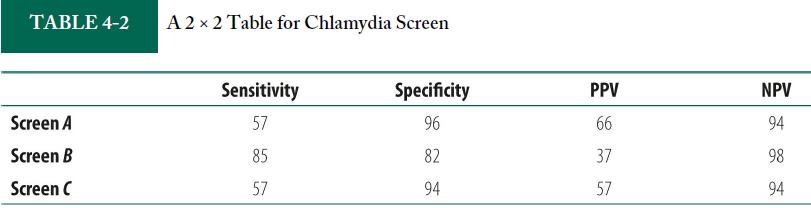
A small study was done to compare the results from three different chlamydia screening tests. The results obtained are shown in Table 4-2.If all the tests are administered in the same manner and cost the same, which one would you recommend that your clinic use? Justify your answer. TABLE 4-2 Screen
You are developing a new screening test and construct the test results shown in Table 4-1.If this disease were fatal, would you be concerned about this prevalence rate? TABLE 4-1 Test Positive Test Negative Totals A 2×2 Table Disease Present 44 6 50 Disease Not Present 3 97 100 Totals 47 103 150
A small study was done to compare the results from three different chlamydia screening tests. The results obtained are shown in Table 4-2.Which screen has the highest positive predictive value? If you administered this screen in a population with a high prevalence, what would you expect to happen
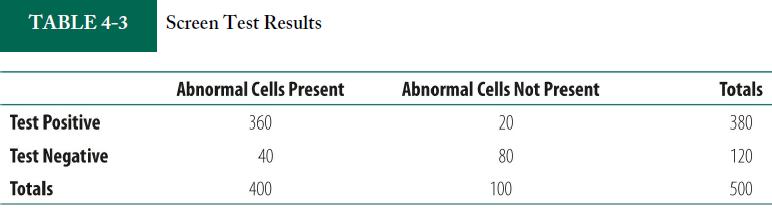
You are using a screening test in your clinic to detect abnormal cervical cells related to the presence of human papilloma virus (HPV). Your results are shown in Table 4-3.What is the sensitivity of the screen? What does this mean in nonstatistical language, or plain English? TABLE 4-3 Test
You are using a screening test in your clinic to detect abnormal cervical cells related to the presence of human papilloma virus (HPV). Your results are shown in Table 4-3.What is the positive predictive value (PPV) of the screen? What does this mean in nonstatistical language, or plain English?
You are using a screening test in your clinic to detect abnormal cervical cells related to the presence of human papilloma virus (HPV). Your results are shown in Table 4-3.What is the efficacy of the screen? What does this mean in nonstatistical language, or plain English? TABLE 4-3 Test
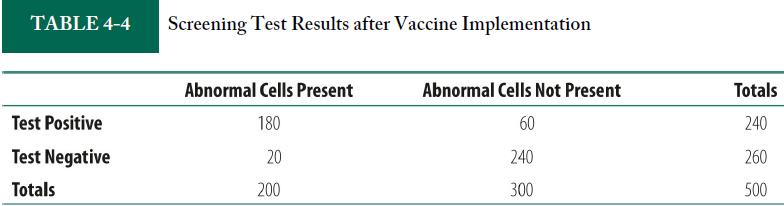
A new vaccine is developed that provides immunity to the virus causing abnormal cervical cells, and you reexamine data 2 years after the vaccine is implemented at your clinic. See the results in Table 4-4.What is the sensitivity of the screen? Does a change in prevalence affect the sensitivity?
A new vaccine is developed that provides immunity to the virus causing abnormal cervical cells, and you reexamine data 2 years after the vaccine is implemented at your clinic. See the results in Table 4-4.What is the PPV of the screen? Does a change in prevalence affect the PPV? How? TABLE 4-4 Test
A new vaccine is developed that provides immunity to the virus causing abnormal cervical cells, and you reexamine data 2 years after the vaccine is implemented at your clinic. See the results in Table 4-4.What happens to the number of false positives when the prevalence rates go down? TABLE
A new vaccine is developed that provides immunity to the virus causing abnormal cervical cells, and you reexamine data 2 years after the vaccine is implemented at your clinic. See the results in Table 4-4.Why might you consider lengthening the time between screens or developing a more specific
A clinical study is established to determine if the results of a screening stress test can be used as a predictor of the presence of heart disease. The study enrolls 100 participants who undergo a screening stress test and then have their disease state confirmed by an angiogram (gold standard).
A clinical study is established to determine if the results of a screening stress test can be used as a predictor of the presence of heart disease. The study enrolls 100 participants who undergo a screening stress test and then have their disease state confirmed by an angiogram (gold standard).
You are studying a new screening instrument and determine the following after screening 135 people. Of the 60 individuals who are known to have the disease, 58 screen positive. One person without the disease screens positive. Seventy-four people without the disease screen negative. Which of the
A clinical study is established to determine if the results of a screening stress test can be used as a predictor of the presence of heart disease. The study enrolls 100 participants who undergo a screening stress test and then have their disease state confirmed by an angiogram (gold standard).
A clinical study is established to determine if the results of a screening stress test can be used as a predictor of the presence of heart disease. The study enrolls 100 participants who undergo a screening stress test and then have their disease state confirmed by an angiogram (gold standard).
What is the difference between probability and nonprobability sampling?
What is the difference between sampling error and sampling bias? Which one is very concerning to researchers?
One study used a convenience sample drawn from clients utilizing two community-based obstetric offices in an area with lower socioeconomic status. The sample was drawn largely from the community surrounding the offices, and the findings may not be generalizable to this population or other
If one of the hospitals in your sample was the regional Women’s and Children’s Hospital, would you expect the mean hemoglobin level collected at that hospital to be different from that of the other hospitals?
You decide to start again comparing the wait time at your clinic this year versus last year, this time programing SPSS to select every 14th patient each year. What type of sample is this? Is it a probability or nonprobability sample?
The researcher in Review Question 12 decides that he wants his sample of 200 to be 50% female and distributes his survey at the bar to the first 100 women who arrive and the first 100 men who arrive. This is what type of sample? Is it a probability or nonprobability sample?
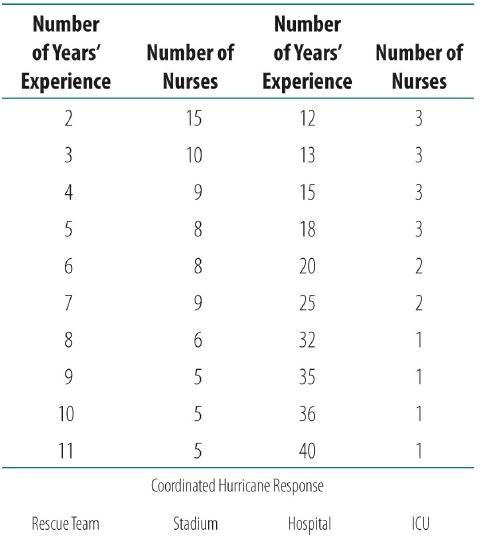
You’ve been recruited by the head of the Federal Emergency Management Agency (FEMA) to act as the head triage nurse for a large city’s hurricane response team. One of your main duties is to decide which nurses will cover which facilities in the overall relief effort. Because most nursing duties
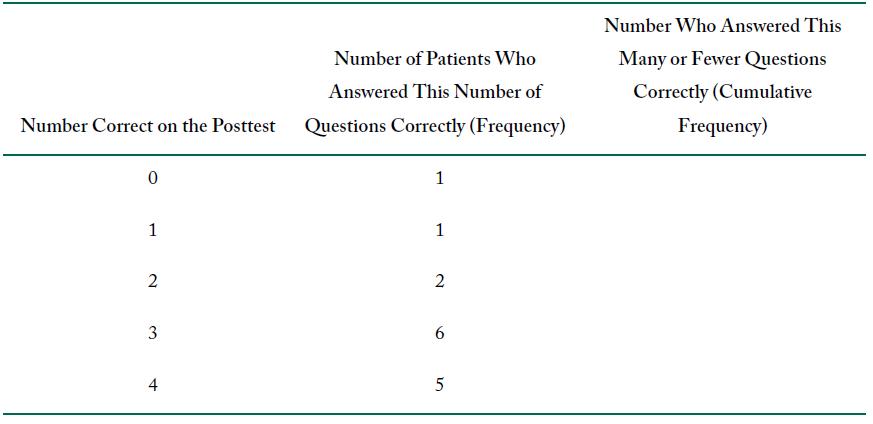
A diabetes educator is working with a group of 15 patients who have been newly diagnosed with type 2 diabetes. She administers a brief pretest, reviews carbohydrate counting with them, and then asks them to complete a posttest assessing their knowledge of the total grams of carbohydrate found in
A diabetes educator is working with a group of 15 patients who have been newly diagnosed with type 2 diabetes. She administers a brief pretest, reviews carbohydrate counting with them, and then asks them to complete a posttest assessing their knowledge of the total grams of carbohydrate found in
A diabetes educator is working with a group of 15 patients who have been newly diagnosed with type 2 diabetes. She administers a brief pretest, reviews carbohydrate counting with them, and then asks them to complete a posttest assessing their knowledge of the total grams of carbohydrate found in
A diabetes educator is working with a group of 15 patients who have been newly diagnosed with type 2 diabetes. She administers a brief pretest, reviews carbohydrate counting with them, and then asks them to complete a posttest assessing their knowledge of the total grams of carbohydrate found in
A researcher examining patients diagnosed with sarcoidosis would like to look at trends in their inflammatory markers. The researcher would like to use a graph that can illustrate the erythrocyte sedimentation rate and the C-reactive protein level for each individual in the study and thus show the
A researcher examining patients diagnosed with sarcoidosis would like to look at trends in their inflammatory markers. The researcher would like to use a graph that can illustrate the erythrocyte sedimentation rate and the C-reactive protein level for each individual in the study and thus show the
An emergency room nurse working in a hospital in the wine region of the Finger Lakes in New York has noticed a seasonal trend for ocular injuries from bottle corks. She would like to illustrate this graphically and develops a histogram. Why might she prefer a histogram to a bar chart?
When the nurse looks at her data and the histogram, it is apparent that more ocular injuries from bottle corks occur in October (which is wine fermentation season) and January. She also notices that more of the injuries involve the right eye. Provide a reasonable explanation for both the January
The nurse would like to determine if more ocular injuries are associated with wine bottles from Sharespeak Winery or with wine bottles from Francesco’s winery. What would be the independent variable?
What would be the dependent variable in review question 23?Data from Question 23The nurse would like to determine if more ocular injuries are associated with wine bottles from Sharespeak Winery or with wine bottles from Francesco’s winery. What would be the independent variable?
Offer a potential explanation for why the race-specific rates may be different for whites and African Americans.
Which group has the lowest incidence of chlamydia? What explanations might the researchers offer about this data?Refer to the graph in Figure 2-13. FIGURE 2-13 Incidence of Chlamydia in Florida by Age Group. >45 years 36-45 years 26-35 years ≤25 years
Which age group has the highest incidence of chlamydia? What explanations might the researchers offer about this data?Refer to the graph in Figure 2-13. FIGURE 2-13 Incidence of Chlamydia in Florida by Age Group. >45 years 36-45 years 26-35 years ≤25 years
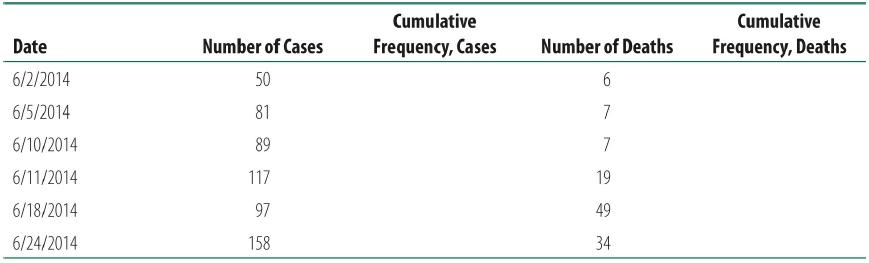
Table 2-12 presents data from the CDC that tracks Ebola cases in Sierra Leone in June 2014. Complete the Cumulative Frequency columns. Date 6/2/2014 6/5/2014 6/10/2014 6/11/2014 6/18/2014 6/24/2014 Number of Cases 50 81 89 117 97 158 Cumulative Frequency, Cases Number of
Your results are 2, 14, 6, 8, 10, 4, 12, 8.What is the median?
Your results are 2, 14, 6, 8, 10, 4, 12, 8.What is the mode?
Your results are 2, 14, 6, 8, 10, 4, 12, 8.Calculate the standard deviation.
Your results are 2, 14, 6, 8, 10, 4, 12, 8.If the sample is normally distributed, 68% of the responses are within what range?
If a study reports that you have a normally distributed sample with a mean age of 17.3 years, what is the median?
A study polls 40 new mothers who attempt to nurse their infants from birth to 6 weeks. Twenty-seven mothers report nursing with minimal pain and frustration, 10 mothers report nursing with moderate pain and frustration, and 3 mothers report discontinuing nursing due to high levels of pain and
A study polls 40 new mothers who attempt to nurse their infants from birth to 6 weeks. Twenty-seven mothers report nursing with minimal pain and frustration, 10 mothers report nursing with moderate pain and frustration, and 3 mothers report discontinuing nursing due to high levels of pain and
A study polls 40 new mothers who attempt to nurse their infants from birth to 6 weeks. Twenty-seven mothers report nursing with minimal pain and frustration, 10 mothers report nursing with moderate pain and frustration, and 3 mothers report discontinuing nursing due to high levels of pain and
A study polls 40 new mothers who attempt to nurse their infants from birth to 6 weeks. Twenty-seven mothers report nursing with minimal pain and frustration, 10 mothers report nursing with moderate pain and frustration, and 3 mothers report discontinuing nursing due to high levels of pain and
A study polls 40 new mothers who attempt to nurse their infants from birth to 6 weeks. Twenty-seven mothers report nursing with minimal pain and frustration, 10 mothers report nursing with moderate pain and frustration, and 3 mothers report discontinuing nursing due to high levels of pain and
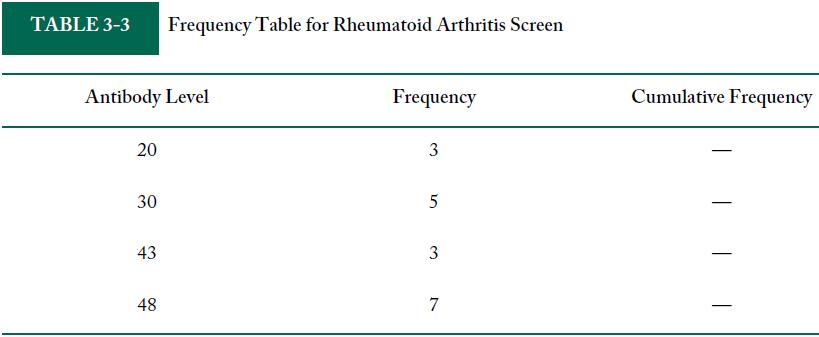
You read a study involving a new screen for rheumatoid arthritis, and the report indicates that those with the disease had the antibody levels shown in Table 3.3.Complete the cumulative frequency column. TABLE 3-3 Antibody Level 20 30 43 Frequency Table for Rheumatoid Arthritis
You read a study involving a new screen for rheumatoid arthritis, and the report indicates that those with the disease had the antibody levels shown in Table 3.3.How many subjects had their antibody levels reported? TABLE 3-3 Antibody Level 20 30 43 Frequency Table for Rheumatoid Arthritis
You read a study involving a new screen for rheumatoid arthritis, and the report indicates that those with the disease had the antibody levels shown in Table 3.3.What antibody level was the mode? TABLE 3-3 Antibody Level 20 30 43 Frequency Table for Rheumatoid Arthritis
You read a study involving a new screen for rheumatoid arthritis, and the report indicates that those with the disease had the antibody levels shown in Table 3.3.What antibody level was the median? TABLE 3-3 Antibody Level 20 30 43 Frequency Table for Rheumatoid Arthritis
You read a study involving a new screen for rheumatoid arthritis, and the report indicates that those with the disease had the antibody levels shown in Table 3.3.What antibody level was the mean? TABLE 3-3 Antibody Level 20 30 43 Frequency Table for Rheumatoid Arthritis
You read a study involving a new screen for rheumatoid arthritis, and the report indicates that those with the disease had the antibody levels shown in Table 3.3.Is this sample normally distributed? TABLE 3-3 Antibody Level 20 30 43 Frequency Table for Rheumatoid Arthritis
Final exam grades are normally distributed with a mean of 81. The standard deviation is 3.What range includes 95% of the sample?
A researcher is measuring how many times a minute a person coughs when exposed to cigarette smoke. The results from the study are normally distributed, and they include a mean of 4 and a standard deviation of 2.What level of measurement is this?
A researcher is measuring how many times a minute a person coughs when exposed to cigarette smoke. The results from the study are normally distributed, and they include a mean of 4 and a standard deviation of 2.Where do 68% of the sample responses fall?
A researcher is measuring how many times a minute a person coughs when exposed to cigarette smoke. The results from the study are normally distributed, and they include a mean of 4 and a standard deviation of 2.The follow-up cohort study reports a mean of 5 and a standard deviation of 1. What would
A sample of eight orthopedic patients on your unit includes two patients on intravenous anticoagulants, four patients on oral anticoagulants, and two patients on subcutaneous anticoagulants.Calculate the probability that orthopedic patients are given oral anticoagulants.
A sample of eight orthopedic patients on your unit includes two patients on intravenous anticoagulants, four patients on oral anticoagulants, and two patients on subcutaneous anticoagulants.Based on this sample, what is the probability that an orthopedic patient will be given some form of
A researcher is comparing patients with high medication compliance versus those with low medication compliance in an outpatient psychiatric day program utilizing the Hamilton Anxiety Rating Scale (HAM-A), which has 14 items scored on a scale of 1–4. A higher score on the HAM-A indicates higher
A researcher is comparing patients with high medication compliance versus those with low medication compliance in an outpatient psychiatric day program utilizing the Hamilton Anxiety Rating Scale (HAM-A), which has 14 items scored on a scale of 1–4. A higher score on the HAM-A indicates higher
A researcher is comparing patients with high medication compliance versus those with low medication compliance in an outpatient psychiatric day program utilizing the Hamilton Anxiety Rating Scale (HAM-A), which has 14 items scored on a scale of 1–4. A higher score on the HAM-A indicates higher
A researcher is comparing patients with high medication compliance versus those with low medication compliance in an outpatient psychiatric day program utilizing the Hamilton Anxiety Rating Scale (HAM-A), which has 14 items scored on a scale of 1–4. A higher score on the HAM-A indicates higher
A researcher is comparing patients with high medication compliance versus those with low medication compliance in an outpatient psychiatric day program utilizing the Hamilton Anxiety Rating Scale (HAM-A), which has 14 items scored on a scale of 1–4. A higher score on the HAM-A indicates higher
You are studying a new screening test. Of the 100 people who do not have a disease, 80 test negative for it with your new screen. Of the 100 people who do have the disease, 90 test positive with your screen.The sensitivity of your screen is ______________________.
Your test is very good at correctly identifying when a person actually has a disease. Your test a measure of which of the following?a. Sensitivityb. Specificityc. Collinearityd. Effect size
Researchers conduct a study to determine if there is a relationship between receiving the flu vaccine and developing the flu within 48 hours. They report a p-value of 0.78. What general impression do you get from this result?
If a person has a disease and tests positive for it, the result is an example of which of the following?a. A true negativeb. A false positivec. A false negatived. A true positive
You are studying a new screening test. Of the 100 people who do not have a disease, 80 test negative for it with your new screen. Of the 100 people who do have the disease, 90 test positive with your screen.Your new screen’s specificity is _______________________.
You are developing a new screening test and construct the test results shown in Table 4-1.How many true positives do you have? TABLE 4-1 Test Positive Test Negative Totals A 2×2 Table Disease Present 44 6 50 Disease Not Present 3 97 100 Totals 47 103 150
You are developing a new screening test and construct the test results shown in Table 4-1.What is the sensitivity of your new test? TABLE 4-1 Test Positive Test Negative Totals A 2×2 Table Disease Present 44 6 50 Disease Not Present 3 97 100 Totals 47 103 150
You are developing a new screening test and construct the test results shown in Table 4-1.Give an example of a clinical situation in which this might be a good test to use. TABLE 4-1 Test Positive Test Negative Totals A 2×2 Table Disease Present 44 6 50 Disease Not
You are developing a new screening test and construct the test results shown in Table 4-1.What is the prevalence of the disease you are testing for? TABLE 4-1 Test Positive Test Negative Totals A 2×2 Table Disease Present 44 6 50 Disease Not Present 3 97 100 Totals 47 103 150
A small study was done to compare the results from three different chlamydia screening tests. The results obtained are shown in Table 4-2.Which screen has the lowest specificity? Why might it still be a good screen to use? TABLE 4-2 Screen A Screen B Screen C A 2×2 Table for Chlamydia
A small study was done to compare the results from three different chlamydia screening tests. The results obtained are shown in Table 4-2.If you know that early treatment helps prevent infertility and that chlamydia is very contagious, would sensitivity or specificity be more important to you? With
You are using a screening test in your clinic to detect abnormal cervical cells related to the presence of human papilloma virus (HPV). Your results are shown in Table 4-3.What is the prevalence of abnormal cells in your clinic? What does this mean in nonstatistical language, or plain English?
You are using a screening test in your clinic to detect abnormal cervical cells related to the presence of human papilloma virus (HPV). Your results are shown in Table 4-3.What is the specificity of the screen? What does this mean in nonstatistical language, or plain English? TABLE 4-3 Test
You are using a screening test in your clinic to detect abnormal cervical cells related to the presence of human papilloma virus (HPV). Your results are shown in Table 4-3.What is the negative predictive value (NPV) of the screen? What does this mean in nonstatistical language, or plain English?
Showing 5100 - 5200
of 5416
First
41
42
43
44
45
46
47
48
49
50
51
52
53
54
55
Step by Step Answers