New Semester
Started
Get
50% OFF
Study Help!
--h --m --s
Claim Now
Question Answers
Textbooks
Find textbooks, questions and answers
Oops, something went wrong!
Change your search query and then try again
S
Books
FREE
Study Help
Expert Questions
Accounting
General Management
Mathematics
Finance
Organizational Behaviour
Law
Physics
Operating System
Management Leadership
Sociology
Programming
Marketing
Database
Computer Network
Economics
Textbooks Solutions
Accounting
Managerial Accounting
Management Leadership
Cost Accounting
Statistics
Business Law
Corporate Finance
Finance
Economics
Auditing
Tutors
Online Tutors
Find a Tutor
Hire a Tutor
Become a Tutor
AI Tutor
AI Study Planner
NEW
Sell Books
Search
Search
Sign In
Register
study help
business
statistics for nursing a practical approach
Statistics For Nursing A Practical Approach 3rd Edition Elizabeth Heavey - Solutions
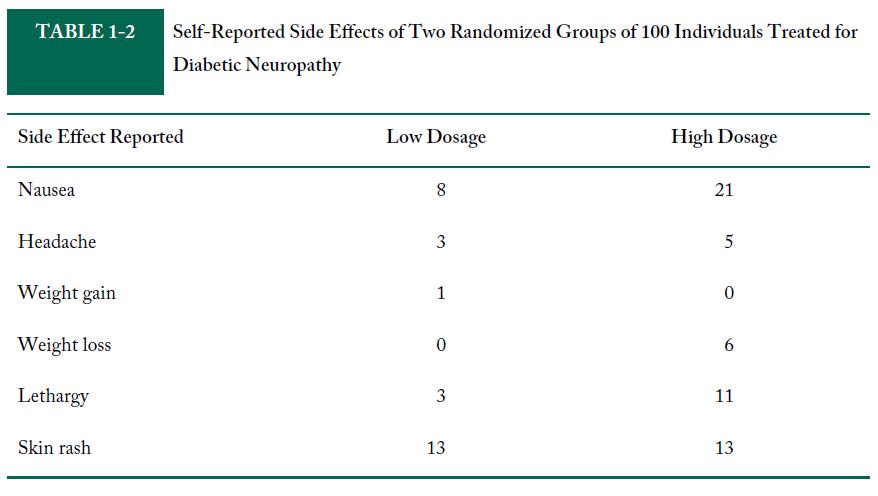
A nurse researcher is assessing how well patients respond to two different dosing regimens of a new drug approved to treat diabetic neuropathy. Two different dosing regimens are administered, and side effects are monitored. Results are shown in Table 1-2.What is the dependent variable in the second
A nurse researcher is assessing how well patients respond to two different dosing regimens of a new drug approved to treat diabetic neuropathy. Two different dosing regimens are administered, and side effects are monitored. Results are shown in Table 1-2.Considering the information you now know
You complete a study in which you categorize the subject’s blood pressure as normal, prehypertensive, high blood pressure stage 1, or high blood pressure stage 2 using the following criteria. What level of measurement is the stage of high blood pressure?
After meeting with your statistician, you measure compliance with the DASH diet on a scale of 1 to 7. For analysis purposes, the dietary compliance variable is now what level of measurement? Why might the statistician have recommended this change?
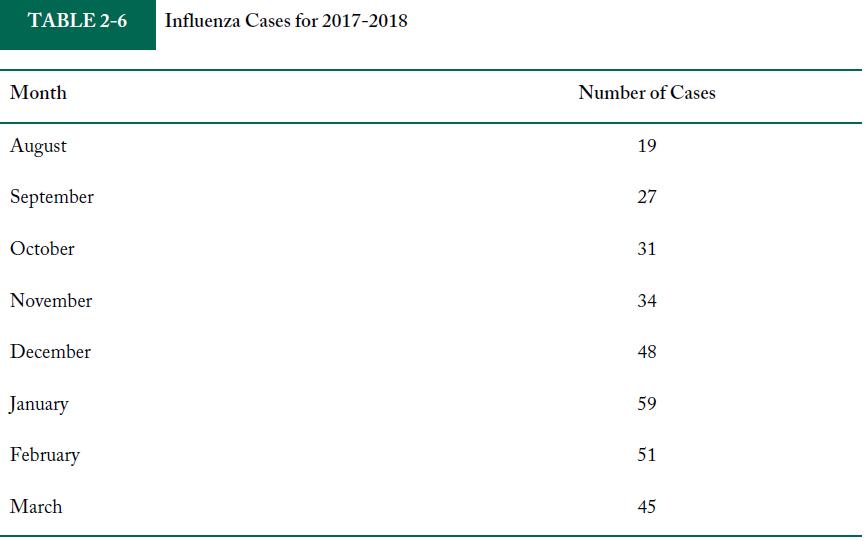
Your community begins a large-scale influenza vaccine effort, and the following year, the number of cases drops see Table 2-6.Construct a line graph showing the data from 2017 and the data from 2018. Compare the two. TABLE
You are now interested in examining compliance with a DASH diet. You ask your subjects if they have or have not complied with the diet this week. Your dietary compliance variable is what level of measurement?
What is your dependent variable? Is it continuous or categorical?Statistics: Is what you observe what you expected? I know the manager said you need to learn to relax but I don't think this is what he expected.
You conclude your study by examining how compliance with the DASH diet affects the stage of high blood pressure. What is your independent variable?
Thirty fathers were asked about the highest level of education they had completed. Ten completed only elementary school, 10 completed elementary and high school, 7 completed all levels through college, and 3 completed all levels through graduate school. What was the cumulative percentage of fathers
Use the frequency distribution in Table 2-5 to construct a bar chart for influenza cases in your hospital during 8 months in 2017-2018. Would your chart look different if it were a histogram? Discuss at least one rationale for selecting either a bar chart or a histogram to present this data. TABLE
In your study of 40 people, 8 had no cold symptoms, 12 had mild cold symptoms, 9 had moderate cold symptoms, and 10 had severe cold symptoms. One patient was lost to follow-up, and no data could be collected. What percentage of patients reported cold symptoms?
Your community begins a large-scale influenza vaccine effort, and the following year, the number of cases drops see Table 2-6.Why didn’t the numbers change significantly for August and September? TABLE 2-6 Month August September October November December January February March Influenza Cases for
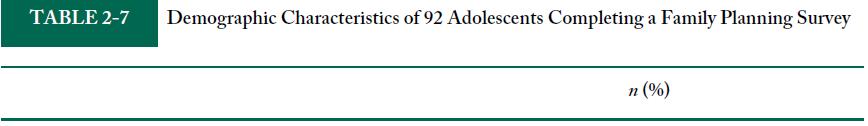
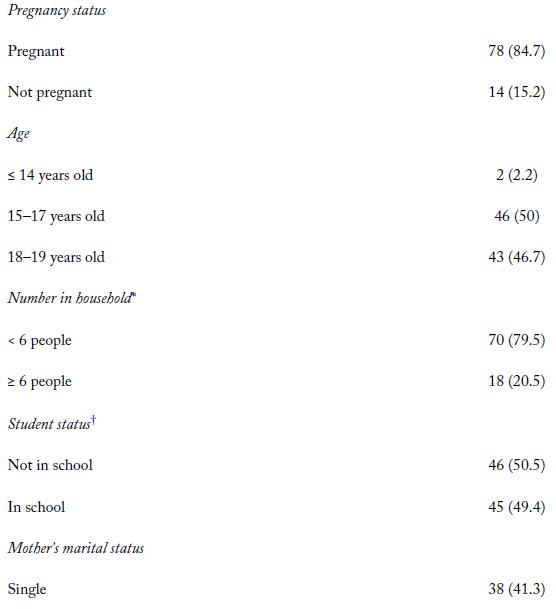
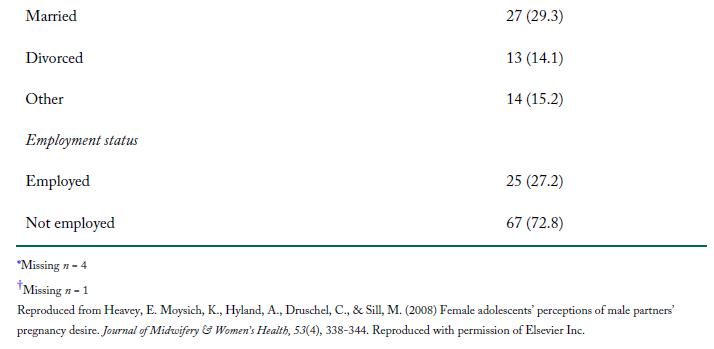
What percentage of the adolescents are employed? What percentage of the adolescents are in school? Are these variables quantitative or qualitative? Round to the nearest tenth of a percent.See the data in Table 2-7. TABLE 2-7 Demographic Characteristics of 92 Adolescents Completing a Family Planning
Your community begins a large-scale influenza vaccine effort, and the following year, the number of cases drops see Table 2-6.Do you consider the vaccine effort to be successful? Why? TABLE 2-6 Month August September October November December January February March Influenza Cases for
Identify the level of measurement of each variable.See the data in Table 2-7. TABLE 2-7 Demographic Characteristics of 92 Adolescents Completing a Family Planning Survey n (%)
Could any of these variables have been measured as continuous quantitative variables?See the data in Table 2-7. TABLE 2-7 Demographic Characteristics of 92 Adolescents Completing a Family Planning Survey n (%)
Showing 5400 - 5500
of 5416
First
41
42
43
44
45
46
47
48
49
50
51
52
53
54
55
Step by Step Answers