New Semester
Started
Get
50% OFF
Study Help!
--h --m --s
Claim Now
Question Answers
Textbooks
Find textbooks, questions and answers
Oops, something went wrong!
Change your search query and then try again
S
Books
FREE
Study Help
Expert Questions
Accounting
General Management
Mathematics
Finance
Organizational Behaviour
Law
Physics
Operating System
Management Leadership
Sociology
Programming
Marketing
Database
Computer Network
Economics
Textbooks Solutions
Accounting
Managerial Accounting
Management Leadership
Cost Accounting
Statistics
Business Law
Corporate Finance
Finance
Economics
Auditing
Tutors
Online Tutors
Find a Tutor
Hire a Tutor
Become a Tutor
AI Tutor
AI Study Planner
NEW
Sell Books
Search
Search
Sign In
Register
study help
business
statistics informed decisions using data
Foundations Of Statistics For Data Scientists With R And Python 1st Edition Alan Agresti - Solutions
Explainthelogicunderlyinginvertingpermutationteststoobtainaconfidenceintervalforthe difference betweentwopopulationmeans.Illustratethemethodbyfindingthe95%confidence intervalforthedifferencebetweenmeaninteractiontimesforpettingandpraiseofdogsusing the datain Section 5.8.2. Comparewithresultsfroma t
RefertoExercise5.44anditsscenarioof n1 = n2 = 4 with y1 = 5 and y2 = 10.(a) Constructtwo scenarios suchthatthetwo-sidedpermutationtestcomparingmeanswould have(i) P-value < 0.05, (ii) P-value > 0.05.(b) Createascenariosuchthatthe P-valueforthepermutationtestwouldbetheminimum possiblebutthe
Explainthelogicunderlyingthepermutationtesttocomparetwodistributions.Compareits assumptions withthoseofthetwo-sample t test.
ExplainwhytheconfidenceintervalbasedontheWaldtestof H0: θ = θ0 is symmetricaroundˆθ (i.e., havingcenterexactlyequalto ˆθ. Thisisnottruefortheconfidenceintervalsbasedon the likelihood-ratioandscoretests.)Explainwhysuchsymmetrycanbeproblematicwhen θand ˆθ are
Foralargenumber n of independentPoissonrandomvariables {Yi}, with μ = E(Yi), consider testing H0: μ = μ0.(a) Showthatthescoreteststatisticis Z =ºn( ¯ Y − μ0)~ºμ0.(b) Showthatthe Waldteststatisticis Z =ºn( ¯ Y − μ0)~º¯ Y . Under H0, why wouldyou
Fortwocategoricalvariables X and Y , let πij = P(X = i, Y = j), i = 1, ...,r, j = 1, ...,c.Consider H0: πij = P(X = i)P(Y = j) for all i and j with n observationshavingcellcounts{yij}. Usingthemultinomialdistributionfor {yij} and theMLestimatefor πij of ˆπij,0 =(yi+~n)(y+j~n) under H0 and
Fora c-category variable,considertesting H0: π1 = π10, ...,πc = πc0 when counts (y1, ...,yc)haveamultinomialdistribution(2.14)with n = Σj yj .(a) UsingtheresultthattheMLestimateof πj is the jth sampleproportion yj~n, showthat the likelihood-ratiostatisticfortesting H0 iswith df = c−1 for
Derivethelikelihood-ratiotestof H0: π1 = π2 for independent Y1 ∼ binom(n1, π1) and Y2 ∼binom(n2, π2).
Adataanalystassumesthatthe n independentobservationsinadatafilecomefromaPoisson distribution.(a) Derivethelikelihood-ratiostatisticfortesting H0: μ = μ0 against Ha: μ ≠ μ0.(b) Simulatetheexactdistributionoftheteststatisticin(a)for n = 25, when μ0 = 3.0.(Section A.5.2 of the R
Whenarticlesinthemassmediaaboutmedicalstudiesreportlargedangersofcertainagents(e.g., coffeedrinking),laterresearchoftensuggeststhattheeffectsaresmallerthanfirstbe-lieved,ormaynotevenexist.Explainwhy.
Somejournalspublishresearchresultsonlyiftheyachievestatisticalsignificanceatthe0.05α-level.Explain publicationbias and itsdangers.
Inanevaluationof32schoolsinacountyoverthepastfiveyearsaccordingtothemean score ofseniorstudentsonastandardizedachievementtest,onlyoneschoolperformedabove the medianinallfiveyears.Explainwhatismisleadingaboutaconclusionthatthatschool
Aresearchstudyconducts40significancetests.Ofthese,onlytwoaresignificantatthe0.05 level.Theauthorswriteareportaboutthosetworesults,notmentioningtheother38tests.Explain whatismisleadingabouttheirreport.
Aresearcherconductsasignificancetesteverytimesheanalyzesanewdataset.Overtime, she conducts100significancetests,eachatthe0.05level.If H0 is trueineverycase,whatis the probabilitydistributionofthenumberoftimessherejects H0, andhowmanytimeswould weexpect H0 to berejected?
Youplantotest H0: μ1 = μ2. Whenyourresearchhypothesisisthat μ1 > μ2, ifyouarecorrect, explain whyyouwillhavegreaterpowerifyouuse Ha: μ1 > μ2 instead of Ha: μ1 ≠ μ2.
to explainwhy P(TypeII error) increasestoward0.95as μ decreases toward0.
Fortesting H0: μ = 0 against Ha: μ > 0 with α = 0.05, use Figure
as π gets closertothe H0 valueof0.50.(c) Set π = 0.60. Report P(TypeIIerror)for n equal to(i)50,(ii)100,(iii)200,and summarize theimpactof n on P(TypeIIerror).
with samplesize100, and set P(TypeIerror) = α = 0.05. Theappshowsthenullsamplingdistributionof ˆπ and the actual samplingdistributionof ˆπ for varioustruevaluesof π. Clickon Show TypeIIerror, and it alsodisplays P(TypeIIerror).(a)
and Ha: π >
Usethe ErrorsandPower app at www.artofstat.com/web-apps to investigatetheperformance of significancetests.Setthehypothesesas H0: π =
Medicaltestsfordiagnosingconditionssuchasbreastcancerarefallible,justlikedecisions in significancetests.Identify(H0 true, H0 false) withdisease(absent,present),and(Reject H0, Donotreject H0) withdiagnostictest(positive,negative).Inthiscontext,explainthe difference
Criminaldefendantsareconvictedifthejuryfindsthemtobeguilty“beyondareasonable doubt.”Ajuryinterpretsthistomeanthatifthedefendantisinnocent,theprobabilityof beingfoundguiltyshouldbeonly1inabillion.Describeanydisadvantagethisstrategyhas.
Foramatched-pairs t test (Exercise5.16),let σ2 = var(Yi1) = var(Yi2) and ρ = corr(Yi1, Yi2).Using theresultfromExercise2.63thatfortworandomvariables Y1 and Y2, var(Y1 − Y2) =var(Y1) + var(Y2) − 2cov(Y1, Y2), showthatvar(Y 1 − Y 2) = var(d) = 2σ2(1 − ρ)~n. Explainhow this indicates that
Refertothepreviousexerciseandthe P-valueof0.057.(a) Explainwhythe P-valueisthesmallest α-levelatwhich H0 can berejected.(b) Explainwhythe94.3%confidenceintervalisthenarrowestconfidenceintervalfor μ that contains μ0 = 100.
level.
Arandomsampleofsize40has y = 120. The P-valuefortesting H0: μ = 100 against Ha:μ ≠ 100 is 0.057. Explainwhatisincorrectabouteachofthefollowinginterpretationsofthis P-value,andprovideaproperinterpretation.(a) Theprobabilitythat H0 is correctequals0.057.(b) Theprobabilitythat y = 120 if H0 is
at μ = 4. Then:(a) At μ = 5, β > 0.36.(b) If α = 0.01, thenat μ = 4, β > 0.36.(c) If n = 50, thenat μ = 4, β > 0.36.(d) Thepowerofthetestis0.64at μ = 4.(e) Thismustbefalse,becausenecessarily α + β = 1.
Let β denote P(TypeIIerror).Foran α = 0.05-leveltestof H0: μ = 0 against Ha: μ > 0 with n = 30 observations, β =
Weanalyzewhetherthedischargeofarsenicintheliquideffuentfromanindustrialplant exceeds thecompanyclaimofameanof10 mg perliter.Forthedecisionintheone-sidedtest using α = 0.05:(a) Iftruly μ = 10, withprobability0.05wewillconcludethattheyareexceedingthelimit.(b) Iftruly μ = 10,
Resultsof99%confidenceintervalsformeansareconsistentwithresultsoftwo-sidedtestswith which α-level?Explaintheconnection.Selectthecorrectresponse(s)inthenexttwoexercises.(Morethanonemaybecorrect.)
Fortesting H0: P(Y = j S X = i) = P(Y = j) for all i and j, thatis, homogeneity of the conditional distributionsofa c-category responsevariableatthe r categories ofanexplanatory variable,comparethenumberofparametersunder Ha and under H0 to find df for thechi-squared test.
FortheBayesianmodelforcomparingmeansin Section 5.3.4, explainwhythepriorand posterior P(μ1 = μ2) = 0.
Constructtwoscenariosofindependentsamplesoffourmenandfourwomenwith y = number of hoursspentonInternetinpastweekhaving y1 = 5 and y2 = 10, suchthatfor testing H0 ∶μ1 = μ2 against Ha ∶ μ1 ≠ μ2, (a) P-value < 0.05, (b) P-value > 0.05. Howdothewithin-groups variabilitydifferinthetwocases?
Explainwhy the terminology“donotreject H0” ispreferableto“accept H0.”
Small P-valuesindicatestrongevidenceagainst H0, becausethedatawouldthenbeunusual if H0 weretrue.Whydoesitnotmakesensetodefinea P-valueastheprobabilitythatthe test statisticequalsthe observedresult (when H0 is true)ratherthanasthetailprobability that theteststatisticequalsthe
Abook44 on methodsformodelingsurvivaltimesdiscussedanexamplecomparingtimesof remission (inweeks)ofleukemiapatientstakingadrugorcontrol.Thedata,withcensored observationsindicatedbythe“+”sign,are:Treatment: 6+, 6, 6, 6, 7, 9+, 10+, 10, 11+, 13, 16, 17+, 19+, 20+, 22, 23, 25+, 32+, 32+, 34+,
Fortheexamplein Section 5.8.4, thesubjecttakingthedrugwhowascensoredafter4months is nowfoundtohavehadasurvivaltimeof11months.(a) Conductasignificancetestofidenticalsurvivaldistributions.Interpretthe P-value.(b) Giveanexampleofanadditionalchangeinthedatathatwouldhavenofurthereffecton the testresult.
and showtherelationtothe95%confidence intervalforthecomparison.(b) Sincethedistributionofsellingpriceseemsskewedright,conductapermutationtestto compare thepopulationmedians.Interpret.
The Houses data fileatthebook’swebsitelists,for100homesalesinGainesville,Florida, severalvariables,includingthesellingprice(inthousandsofdollars)andwhetherthehouseis new (1 = yes,0 = no).(a) Basedongraphicalornumericaldescriptivestatistics,useanappropriatemethodwith the t distribution tofindthe
Refertothepettingversuspraiseofdogsexamplein Section 5.8.2.(a) Forthe14timesobserved,showthepartitioningofthevaluestothetwogroupsforwhich the P-valuewouldbesmallest.Whatisthat P-value?(b) Forthispartitioning,usethebootstraptoconstructa95%confidenceintervalforthe difference
Section 5.3.2 used a t test tocomparecognitivebehavioralandcontrolgroupsforanorexia patients.Usingsimulationwithsoftwareorwiththe Permutation Test app at www.artofstat.com/web-apps, conducttheanalogouspermutationtestcomparing(a) means,(b) meanranks(Wilcoxontest).Statehypotheses,interpret
Foran α = 0.05-levellikelihood-ratiotestof H0: θ = θ0 using thelikelihoodfunctionvaluesℓ(ˆθ) and ℓ0 = ℓ(θ0), explainwhythecorresponding95%confidenceintervalfor θ is thesetofθ0 for which ℓ(ˆθ)~ℓ(θ0) ≤ exp(3.84~2) = 6.8, where3.84isthe0.95quantileforachi-squared distribution
Aremanymedical“discoveries”actuallyTypeIerrors?Inmedicalresearch,suppose43 that an actualpopulationeffectexistsonly10%ofthetimeandthatwhenaneffecttrulyexists, the chanceofmakingaTypeIIerrorandfailingtodetectit(perhapsbecauseofinsufficient sample
JonesandSmithseparatelyconductstudiestotest H0: μ = 500 against Ha: μ ≠ 500, eachwith n = 1000. Jonesgets y = 519.5, with se = 10.0. Smithgets y = 519.7, with se = 10.0.(a) Showthat the P-valueis0.051forJonesand0.049forSmith.Using α = 0.050, foreach study
against Ha: π ≠ 0.50, each with n = 400. Jonesgets ˆπ = 220~400 = 0.550. Smithgets ˆπ = 219~400 = 0.5475.(a) Showthatthe P-valueis0.046forJonesand0.057forSmith.Using α = 0.05, indicatein eachcasewhethertheresultis“statisticallysignificant.”Usingthis,explainthemisleading
JonesandSmithseparatelyconductstudiestotest H0: π =
Section 5.5.5 mentionedastudyaboutwhetherastrologerscanpredictthecorrectpersonality chartforagivenhoroscopebetterthanbyrandomguessing.(a) Inthewordsofthatstudy,whatwouldbea(i)TypeIerror?(ii)TypeIIerror?(b) Ifwedecrease α from 0.05to0.01,towhatvaluedoes P(TypeIIerror)increase?
Astudy42 compared populationdynamicsofthethreatenedspeciesSootyFalcononFahal Island andtheDaymaniyatislandsintheSeaofOmanduring2007-2014.Theclutchsizeshad mean andstandarddeviation2.660and0.618onFahalIsland(n = 100) and2.920and0.787 on theDaymaniyatislands(n = 53).
The2018General SocialSurveyasked1136subjectswhethertheybelieveinheavenandwhether they believeinhell.Ofthem,804said yes to both,209said no to both,113said yes to heaven and no to hell,and10said no to heavenand yes to hell.(a) Showthedataina2×2 contingencytable.Denotethepopulationproportionssaying
Astudyof100womensufferingfromexcessivemenstrualbleedingconsiderswhetheranew analgesic providesgreaterreliefthanthestandardanalgesic.Ofthewomen,40reportedgreater relief withthestandardanalgesicand60reportedgreaterreliefwiththenewone.Testthe
The Afterlife data fileatthebook’swebsiteshowsdatafromthe2018GeneralSocialSurvey on postlife = beliefintheafterlife(1 = yes,2 = no), religion(1 = Protestant,2 = Catholic, 3 =Jewish, othercategoriesexcluded),andgender(1 = male, 2 = female). Analyzethesedatawith
Forthedatainthe PartyID data fileatthebook’swebsite,usesignificancetestingandesti-mation methodstoanalyzetherelationshipbetweenpoliticalpartyaffiliationandrace.
Usingthe GSS2018 data file,crossclassifythe2016voteforPresident(PRES16, with1 = Clinton, 2 = Trump,3 = Other, 4 = Never)bysex(1 = male, 2 = female).(a) Formthecontingencytableandreporttheconditionaldistributionsonthevote.(b)
Withthedataintheexamplein Section 5.4.5, conductandinterpretthePearsonchi-squared test (a) comparingdivorced/separatedwithnevermarriedonhappiness;(b) comparingmarried with divorced/separatedandnevermarriedcombined.(Thesumofthetwo X2 statistics, with df = 2 +2 = 4, approximatelyequals X2 for
Fortheexamplein Section 5.4.5, interpretthestandardizedresidualsforthe not toohappy category.
Usethe Happy data filefromthe2018GeneralSocialSurveyatthetextwebsitetoforma contingencytablethatcrossclassifieshappinesswithgender.For H0: independencebetween happiness andgender:(a) Conductandinterpretthechi-squaredtest.(b) Showtheestimatedexpectedfrequenciesandstandardizedresiduals,andformamosaic
The Substance data fileatthebook’swebsiteshowsacontingencytableformedfromasurvey that askedasampleofhighschoolstudentswhethertheyhaveeverusedalcohol,cigarettes, and marijuana.Findthe P-valuefortestingwhetheradifferenceexistsbetweenthosewho
InExercise5.4,133ofthe429identifyingasRepublicansand429ofthe487identifyingas Democratsstatedclimatechangeisamajorthreat.Showhowtodisplaytheresultsina contingencytable,andusechi-squaredtotestwhetheropinionisindependentofpolitical party.Interpret.
Refertothepreviousexercise.Usinguniformpriordistributions,findtheposteriorprobability that thepopulationproportionbelievinginlifeafterdeathishigherforfemalesthanformales.
Inthe2018GeneralSocialSurvey,whenaskedwhethertheybelievedinlifeafterdeath,1017 of 1178femalessaid yes, and703of945malessaid yes. Testthatthepopulationproportions are equalforfemalesandmales.Reportandinterpretthe P-value.
Usingthe Anorexia data fileatthetextwebsite:(a) Test H0: μ1 = μ2 against Ha: μ1 ≠ μ2 for theweightchangeswiththefamilyandcognitive behavioraltherapies.Reportandinterpretthe P-value,andgivethedecisionfor α = 0.05.If thedecisionisinerror,whattypeoferrorisit?(b)
Ideally,resultsofastatisticalanalysisshouldnotdependgreatlyonasingleobservation.Ina sensitivity study, were-dotheanalysisafterdeletinganoutlierfromthedatasetorchangingits valuetoamoretypicalvalueandcheckingwhetherresultschangemuch.Fortheanorexiadata analysis in Section 5.3.2,
Anexperiment40 used asampleofcollegestudentstoinvestigatewhethercellphoneuseimpairs drivers’reactiontimes.Onamachinethatsimulateddrivingsituations,atirregularperiods a targetflashedredorgreen.Participantswereinstructedtopressabrakebuttonassoonas
cm (63.7 inches)forwomen,withstandarddeviationabout7 cm for eachgroup.For all finishersintheBostonMarathonsince1972,thetimetofinishhasameanof221minutes for
Arecentreport39 estimated meanadultheightsintheU.S.of175.4 cm (69.1 inches)formen and
The Income data fileatthebook’swebsiteshowsannualincomesinthousandsofdollarsfor subjectsinthreeracial-ethnicgroupsintheU.S.(a) Statingallassumptionsincludingtherelativeimportanceofeach,showallstepsofasig-nificance testforcomparingpopulationmeanincomesofBlacksandHispanics.Interpret.(b)
FromGSSresultsat sda.berkeley.edu/archive.htm, politicalideology(POLVIEWS,with 1 = extremely liberaland7 = extremely conservative)hadmeanandstandarddeviationby politicalpartyidentification(PARTYID)(3.74,1.39)forthe229strongDemocratsin1974,(4.76,
Theexamplein Section 3.1.4 describedanexperimenttoestimatethemeansaleswitha proposedmenuforanewrestaurant.Inarevisedexperimenttocomparetwomenus,onTuesday of theopeningweektheownergivescustomersmenuAandonWednesdayshegivesthemmenu B. Thebillsaverage$22.30forthe43customersonTuesday(s = 6.88)
Usedescriptivestatisticsandsignificanceteststocomparethepopulationmeanpoliticalide-ology foreachpairofgroupsin Table5.2 using the Polid data file.Summarizeresultsusing P-valuesandusinganon-technicalexplanation.
AstudyofsheepmentionedinExercise1.27analyzedwhetherthesheepsurvivedforayear from theoriginalobservationtime(1 = yes,0 = no) asafunctionoftheirweight(kg) atthe original observation.Statinganyassumptionsincludingtheconceptualpopulationofinterest, use a t test withthedatainthe Sheep data
than P-value = 0.4173545.
Theoutputofa t significance testreportsa P-valueof0.4173545.Insummarizingthetest, explain whyitismoresensibletoreport P-value =
Forthe Students data fileatthetextwebsite,analyzepoliticalideology.(a) Testwhetherthepopulationmean μ differs from4.0,themoderateresponse.Reportthe P-value,andinterpret.Makeaconclusionusing α-level = 0.05.(b) Constructthe95%confidenceintervalfor μ. Explainhowresultsrelatetothoseofthe test in(a).
Youwanttoknowwhetheradultsinyourcountrythinktheidealnumberofchildrenisequal to 2,ontheaverage,orhigherorlowerthanthat.(a) Definingnotation,state H0 and Ha for investigatingthis.(b) SoftwareshowstheseresultsforresponsesinarecentGSStothequestion,“Whatdoyou think
to determinewhichstatehasgreaterevidencesupportinga Republican victory.Explainyourreasoning.(b) ConductaBayesiananalysistoanswerthequestionin(a)byfindingineachcasethe posterior P(π < 0.50), correspondingtothe P-valuein(a).Usebeta(50,50)priors,which
against Ha: π >
BeforeaPresidentialelection,pollsaretakenintwoswingstates.TheRepublicancandidate waspreferredby59ofthe100peoplesampledinstateAandby525of1000sampledinstate B. Treattheseasindependentbinomialsamples,wheretheparameter π is thepopulation proportionvotingRepublicaninthestate.(a)
Inthescientifictestofastrologydiscussedin Section 5.5.5, theastrologerswerecorrectwith 40 oftheir116predictions.Test H0: π = 1~3 against Ha: π > 1~3 to analyzewhethertheir predictions werebetterthanexpectedmerelybychance.Findthe P-value,makeadecision using α = 0.05, andinterpret.
Theexamplein Section 5.2.2 could notdeterminewhetheramajorityorminorityofAmericans consider climatechangetobeamajorthreat.However,thisisclearerforparticulargroups.A surveybyPewResearchCenterinMarch2020reportedthat88%ofthe487Democrats and
Same-sexmarriagewaslegalizedacrossCanadabytheCivilMarriageActenactedin2005.Is this supportedbyamajority,oraminority,oftheCanadianpopulation?Ina2017surveyof 3402 Canadians(https://sondage.crop.ca), 73%supported the act.Analyzetheresultswith a significancetest,statinganyassumptions,andinterpretthe
against Ha: π ≠ 0.50. Interpretthe P-value.Isitappropriateto“accept H0? Whyorwhynot?
Whenagovernmentdoesnothaveenoughmoneytopayfortheservicesthatitprovides,it can raisetaxesoritcanreduceservices.WhentheFloridaPollaskedarandomsampleof1200 Floridians whichtheypreferred,52%(624ofthe1200)chose raisetaxes and 48%chose reduce services. Let π denote
Introducingnotationfor a parameter,statethefollowinghypothesesintermsoftheparameter valuesandindicatewhetheritisanullhypothesisoranalternativehypothesis.(a) TheproportionofalladultsintheUKwhofavorlegalizedgamblingequals0.50.(b)
Refertothepreviousexercise.Fortheabsolute-errorlossfunction L(θ, ˆθ) = Sθ − ˆθS, showthattheBayesestimatorof θ is themedianoftheposteriordistribution.
Abasicelementin statisticaldecisiontheory is the loss function for astatisticaldecision.In thecontextofestimation,acommonlossfunctionforanestimator ˆθ of aparameter θ is the squared-error loss, L(θ, ˆθ) = (ˆθ − θ)2.The lossfunctionreferstoasinglesample,andtoevaluate ˆθ,
Apointestimator ˆθ is locationinvariant if forallpossibledataandallconstantsc, when weadd c to eachobservation,theestimatorincreasesbyc. Itis scaleinvariant if whenwe multiplyeachobservationby c > 0, theestimatormultipliesby c.(a) Showthat Y is locationinvariantand S is scaleinvariant.(b)
Explainhowusingastandardnormalpivotalquantityintheformwouldleadtoa one-sided 95% confidenceintervalfor θ. UsethisideatogetaWald95%lowerconfidenceboundforthepopulationproportionsupportinglegalizationofmarijuanain Exercise 4.5. T(Y)-8 T(Y)-0 P
Forthemultinomialdistribution(2.14)withcounts {yj} in c categories satisfying Σj yj = n, Bayesianmethodsoftenusethe Dirichlet distribution as apriordistributionfor (π1, ...,πc}, p(π1, ...,πc;α1, ...,αc) ∝ πα1−1 1 πα2−1 2 ⋯παc−1 c , 0 ≤ πj ≤ 1, Σjπj = 1, for
Fora continuousdistribution,explainwhythenumberofobservationsthatfallbelowthe populationmedianhasabinom(n, 0.50) distribution.Ifweordertheobservationsinmagnitude, giving the orderstatistics Y(1) ≤ Y(2) ≤ ⋯ ≤ Y(n), explainwhytheprobabilityisabout0.95that the interval (Y(a), Y(b))
Themomentgeneratingfunctionofa χ2 d random variableis md(t) = (1 − 2t)−d~2 for t < 1~2.Supposethat U and V are independent,with U ∼ χ2 d1 and U + V ∼ χ2 d1+d2 . FromExercise3.45, mU+V (t) = mU(t)mV (t). Showthat V ∼ χ2 d2 .
Thefamilyofprobabilitydistributionshaving pdf of form f(y; θ) = B(θ)h(y) exp[Q(θ)R(y)]is calledthe exponentialfamily. The naturalexponentialfamily is thespecialcase Q(θ) = θand R(y) = y, with θ called the naturalparameter.(a)
Let Z denote astandardnormalrandomvariable,whichhas pdf ϕ(z) = (1~º2π) exp(−z2~2)and cdf Φ. Recallthat Y = Z2 has a χ21 distribution.(a) Explainwhythe cdf of Y for y ≥ 0 is F(y) = Φ(ºy) − Φ(−ºy).(b) Takingthederivative, showthatthe pdf of Y is24 f(y) = (1~ºy)[ϕ(ºy) + ϕ(−ºy)]
Refertothedefinitionsofchi-squaredand T random variablesin Section 4.4.5.(a) Fromtherepresentation (Z2 1 +⋯+Z2d) with standardnormals,explainwhythe χ2 d distribution hasmean d.(b) Fromtherepresentation T = Z~»X2~d, explainwhythe t distribution convergestothe standard normalas d → ∞. (Hint:
Theoryexiststhatjustifiessubstitutingtheestimatedstandarderrorforthetrueoneinforming a pivotalquantity.Hereweshowthisforaproportion.(a) The continuousmappingtheorem states thatcontinuousfunctionspreservelimits eveniftheirargumentsaresequencesofrandomvariables.Inparticular,if Xn p→c and if g() is
UsetheMarkovinequality(Exercise2.50)toshowthatas n → ∞:(a) If ˆθ is mean-squared-errorconsistent in thesensethat E(ˆθ − θ)2 → 0, then ˆθp→θ.(b) If E(ˆθ) → θ and var(ˆθ) → 0, then ˆθp→θ. (Here,useMSE(ˆθ) = var(ˆθ) + (bias)2.)
LongbeforeRonaldFisher proposedthemaximumlikelihoodmethodin1922,in1894Karl Pearsonproposedthe methodofmoments. Thisexpressesthemeanoftheprobability distribution intermsoftheparameterandequatesittothesamplemean.Fortwoparameters, youequatethefirsttwomoments.Let Y1, ...,Yn be n
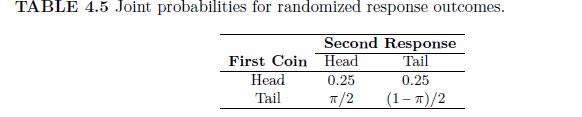
estimates π.(c) Usingthisapproach,200subjectsareaskedwhethertheyhaveeverknowinglycheated on theirincometax.Reporttheestimateof π if thenumberofreportedheadsequals(i)50, (ii)100. TABLE 4.5 Joint probabilities for randomized response outcomes. Second Response First Coin Head Tail Head 0.25 0.25
Inestimatingtheprobability π of the yes responseonasensitivequestion,themethodof randomizedresponse can beusedtoencouragesubjectstomakeresponses.Thesubjectis askedtoflipacoin,insecret.Ifitisahead,thesubjecttossesthecoinoncemoreandreports the
to showtheinfluenceof ρ on thelikelyvaluesfor P(D S +).
Showing 2600 - 2700
of 5564
First
20
21
22
23
24
25
26
27
28
29
30
31
32
33
34
Last
Step by Step Answers